South Jordan, UT (Utah) Houses and Residents
Estimated median house or condo value in 2022: $642,600 (it was $222,700 in 2000 )
South Jordan:
$642,600Utah:
$499,500
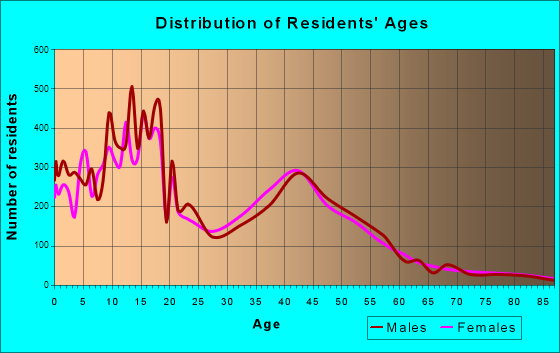
Lower value quartile - upper value quartile: $477,600 - $839,300Total population: 62,781 (Urban population: 29,021, Rural population: 440 (all nonfarm) )
Houses: 28,192 (27,734 occupied: 22,329 owner occupied, 5,405 renter occupied )
% of renters here:
19%State:
29%
Housing density: 1,351 houses/condos per square mile
Median price asked for vacant for-sale houses and condos in 2022: $796,484.
Median contract rent in 2022: $1,732 (lower quartile is $1,419, upper quartile is over $2,000)
Median rent asked for vacant for-rent units in 2022: $2,309
Median gross rent in South Jordan, UT in 2022: $1,841
Housing units in South Jordan with a mortgage: 17,144 (2,633 second mortgage, 0 home equity loan, 2,576 both second mortgage and home equity loan )Houses without a mortgage: 248
Median household income for houses/condos with a mortgage: $147,980
Median household income for apartments without a mortgage: $116,351
Median monthly housing costs: $1,827
Data:
Median house or condo value ($)
Median house or condo value ($ change since 2000)
Median house or condo value ($) - White
Median house or condo value ($) - Black or African American
Median house or condo value ($) - Asian
Median house or condo value ($) - Hispanic or Latino
Median house or condo value ($) - American Indian and Alaska Native
Median house or condo value ($) - Multirace
Median house or condo value ($) - Other Race
Median price asked for mobile homes ($)
Household density (households per square mile)
Mean house or condo value by units in structure - 1, detached ($)
Mean house or condo value by units in structure - 1, attached ($)
Mean house or condo value by units in structure - 2 ($)
Mean house or condo value by units in structure by units in structure - 3 or 4 ($)
Mean house or condo value by units in structure - 5 or more ($)
Mean house or condo value by units in structure - Boat, RV, van, etc. ($)
Mean house or condo value by units in structure - Mobile home ($)
Median contract rent ($)
Median contract rent - Lower quartile ($)
Median contract rent - Upper quartile ($)
Median gross rent ($)
Urban houses (%)
Rural houses (%)
Houses occupied (%)
Houses occupied (% change since 2000)
Houses owner occupied (%)
Houses owner occupied (% change since 2000)
Houses renter occupied (%)
Houses renter occupied (% change since 2000)
Vacant housing units - For rent (%)
Vacant housing units - For rent (% change since 2000)
Vacant housing units - For sale only (%)
Vacant housing units - For sale only (% change since 2000)
Vacant housing units - Rented or sold, not occupied (%)
Vacant housing units - Rented or sold, not occupied (% change since 2000)
Vacant housing units - For seasonal, recreational, or occasional use (%)
Vacant housing units - For seasonal, recreational, or occasional use (% change since 2000)
Vacant housing units - For migrant workers (%)
Vacant housing units - For migrant workers (% change since 2000)
Vacant housing units - Other vacant (%)
Vacant housing units - Other vacant (% change since 2000)
Median monthly housing costs ($)
Median household income for houses/condos with a mortgage ($)
Median household income for houses/condos without a mortgage ($)
Median household income ($)
Median household income ($) - White
Median household income ($) - Black or African American
Median household income ($) - Asian
Median household income ($) - Hispanic or Latino
Median household income ($) - American Indian and Alaska Native
Median household income ($) - Multirace
Median household income ($) - Other Race
Mortgage status - with mortgage (%)
Mortgage status - with second mortgage (%)
Mortgage status - with home equity loan (%)
Mortgage status - with both second mortgage and home equity loan (%)
Mortgage status - without a mortgage (%)
Median year house/condo built
Median year apartment built
Household type by relationship - Male householder living alone (%)
Household type by relationship - Male householder not living alone (%)
Household type by relationship - Female householder living alone (%)
Household type by relationship - Female householder not living alone (%)
Household type by relationship - Opposite-Sex spouse (%)
Household type by relationship - Same-Sex spouse (%)
Household type by relationship - Opposite-Sex unmarried partner (%)
Household type by relationship - Same-Sex unmarried partner (%)
Household type by relationship - In group quarters (%)
Size of family households - 2-person household (%)
Size of family households - 3-person household (%)
Size of family households - 4-person household (%)
Size of family households - 5-person household (%)
Size of family households - 6-person household (%)
Size of family households - 7-or-more-person household (%)
Size of nonfamily households - 1-person household (%)
Size of nonfamily households - 2-person household (%)
Size of nonfamily households - 3-person household (%)
Size of nonfamily households - 4-person household (%)
Size of nonfamily households - 5-person household (%)
Size of nonfamily households - 6-person household (%)
Size of nonfamily households - 7-or-moreperson household (%)
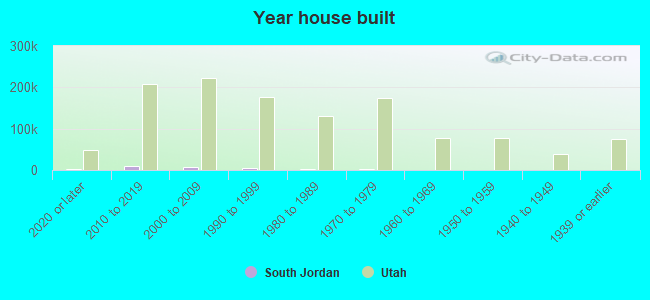
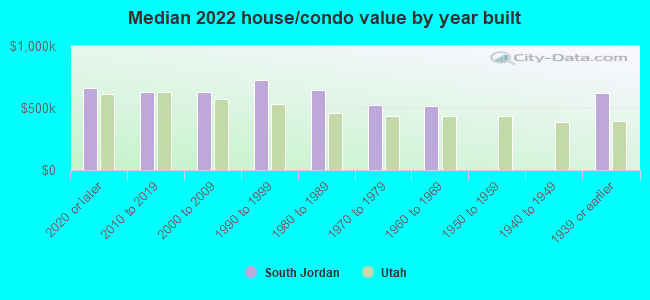
Year house built - Built 2010 or later (%)
Year house built - Built 2000 to 2009 (%)
Year house built - Built 1990 to 1999 (%)
Year house built - Built 1980 to 1989 (%)
Year house built - Built 1970 to 1979 (%)
Year house built - Built 1960 to 1969 (%)
Year house built - Built 1950 to 1959 (%)
Year house built - Built 1940 to 1949 (%)
Year house built - Built 1939 or earlier (%)
Median number of rooms in houses and condos
Median number of rooms in apartments
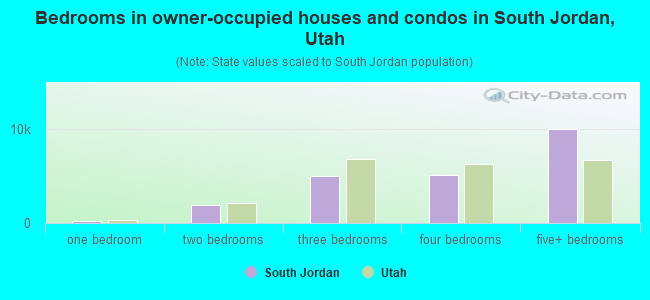
Median number of bedrooms in owner occupied houses
Mean number of bedrooms in owner occupied houses
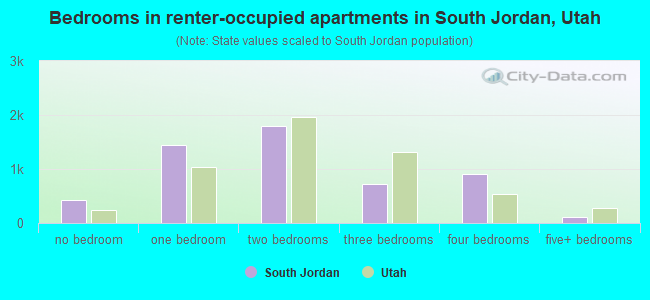
Median number of bedrooms in renter occupied houses
Mean number of bedrooms in renter occupied houses
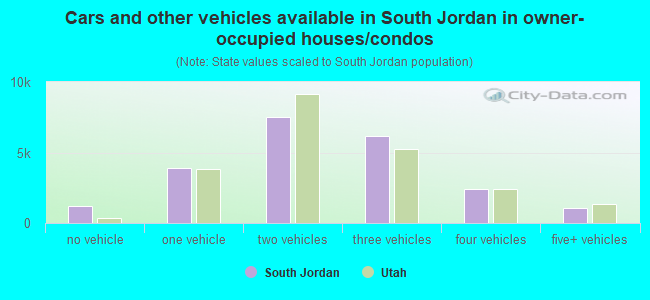
Median number of vehichles in owner occupied houses
Mean number of vehichles in owner occupied houses
Median number of vehichles in renter occupied houses
Mean number of vehichles in renter occupied houses
Rooms in owner-occupied houses - 1 room (%)
Rooms in owner-occupied houses - 2 rooms (%)
Rooms in owner-occupied houses - 3 rooms (%)
Rooms in owner-occupied houses - 4 rooms (%)
Rooms in owner-occupied houses - 5 rooms (%)
Rooms in owner-occupied houses - 6 rooms (%)
Rooms in owner-occupied houses - 7 rooms (%)
Rooms in owner-occupied houses - 8 rooms (%)
Rooms in owner-occupied houses - 9+ rooms (%)
Rooms in renter-occupied houses - 1 room (%)
Rooms in renter-occupied houses - 2 rooms (%)
Rooms in renter-occupied houses - 3 rooms (%)
Rooms in renter-occupied houses - 4 rooms (%)
Rooms in renter-occupied houses - 5 rooms (%)
Rooms in renter-occupied houses - 6 rooms (%)
Rooms in renter-occupied houses - 7 rooms (%)
Rooms in renter-occupied houses - 8 rooms (%)
Rooms in renter-occupied houses - 9+ rooms (%)
Bedrooms in owner-occupied houses - no bedrooms (%)
Bedrooms in owner-occupied houses - 1 bedroom (%)
Bedrooms in owner-occupied houses - 2 bedrooms (%)
Bedrooms in owner-occupied houses - 3 bedrooms (%)
Bedrooms in owner-occupied houses - 4 bedrooms (%)
Bedrooms in owner-occupied houses - 5+ bedrooms (%)
Bedrooms in renter-occupied houses - no bedrooms (%)
Bedrooms in renter-occupied houses - 1 bedroom (%)
Bedrooms in renter-occupied houses - 2 bedrooms (%)
Bedrooms in renter-occupied houses - 3 bedrooms (%)
Bedrooms in renter-occupied houses - 4 bedrooms (%)
Bedrooms in renter-occupied houses - 5+ bedrooms (%)
Vehicles available in owner-occupied houses - no vehicle available (%)
Vehicles available in owner-occupied houses - 1 vehicle available(%)
Vehicles available in owner-occupied houses - 2 Vehicles available (%)
Vehicles available in owner-occupied houses - 3 Vehicles available (%)
Vehicles available in owner-occupied houses - 4 Vehicles available (%)
Vehicles available in owner-occupied houses - 5+ Vehicles available (%)
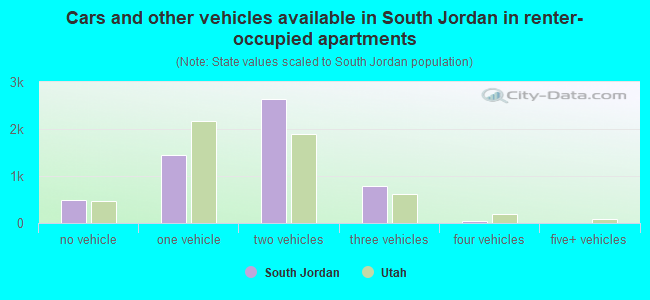
Vehicles available in renter-occupied houses - no vehicle available (%)
Vehicles available in renter-occupied houses - 1 vehicle available (%)
Vehicles available in renter-occupied houses - 2 Vehicles available (%)
Vehicles available in renter-occupied houses - 3 Vehicles available (%)
Vehicles available in renter-occupied houses - 4 Vehicles available (%)
Vehicles available in renter-occupied houses - 5+ Vehicles available (%)
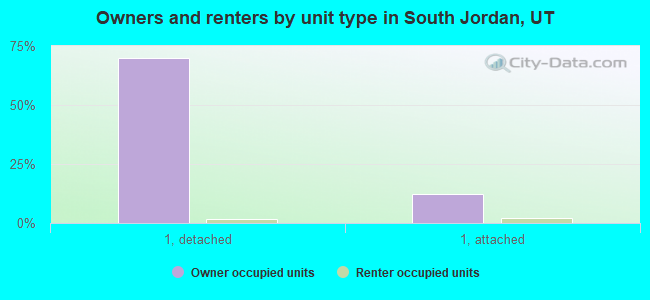
Housing units in structures - 1, detached (%)
Housing units in structures - 1, attached (%)
Housing units in structures - 2 (%)
Housing units in structures - 3 or 4 (%)
Housing units in structures - 5 to 9 (%)
Housing units in structures - 10 to 19 (%)
Housing units in structures - 20 to 49 (%)
Housing units in structures - 50 or more (%)
Housing units in structures - Mobile home (%)
Housing units in structures - Boat, RV, van, etc. (%)
Housing units in structures - Owners - 1, detached (%)
Housing units in structures - Owners - 1, attached (%)
Housing units in structures - Owners - 2 (%)
Housing units in structures - Owners - 3 or 4 (%)
Housing units in structures - Owners - 5 to 9 (%)
Housing units in structures - Owners - 10 to 19 (%)
Housing units in structures - Owners - 20 to 49 (%)
Housing units in structures - Owners - 50 or more (%)
Housing units in structures - Owners - Mobile home (%)
Housing units in structures - Owners - Boat, RV, van, etc. (%)
Housing units in structures - Renters - 1, detached (%)
Housing units in structures - Renters - 1, attached (%)
Housing units in structures - Renters - 2 (%)
Housing units in structures - Renters - 3 or 4 (%)
Housing units in structures - Renters - 5 to 9 (%)
Housing units in structures - Renters - 10 to 19 (%)
Housing units in structures - Renters - 20 to 49 (%)
Housing units in structures - Renters - 50 or more (%)
Housing units in structures - Renters - Mobile home (%)
Housing units in structures - Renters - Boat, RV, van, etc. (%)
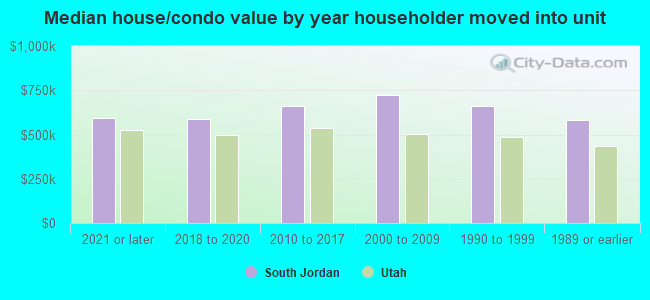
House/condo owner moved in on average (years ago)
Renter moved in on average (years ago)
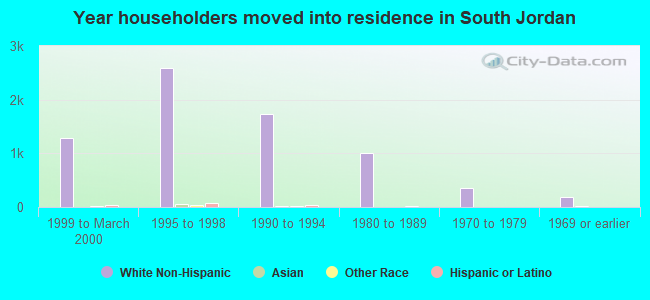
Year householder moved into unit - Moved in 1999 to March 2000 (%)
Year householder moved into unit - Moved in 1999 to March 2000 (%) - White
Year householder moved into unit - Moved in 1999 to March 2000 (%) - Black or African American
Year householder moved into unit - Moved in 1999 to March 2000 (%) - Asian
Year householder moved into unit - Moved in 1999 to March 2000 (%) - Hispanic or Latino
Year householder moved into unit - Moved in 1999 to March 2000 (%) - American Indian and Alaska Native
Year householder moved into unit - Moved in 1999 to March 2000 (%) - Multirace
Year householder moved into unit - Moved in 1999 to March 2000 (%) - Other Race
Year householder moved into unit - Moved in 1995 to 1998 (%)
Year householder moved into unit - Moved in 1995 to 1998 (%) - White
Year householder moved into unit - Moved in 1995 to 1998 (%) - Black or African American
Year householder moved into unit - Moved in 1995 to 1998 (%) - Asian
Year householder moved into unit - Moved in 1995 to 1998 (%) - Hispanic or Latino
Year householder moved into unit - Moved in 1995 to 1998 (%) - American Indian and Alaska Native
Year householder moved into unit - Moved in 1995 to 1998 (%) - Multirace
Year householder moved into unit - Moved in 1995 to 1998 (%) - Other Race
Year householder moved into unit - Moved in 1990 to 1994 (%)
Year householder moved into unit - Moved in 1990 to 1994 (%) - White
Year householder moved into unit - Moved in 1990 to 1994 (%) - Black or African American
Year householder moved into unit - Moved in 1990 to 1994 (%) - Asian
Year householder moved into unit - Moved in 1990 to 1994 (%) - Hispanic or Latino
Year householder moved into unit - Moved in 1990 to 1994 (%) - American Indian and Alaska Native
Year householder moved into unit - Moved in 1990 to 1994 (%) - Multirace
Year householder moved into unit - Moved in 1990 to 1994 (%) - Other Race
Year householder moved into unit - Moved in 1980 to 1989 (%)
Year householder moved into unit - Moved in 1980 to 1989 (%) - White
Year householder moved into unit - Moved in 1980 to 1989 (%) - Black or African American
Year householder moved into unit - Moved in 1980 to 1989 (%) - Asian
Year householder moved into unit - Moved in 1980 to 1989 (%) - Hispanic or Latino
Year householder moved into unit - Moved in 1980 to 1989 (%) - American Indian and Alaska Native
Year householder moved into unit - Moved in 1980 to 1989 (%) - Multirace
Year householder moved into unit - Moved in 1980 to 1989 (%) - Other Race
Year householder moved into unit - Moved in 1970 to 1979 (%)
Year householder moved into unit - Moved in 1970 to 1979 (%) - White
Year householder moved into unit - Moved in 1970 to 1979 (%) - Black or African American
Year householder moved into unit - Moved in 1970 to 1979 (%) - Asian
Year householder moved into unit - Moved in 1970 to 1979 (%) - Hispanic or Latino
Year householder moved into unit - Moved in 1970 to 1979 (%) - American Indian and Alaska Native
Year householder moved into unit - Moved in 1970 to 1979 (%) - Multirace
Year householder moved into unit - Moved in 1970 to 1979 (%) - Other Race
Year householder moved into unit - Moved in 1969 or earlier (%)
Year householder moved into unit - Moved in 1969 or earlier (%) - White
Year householder moved into unit - Moved in 1969 or earlier (%) - Black or African American
Year householder moved into unit - Moved in 1969 or earlier (%) - Asian
Year householder moved into unit - Moved in 1969 or earlier (%) - Hispanic or Latino
Year householder moved into unit - Moved in 1969 or earlier (%) - American Indian and Alaska Native
Year householder moved into unit - Moved in 1969 or earlier (%) - Multirace
Year householder moved into unit - Moved in 1969 or earlier (%) - Other Race
Housing units lacking complete plumbing facilities (%)
Housing units lacking complete kitchen facilities (%)
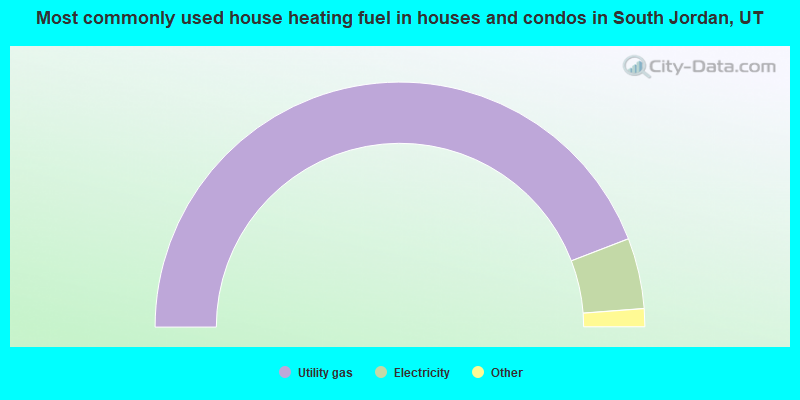
House heating fuel used in houses and condos - Utility gas (%)
House heating fuel used in houses and condos - Bottled, tank, or LP gas (%)
House heating fuel used in houses and condos - Electricity (%)
House heating fuel used in houses and condos - Fuel oil, kerosene, etc. (%)
House heating fuel used in houses and condos - Coal or coke (%)
House heating fuel used in houses and condos - Wood (%)
House heating fuel used in houses and condos - Solar energy (%)
House heating fuel used in houses and condos - Other fuel (%)
House heating fuel used in houses and condos - No fuel used (%)
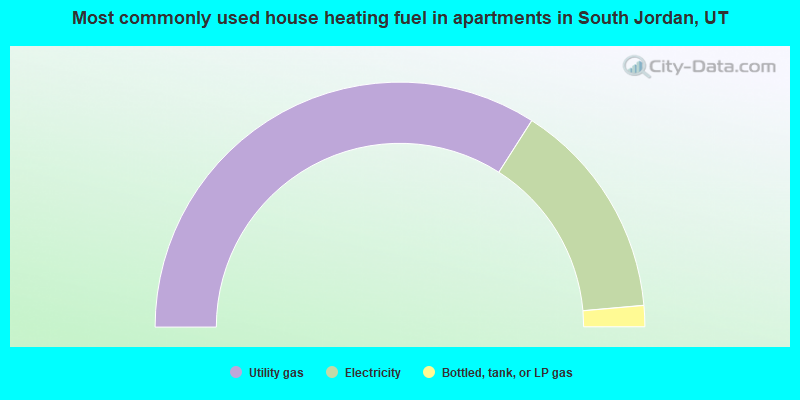
House heating fuel used in apartments - Utility gas (%)
House heating fuel used in apartments - Bottled, tank, or LP gas (%)
House heating fuel used in apartments - Electricity (%)
House heating fuel used in apartments - Fuel oil, kerosene, etc. (%)
House heating fuel used in apartments - Coal or coke (%)
House heating fuel used in apartments - Wood (%)
House heating fuel used in apartments - Solar energy (%)
House heating fuel used in apartments - Other fuel (%)
House heating fuel used in apartments - No fuel used (%)
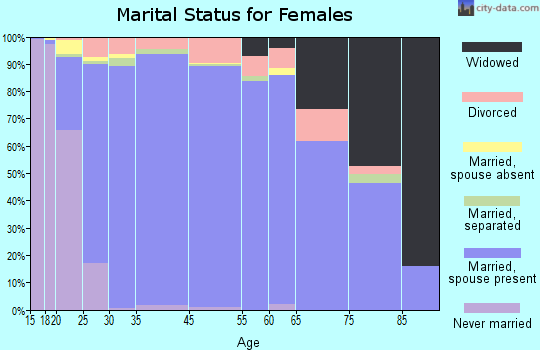
Median year house/condo built: 2006Median year apartment built: 2011Household type by relationship:
Households: 83,520
Male householders: 15,036 (1,369 living alone ), Female householders: 12,698 (2,908 living alone )18,321 spouses (17,715 opposite-sex spouses ), 1,379 unmarried partners , (1,379 opposite-sex unmarried partners ), 29,086 children (26,124 natural , 1,179 adopted , 1,783 stepchildren ), 1,660 grandchildren , 158 brothers or sisters , 571 parents , 58 foster children , 1,098 other relatives , 3,289 non-relatives In group quarters: 166
Size of family households: 7,627 2-persons , 4,463 3-persons , 3,677 4-persons , 3,101 5-persons , 1,715 6-persons , 690 7-or-more-persons .
Size of nonfamily households: 4,277 1-person , 1,123 2-persons , 367 3-persons , 694 4-persons .
20,598 married couples with children. single-parent households (739 men , 1,570 women ).
88.2% of residents of South Jordan speak English at home. of residents speak Spanish at home (74% speak English very well , 16% speak English well , 9% speak English not well , 1% don't speak English at all ).of residents speak other Indo-European language at home (80% speak English very well , 12% speak English well , 5% speak English not well , 3% don't speak English at all ).of residents speak Asian or Pacific Island language at home (78% speak English very well , 15% speak English well , 5% speak English not well , 2% don't speak English at all ).of residents speak other language at home (100% speak English very well ).
Foreign born population: 5,767 (6.9%)of them are naturalized citizens )
Median number of rooms in houses and condos:
Median number of rooms in apartments
Owner-occupied Renter-occupied
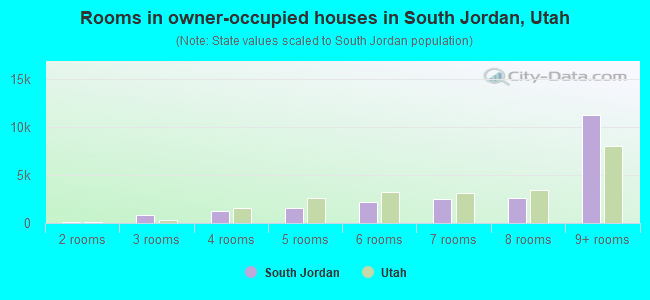
Rooms in owner-occupied houses in South Jordan, Utah
0 1 room 143 2 rooms 813 3 rooms 1,217 4 rooms 1,561 5 rooms 2,176 6 rooms 2,539 7 rooms 2,647 8 rooms 11,233 9+ rooms
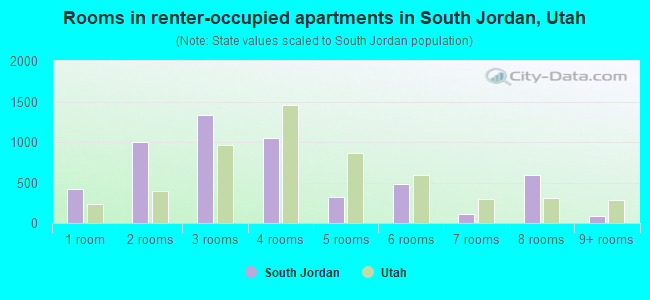
Rooms in renter-occupied apartments in South Jordan, Utah
418 1 room 1,004 2 rooms 1,337 3 rooms 1,052 4 rooms 327 5 rooms 483 6 rooms 111 7 rooms 590 8 rooms 83 9+ rooms
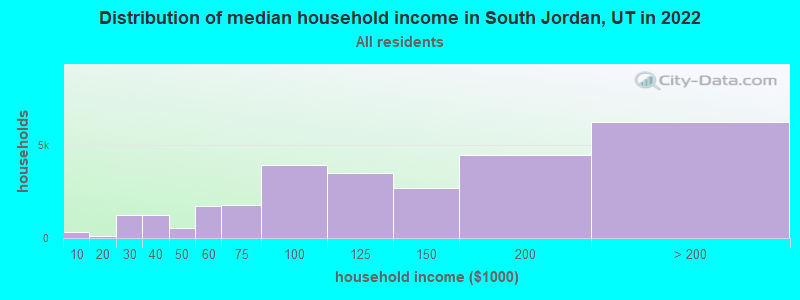
South Jordan, UT household income distribution 347 Less than $10,000118 $10,000 to $19,9991,213 $20,000 to $29,9991,237 $30,000 to $39,999533 $40,000 to $49,9991,729 $50,000 to $59,9991,768 $60,000 to $74,9993,941 $75,000 to $99,9993,486 $100,000 to $124,9992,669 $125,000 to $149,9994,448 $150,000 to $199,9996,245 $200,000 or more
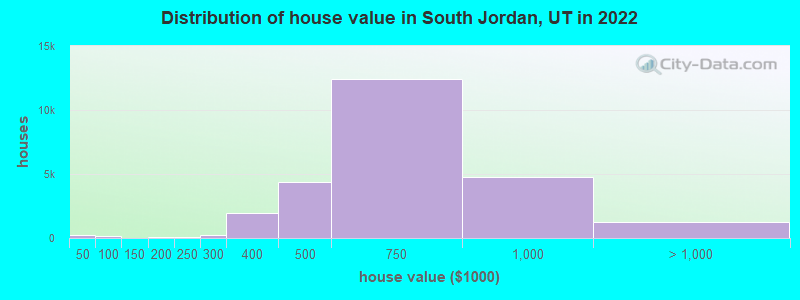
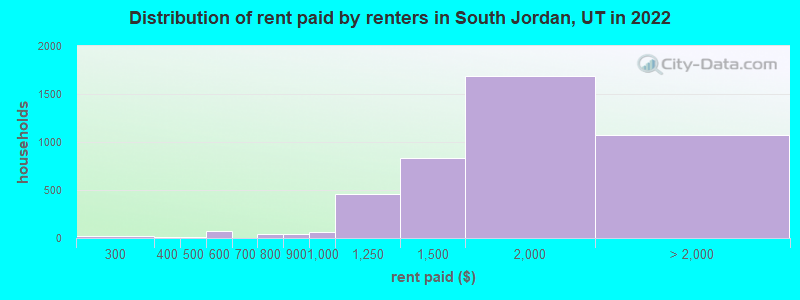
Home value of owner - occupied houses in 2022 in South Jordan, UT 134 Less than $10,00037 $35,000 to $39,99933 $40,000 to $49,99955 $70,000 to $79,99922 $80,000 to $89,99913 $90,000 to $99,99927 $100,000 to $124,99992 $150,000 to $174,99922 $175,000 to $199,99986 $200,000 to $249,999214 $250,000 to $299,9991,955 $300,000 to $399,9994,382 $400,000 to $499,99912,450 $500,000 to $749,9994,758 $750,000 to $999,999984 $1,000,000 to $1,499,999123 $1,500,000 to $1,999,999135 $2,000,000 or moreRent paid by renters in 2022 in South Jordan, UT 13 $200 to $2498 $250 to $29911 $300 to $34910 $400 to $44972 $550 to $5994 $650 to $69944 $700 to $74936 $800 to $89957 $900 to $999456 $1,000 to $1,249837 $1,250 to $1,4991,683 $1,500 to $1,999832 $2,000 to $2,49943 $2,500 to $2,99944 $3,000 to $3,49961 $3,500 or more90 No cash rent
Percentage of workers working in this county: 93.0%Number of people working at home: 9,099 (22.5% of all workers )
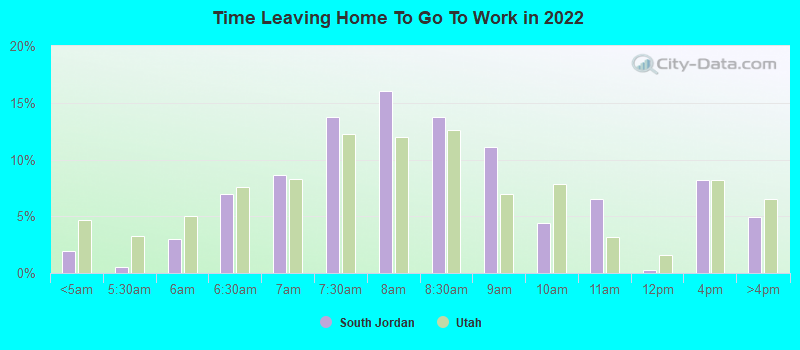
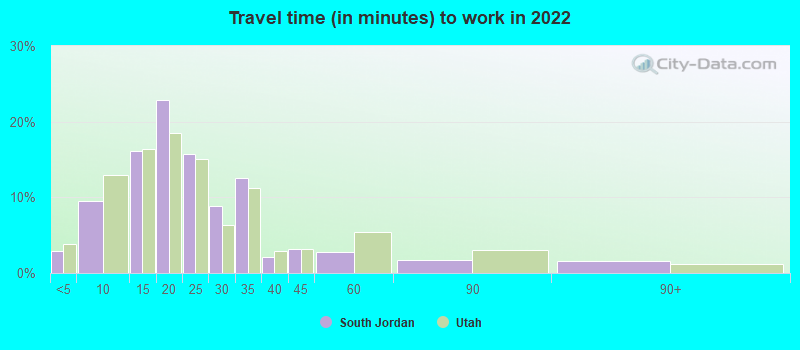
Travel time to work (commute)
Less than 5 minutes: 1,1305 to 9 minutes: 2,31010 to 14 minutes: 4,19315 to 19 minutes: 5,18920 to 24 minutes: 5,81325 to 29 minutes: 3,24830 to 34 minutes: 4,68135 to 39 minutes: 2,03040 to 44 minutes: 2,70245 to 59 minutes: 2,06760 to 89 minutes: 1,01990 or more minutes: 0
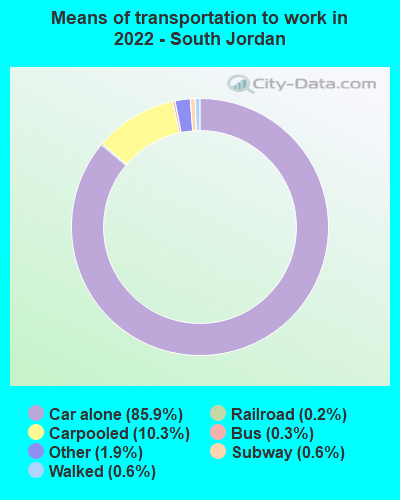
Means of transportation to work:
Drove a car alone: 20,560 (63.9%)Carpooled: 2,656 (8.3%)Bus : 59 (0.2%)Subway or elevated rail : 12 (0.0%)Long-distance train or commuter rail : 83 (0.3%)Light rail, streetcar or trolley : 42 (0.1%)Ferryboat: 4 (0.0%)Taxi: 459 (1.4%)Bicycle: 16 (0.0%)Walked: 156 (0.5%)Worked at home: 9,099 (28.3%)
Unemployment by race in 2022
Unemployment rate for White non-Hispanic residents 1.5% Males0.8% FemalesUnemployment rate for American Indian and Alaska Native residents 19.4% MalesUnemployment rate for Asian residents 3.2% Males0.5% FemalesUnemployment rate for other race residents 4.8% FemalesUnemployment rate for two or more race residents 2.7% Males2.8% FemalesUnemployment rate for Hispanic or Latino residents 0.9% Males1.4% Females
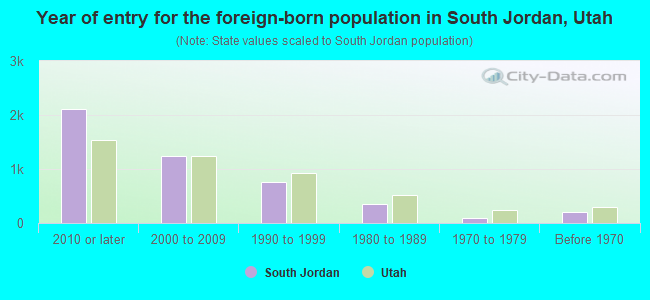
Year of entry for the foreign-born population in South Jordan, Utah
2,112 2010 or later 1,235 2000 to 2009 755 1990 to 1999 353 1980 to 1989 95 1970 to 1979 198 Before 1970
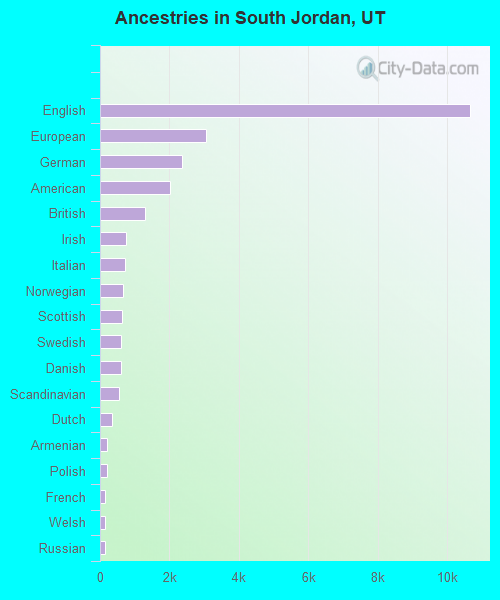
First ancestries reported:
English: 10,670 (29.3%)
European: 3,061 (8.4%)
German: 2,360 (6.5%)
American: 2,004 (5.5%)
British: 1,285 (3.5%)
Irish: 754 (2.1%)
Italian: 732 (2.0%)
Norwegian: 655 (1.8%)
Scottish: 620 (1.7%)
Swedish: 614 (1.7%)
Danish: 602 (1.7%)
Scandinavian: 555 (1.5%)
Dutch: 355 (1.0%)
Armenian: 206 (0.6%)
Polish: 201 (0.6%)
French: 156 (0.4%)
Welsh: 153 (0.4%)
Russian: 139 (0.4%)
Swiss: 95 (0.3%)
Brazilian: 87 (0.2%)
Greek: 84 (0.2%)
Northern European: 81 (0.2%)
Finnish: 73 (0.2%)
Scotch-Irish: 71 (0.2%)
Palestinian: 62 (0.2%)
Canadian: 56 (0.2%)
Iranian: 48 (0.1%)
Belgian: 46 (0.1%)
Czechoslovakian: 31 (0.09%)
Eastern European: 27 (0.07%)
Lebanese: 26 (0.07%)
Belizean: 21 (0.06%)
Israeli: 20 (0.05%)
Basque: 18 (0.05%)
Ukrainian: 18 (0.05%)
Austrian: 16 (0.04%)
Romanian: 14 (0.04%)
Portuguese: 12 (0.03%)
Somali: 12 (0.03%)
French Canadian: 10 (0.03%)
Sudanese: 7 (0.02%)
Croatian: 6 (0.02%)
Australian: 6 (0.02%)
Icelander: 4 (0.01%) Most common places of birth for foreign-born residents (%): India South Jordan:
14.9% (783)Utah:
3.0% (8,294)
Mexico South Jordan:
13.2% (693)Utah:
36.1% (99,740)
Venezuela South Jordan:
9.4% (496)Utah:
3.2% (8,804)
Korea South Jordan:
5.7% (299)Utah:
1.6% (4,524)
China, excluding Hong Kong and Taiwan South Jordan:
5.0% (263)Utah:
2.9% (8,017)
Peru South Jordan:
4.3% (225)Utah:
2.9% (7,901)
Canada South Jordan:
3.9% (203)Utah:
3.0% (8,341)
Guatemala South Jordan:
3.5% (183)Utah:
2.1% (5,902)
Vietnam South Jordan:
3.3% (172)Utah:
2.6% (7,211)
Oceania, n.e.c. South Jordan:
3.0% (156)Utah:
2.7% (7,472)
Brazil South Jordan:
2.2% (115)Utah:
2.8% (7,644)
Poland South Jordan:
2.1% (112)Utah:
0.3% (865)
Philippines South Jordan:
2.1% (108)Utah:
2.3% (6,468)
Other Australian and New Zealand Subregion South Jordan:
1.8% (97)Utah:
0.4% (1,021)
Russia South Jordan:
1.7% (89)Utah:
0.6% (1,555)
Sri Lanka South Jordan:
1.6% (85)Utah:
0.1% (198)
Singapore South Jordan:
1.6% (83)Utah:
0.1% (351)
Place of birth for U.S.-born residents:
This state: 51,452Other state: 25,600Northeast: 2,792Midwest: 5,728South: 4,146West: 12,934 86.1% of South Jordan residents lived in the same house 1 years ago.
Out of people who lived in different houses, 40.4% lived in this county.
Out of people who lived in different counties, 24.8% lived in Utah.
South Jordan:
86.1%State average:
85.7%
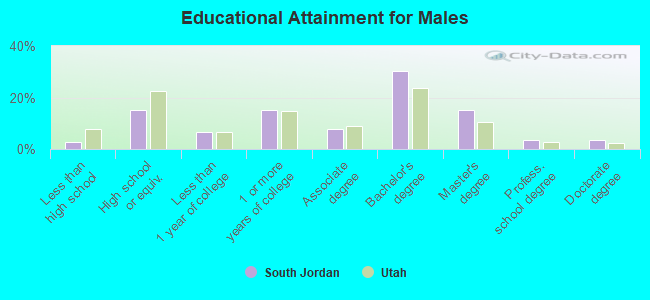
Education attainment for males 25 years and older:
No schooling: 218Nursery to 4th grade: 75th and 6th grade: 947th and 8th grade: 759th grade: 2910th grade: 1211th grade: 7712th grade, no diploma: 180High school graduate (or equivalency): 3,665Less than 1 year of college: 1,555Some college more than 1 year, no degree: 3,694Associate degree: 1,889Bachelor's degree: 7,319Master's degree: 3,685Professional school degree: 822Doctorate degree: 807
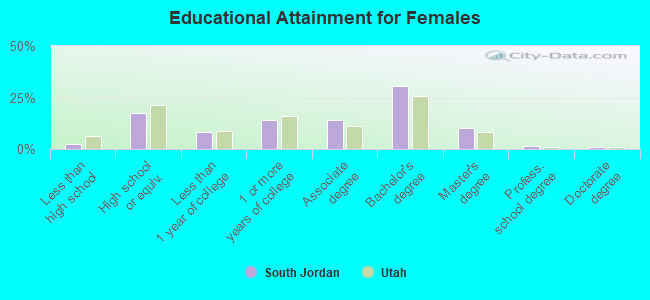
Education attainment for females 25 years and older:
No schooling: 59Nursery to 4th grade: 05th and 6th grade: 07th and 8th grade: 1339th grade: 10210th grade: 1911th grade: 9212th grade, no diploma: 197High school graduate (or equivalency): 4,486Less than 1 year of college: 2,125Some college more than 1 year, no degree: 3,650Associate degree: 3,578Bachelor's degree: 7,817Master's degree: 2,565Professional school degree: 383Doctorate degree: 280
Housing units in structures:
One, detached: 18,700One, attached: 4,9243 or 4: 435 to 9: 68110 to 19: 77620 to 49: 53950 or more: 2,529Housing units lacking complete kitchen facilities in 2022: 1.6%House/condo owner moved in on average 7 years ago
Renter moved in on average 2 years ago
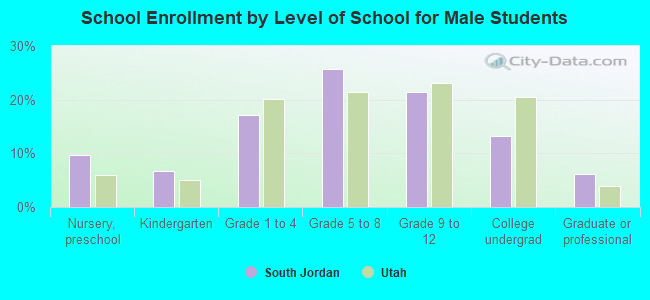
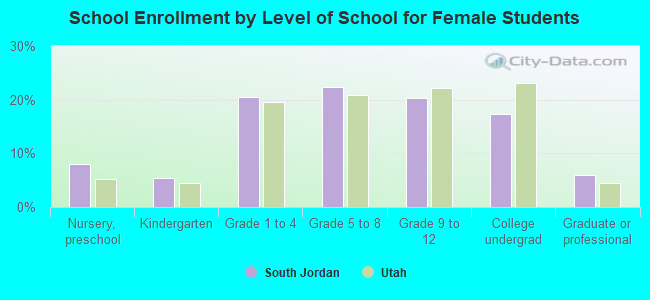
Private vs. public school enrollment:
Students in private schools in grades 1 to 8 (elementary and middle school): 784 Students in private schools in grades 9 to 12 (high school): 0 Students in private undergraduate colleges: 996