South Huntington, NY (New York) Houses and Residents
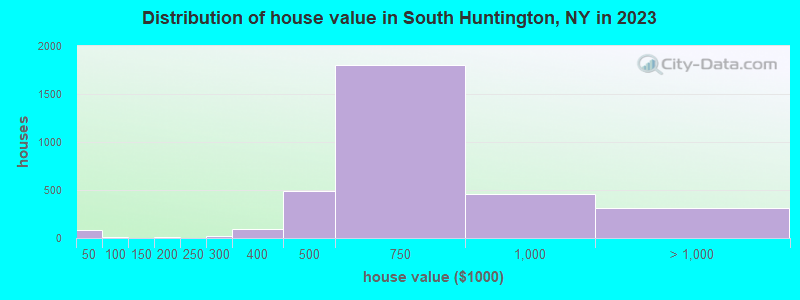
Estimated median house or condo value in 2022: $638,095 (it was $226,400 in 2000 )
South Huntington:
$638,095New York:
$400,400
Lower value quartile - upper value quartile: $488,238 - $752,713Total population: 9,422 (All urban)
Houses: 3,537 (3,464 occupied: 3,060 owner occupied, 402 renter occupied )
% of renters here:
12%State:
46%
Housing density: 1,047 houses/condos per square mile
Median price asked for vacant for-sale houses and condos in 2022: $22,054,336.
Median contract rent in 2022: $1,862 (lower quartile is $1,133, upper quartile is over $2,000)
Median rent asked for vacant for-rent units in 2022: $3,833
Median gross rent in South Huntington, NY in 2022: $1,916
Housing units in South Huntington with a mortgage: 1,774 (296 second mortgage, 46 home equity loan, 229 both second mortgage and home equity loan )Houses without a mortgage: 111
Median household income for houses/condos with a mortgage: $169,891
Median household income for apartments without a mortgage: $116,010
Median monthly housing costs: $2,268
Data:
Median house or condo value ($)
Median house or condo value ($ change since 2000)
Median house or condo value ($) - White
Median house or condo value ($) - Black or African American
Median house or condo value ($) - Asian
Median house or condo value ($) - Hispanic or Latino
Median house or condo value ($) - American Indian and Alaska Native
Median house or condo value ($) - Multirace
Median house or condo value ($) - Other Race
Median price asked for mobile homes ($)
Household density (households per square mile)
Mean house or condo value by units in structure - 1, detached ($)
Mean house or condo value by units in structure - 1, attached ($)
Mean house or condo value by units in structure - 2 ($)
Mean house or condo value by units in structure by units in structure - 3 or 4 ($)
Mean house or condo value by units in structure - 5 or more ($)
Mean house or condo value by units in structure - Boat, RV, van, etc. ($)
Mean house or condo value by units in structure - Mobile home ($)
Median contract rent ($)
Median contract rent - Lower quartile ($)
Median contract rent - Upper quartile ($)
Median gross rent ($)
Urban houses (%)
Rural houses (%)
Houses occupied (%)
Houses occupied (% change since 2000)
Houses owner occupied (%)
Houses owner occupied (% change since 2000)
Houses renter occupied (%)
Houses renter occupied (% change since 2000)
Vacant housing units - For rent (%)
Vacant housing units - For rent (% change since 2000)
Vacant housing units - For sale only (%)
Vacant housing units - For sale only (% change since 2000)
Vacant housing units - Rented or sold, not occupied (%)
Vacant housing units - Rented or sold, not occupied (% change since 2000)
Vacant housing units - For seasonal, recreational, or occasional use (%)
Vacant housing units - For seasonal, recreational, or occasional use (% change since 2000)
Vacant housing units - For migrant workers (%)
Vacant housing units - For migrant workers (% change since 2000)
Vacant housing units - Other vacant (%)
Vacant housing units - Other vacant (% change since 2000)
Median monthly housing costs ($)
Median household income for houses/condos with a mortgage ($)
Median household income for houses/condos without a mortgage ($)
Median household income ($)
Median household income ($) - White
Median household income ($) - Black or African American
Median household income ($) - Asian
Median household income ($) - Hispanic or Latino
Median household income ($) - American Indian and Alaska Native
Median household income ($) - Multirace
Median household income ($) - Other Race
Mortgage status - with mortgage (%)
Mortgage status - with second mortgage (%)
Mortgage status - with home equity loan (%)
Mortgage status - with both second mortgage and home equity loan (%)
Mortgage status - without a mortgage (%)
Median year house/condo built
Median year apartment built
Household type by relationship - Male householder living alone (%)
Household type by relationship - Male householder not living alone (%)
Household type by relationship - Female householder living alone (%)
Household type by relationship - Female householder not living alone (%)
Household type by relationship - Opposite-Sex spouse (%)
Household type by relationship - Same-Sex spouse (%)
Household type by relationship - Opposite-Sex unmarried partner (%)
Household type by relationship - Same-Sex unmarried partner (%)
Household type by relationship - In group quarters (%)
Size of family households - 2-person household (%)
Size of family households - 3-person household (%)
Size of family households - 4-person household (%)
Size of family households - 5-person household (%)
Size of family households - 6-person household (%)
Size of family households - 7-or-more-person household (%)
Size of nonfamily households - 1-person household (%)
Size of nonfamily households - 2-person household (%)
Size of nonfamily households - 3-person household (%)
Size of nonfamily households - 4-person household (%)
Size of nonfamily households - 5-person household (%)
Size of nonfamily households - 6-person household (%)
Size of nonfamily households - 7-or-moreperson household (%)
Year house built - Built 2010 or later (%)
Year house built - Built 2000 to 2009 (%)
Year house built - Built 1990 to 1999 (%)
Year house built - Built 1980 to 1989 (%)
Year house built - Built 1970 to 1979 (%)
Year house built - Built 1960 to 1969 (%)
Year house built - Built 1950 to 1959 (%)
Year house built - Built 1940 to 1949 (%)
Year house built - Built 1939 or earlier (%)
Median number of rooms in houses and condos
Median number of rooms in apartments
Median number of bedrooms in owner occupied houses
Mean number of bedrooms in owner occupied houses
Median number of bedrooms in renter occupied houses
Mean number of bedrooms in renter occupied houses
Median number of vehichles in owner occupied houses
Mean number of vehichles in owner occupied houses
Median number of vehichles in renter occupied houses
Mean number of vehichles in renter occupied houses
Rooms in owner-occupied houses - 1 room (%)
Rooms in owner-occupied houses - 2 rooms (%)
Rooms in owner-occupied houses - 3 rooms (%)
Rooms in owner-occupied houses - 4 rooms (%)
Rooms in owner-occupied houses - 5 rooms (%)
Rooms in owner-occupied houses - 6 rooms (%)
Rooms in owner-occupied houses - 7 rooms (%)
Rooms in owner-occupied houses - 8 rooms (%)
Rooms in owner-occupied houses - 9+ rooms (%)
Rooms in renter-occupied houses - 1 room (%)
Rooms in renter-occupied houses - 2 rooms (%)
Rooms in renter-occupied houses - 3 rooms (%)
Rooms in renter-occupied houses - 4 rooms (%)
Rooms in renter-occupied houses - 5 rooms (%)
Rooms in renter-occupied houses - 6 rooms (%)
Rooms in renter-occupied houses - 7 rooms (%)
Rooms in renter-occupied houses - 8 rooms (%)
Rooms in renter-occupied houses - 9+ rooms (%)
Bedrooms in owner-occupied houses - no bedrooms (%)
Bedrooms in owner-occupied houses - 1 bedroom (%)
Bedrooms in owner-occupied houses - 2 bedrooms (%)
Bedrooms in owner-occupied houses - 3 bedrooms (%)
Bedrooms in owner-occupied houses - 4 bedrooms (%)
Bedrooms in owner-occupied houses - 5+ bedrooms (%)
Bedrooms in renter-occupied houses - no bedrooms (%)
Bedrooms in renter-occupied houses - 1 bedroom (%)
Bedrooms in renter-occupied houses - 2 bedrooms (%)
Bedrooms in renter-occupied houses - 3 bedrooms (%)
Bedrooms in renter-occupied houses - 4 bedrooms (%)
Bedrooms in renter-occupied houses - 5+ bedrooms (%)
Vehicles available in owner-occupied houses - no vehicle available (%)
Vehicles available in owner-occupied houses - 1 vehicle available(%)
Vehicles available in owner-occupied houses - 2 Vehicles available (%)
Vehicles available in owner-occupied houses - 3 Vehicles available (%)
Vehicles available in owner-occupied houses - 4 Vehicles available (%)
Vehicles available in owner-occupied houses - 5+ Vehicles available (%)
Vehicles available in renter-occupied houses - no vehicle available (%)
Vehicles available in renter-occupied houses - 1 vehicle available (%)
Vehicles available in renter-occupied houses - 2 Vehicles available (%)
Vehicles available in renter-occupied houses - 3 Vehicles available (%)
Vehicles available in renter-occupied houses - 4 Vehicles available (%)
Vehicles available in renter-occupied houses - 5+ Vehicles available (%)
Housing units in structures - 1, detached (%)
Housing units in structures - 1, attached (%)
Housing units in structures - 2 (%)
Housing units in structures - 3 or 4 (%)
Housing units in structures - 5 to 9 (%)
Housing units in structures - 10 to 19 (%)
Housing units in structures - 20 to 49 (%)
Housing units in structures - 50 or more (%)
Housing units in structures - Mobile home (%)
Housing units in structures - Boat, RV, van, etc. (%)
Housing units in structures - Owners - 1, detached (%)
Housing units in structures - Owners - 1, attached (%)
Housing units in structures - Owners - 2 (%)
Housing units in structures - Owners - 3 or 4 (%)
Housing units in structures - Owners - 5 to 9 (%)
Housing units in structures - Owners - 10 to 19 (%)
Housing units in structures - Owners - 20 to 49 (%)
Housing units in structures - Owners - 50 or more (%)
Housing units in structures - Owners - Mobile home (%)
Housing units in structures - Owners - Boat, RV, van, etc. (%)
Housing units in structures - Renters - 1, detached (%)
Housing units in structures - Renters - 1, attached (%)
Housing units in structures - Renters - 2 (%)
Housing units in structures - Renters - 3 or 4 (%)
Housing units in structures - Renters - 5 to 9 (%)
Housing units in structures - Renters - 10 to 19 (%)
Housing units in structures - Renters - 20 to 49 (%)
Housing units in structures - Renters - 50 or more (%)
Housing units in structures - Renters - Mobile home (%)
Housing units in structures - Renters - Boat, RV, van, etc. (%)
House/condo owner moved in on average (years ago)
Renter moved in on average (years ago)
Year householder moved into unit - Moved in 1999 to March 2000 (%)
Year householder moved into unit - Moved in 1999 to March 2000 (%) - White
Year householder moved into unit - Moved in 1999 to March 2000 (%) - Black or African American
Year householder moved into unit - Moved in 1999 to March 2000 (%) - Asian
Year householder moved into unit - Moved in 1999 to March 2000 (%) - Hispanic or Latino
Year householder moved into unit - Moved in 1999 to March 2000 (%) - American Indian and Alaska Native
Year householder moved into unit - Moved in 1999 to March 2000 (%) - Multirace
Year householder moved into unit - Moved in 1999 to March 2000 (%) - Other Race
Year householder moved into unit - Moved in 1995 to 1998 (%)
Year householder moved into unit - Moved in 1995 to 1998 (%) - White
Year householder moved into unit - Moved in 1995 to 1998 (%) - Black or African American
Year householder moved into unit - Moved in 1995 to 1998 (%) - Asian
Year householder moved into unit - Moved in 1995 to 1998 (%) - Hispanic or Latino
Year householder moved into unit - Moved in 1995 to 1998 (%) - American Indian and Alaska Native
Year householder moved into unit - Moved in 1995 to 1998 (%) - Multirace
Year householder moved into unit - Moved in 1995 to 1998 (%) - Other Race
Year householder moved into unit - Moved in 1990 to 1994 (%)
Year householder moved into unit - Moved in 1990 to 1994 (%) - White
Year householder moved into unit - Moved in 1990 to 1994 (%) - Black or African American
Year householder moved into unit - Moved in 1990 to 1994 (%) - Asian
Year householder moved into unit - Moved in 1990 to 1994 (%) - Hispanic or Latino
Year householder moved into unit - Moved in 1990 to 1994 (%) - American Indian and Alaska Native
Year householder moved into unit - Moved in 1990 to 1994 (%) - Multirace
Year householder moved into unit - Moved in 1990 to 1994 (%) - Other Race
Year householder moved into unit - Moved in 1980 to 1989 (%)
Year householder moved into unit - Moved in 1980 to 1989 (%) - White
Year householder moved into unit - Moved in 1980 to 1989 (%) - Black or African American
Year householder moved into unit - Moved in 1980 to 1989 (%) - Asian
Year householder moved into unit - Moved in 1980 to 1989 (%) - Hispanic or Latino
Year householder moved into unit - Moved in 1980 to 1989 (%) - American Indian and Alaska Native
Year householder moved into unit - Moved in 1980 to 1989 (%) - Multirace
Year householder moved into unit - Moved in 1980 to 1989 (%) - Other Race
Year householder moved into unit - Moved in 1970 to 1979 (%)
Year householder moved into unit - Moved in 1970 to 1979 (%) - White
Year householder moved into unit - Moved in 1970 to 1979 (%) - Black or African American
Year householder moved into unit - Moved in 1970 to 1979 (%) - Asian
Year householder moved into unit - Moved in 1970 to 1979 (%) - Hispanic or Latino
Year householder moved into unit - Moved in 1970 to 1979 (%) - American Indian and Alaska Native
Year householder moved into unit - Moved in 1970 to 1979 (%) - Multirace
Year householder moved into unit - Moved in 1970 to 1979 (%) - Other Race
Year householder moved into unit - Moved in 1969 or earlier (%)
Year householder moved into unit - Moved in 1969 or earlier (%) - White
Year householder moved into unit - Moved in 1969 or earlier (%) - Black or African American
Year householder moved into unit - Moved in 1969 or earlier (%) - Asian
Year householder moved into unit - Moved in 1969 or earlier (%) - Hispanic or Latino
Year householder moved into unit - Moved in 1969 or earlier (%) - American Indian and Alaska Native
Year householder moved into unit - Moved in 1969 or earlier (%) - Multirace
Year householder moved into unit - Moved in 1969 or earlier (%) - Other Race
Housing units lacking complete plumbing facilities (%)
Housing units lacking complete kitchen facilities (%)
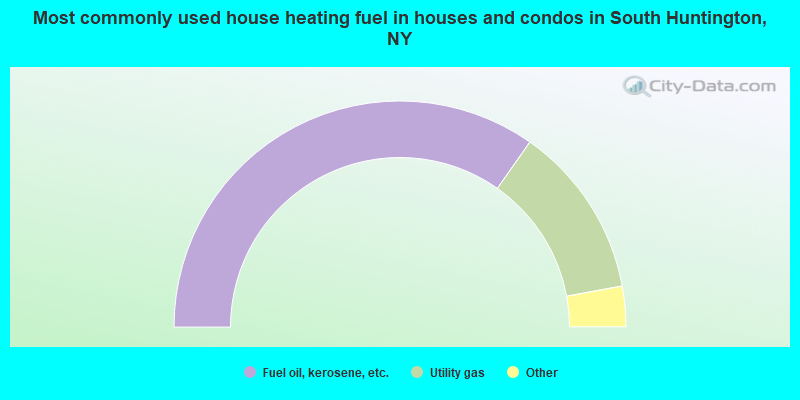
House heating fuel used in houses and condos - Utility gas (%)
House heating fuel used in houses and condos - Bottled, tank, or LP gas (%)
House heating fuel used in houses and condos - Electricity (%)
House heating fuel used in houses and condos - Fuel oil, kerosene, etc. (%)
House heating fuel used in houses and condos - Coal or coke (%)
House heating fuel used in houses and condos - Wood (%)
House heating fuel used in houses and condos - Solar energy (%)
House heating fuel used in houses and condos - Other fuel (%)
House heating fuel used in houses and condos - No fuel used (%)
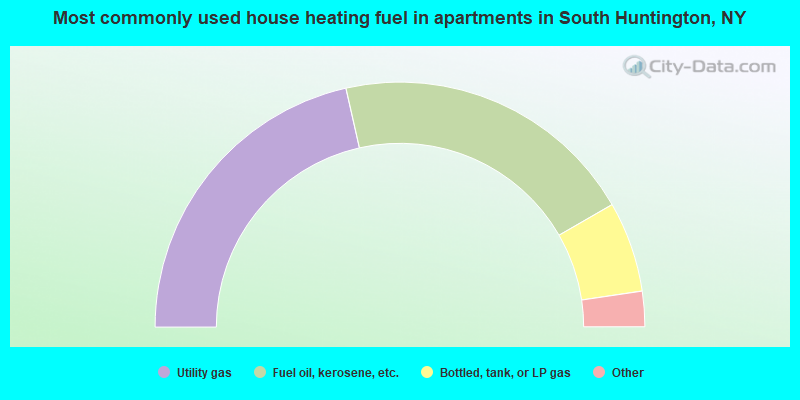
House heating fuel used in apartments - Utility gas (%)
House heating fuel used in apartments - Bottled, tank, or LP gas (%)
House heating fuel used in apartments - Electricity (%)
House heating fuel used in apartments - Fuel oil, kerosene, etc. (%)
House heating fuel used in apartments - Coal or coke (%)
House heating fuel used in apartments - Wood (%)
House heating fuel used in apartments - Solar energy (%)
House heating fuel used in apartments - Other fuel (%)
House heating fuel used in apartments - No fuel used (%)
Median year house/condo built: 1958Median year apartment built: 1963Household type by relationship:
Households: 10,313
Male householders: 1,568 (178 living alone ), Female householders: 1,888 (381 living alone )2,010 spouses (2,010 opposite-sex spouses ), 242 unmarried partners , (213 opposite-sex unmarried partners ), 3,276 children (3,212 natural , 43 adopted , 21 stepchildren ), 126 grandchildren , 72 brothers or sisters , 200 parents , 0 foster children , 201 other relatives , 510 non-relatives In group quarters: 219
Size of family households: 960 2-persons , 712 3-persons , 578 4-persons , 167 5-persons , 152 6-persons , 48 7-or-more-persons .
Size of nonfamily households: 563 1-person , 193 2-persons , 46 3-persons , 40 4-persons .
1,425 married couples with children. single-parent households (175 men , 245 women ).
77.2% of residents of South Huntington speak English at home. of residents speak Spanish at home (71% speak English very well , 8% speak English well , 14% speak English not well , 7% don't speak English at all ).of residents speak other Indo-European language at home (85% speak English very well , 12% speak English well , 3% speak English not well , 1% don't speak English at all ).of residents speak Asian or Pacific Island language at home (72% speak English very well , 21% speak English well , 7% speak English not well ).
Foreign born population: 1,580 (15.3%)of them are naturalized citizens )
Median number of rooms in houses and condos:
Median number of rooms in apartments
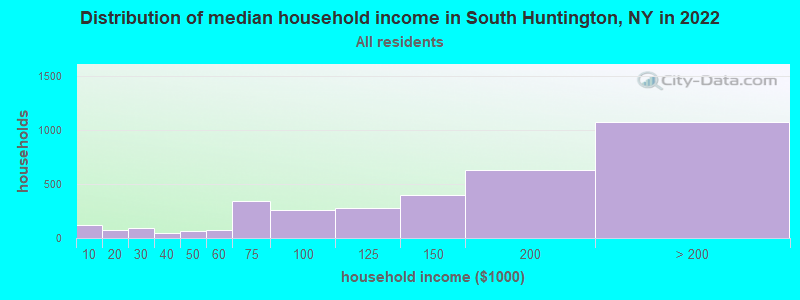
South Huntington, NY household income distribution 117 Less than $10,00078 $10,000 to $19,99990 $20,000 to $29,99943 $30,000 to $39,99964 $40,000 to $49,99970 $50,000 to $59,999341 $60,000 to $74,999256 $75,000 to $99,999278 $100,000 to $124,999398 $125,000 to $149,999627 $150,000 to $199,9991,075 $200,000 or more
Home value of owner - occupied houses in 2022 in South Huntington, NY 106 Less than $10,00010 $90,000 to $99,99917 $250,000 to $299,999201 $300,000 to $399,999666 $400,000 to $499,9991,561 $500,000 to $749,999557 $750,000 to $999,999131 $1,000,000 to $1,499,99929 $2,000,000 or moreRent paid by renters in 2022 in South Huntington, NY 29 $900 to $99999 $1,000 to $1,24911 $1,250 to $1,49990 $1,500 to $1,999132 $2,000 to $2,4999 $3,000 to $3,4998 $3,500 or more14 No cash rent
Percentage of workers working in this county: 63.1%Number of people working at home: 921 (16.5% of all workers )
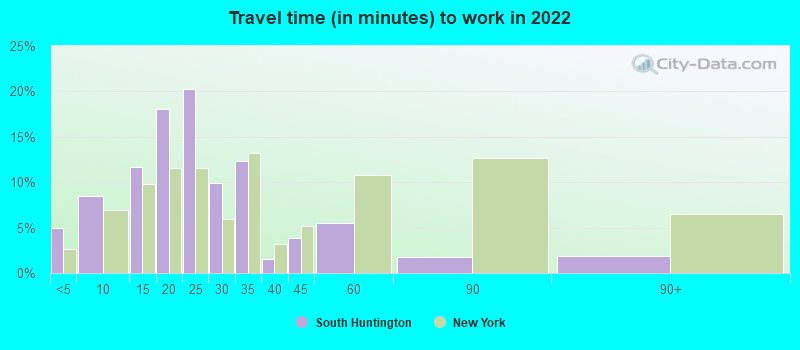
Travel time to work (commute)
Less than 5 minutes: 1615 to 9 minutes: 31610 to 14 minutes: 43215 to 19 minutes: 98720 to 24 minutes: 36325 to 29 minutes: 24430 to 34 minutes: 55635 to 39 minutes: 17840 to 44 minutes: 42245 to 59 minutes: 31960 to 89 minutes: 38590 or more minutes: 371
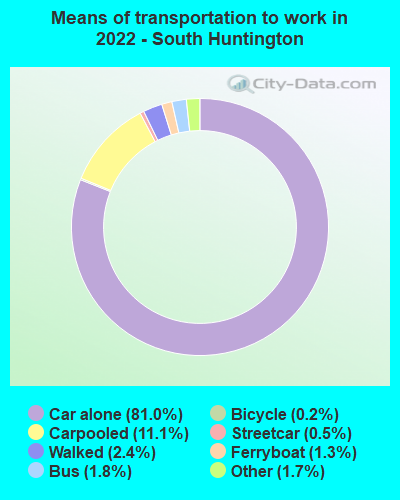
Means of transportation to work:
Drove a car alone: 4,185 (67.9%)Carpooled: 658 (10.7%)Bus : 83 (1.3%)Subway or elevated rail : 28 (0.5%)Ferryboat: 36 (0.6%)Taxi: 108 (1.8%)Bicycle: 7 (0.1%)Walked: 130 (2.1%)Worked at home: 921 (14.9%)
Unemployment by race in 2022
Unemployment rate for White non-Hispanic residents 0.4% Males11.7% FemalesUnemployment rate for Black residents 15.3% MalesUnemployment rate for Asian residents 11.3% Males4.8% FemalesUnemployment rate for two or more race residents 6.1% MalesUnemployment rate for Hispanic or Latino residents 2.8% Males7.6% Females
Year of entry for the foreign-born population in South Huntington, New York
165 2010 or later 402 2000 to 2009 354 1990 to 1999 178 1980 to 1989 193 1970 to 1979 340 Before 1970
First ancestries reported:
Italian: 892 (19.8%)
American: 466 (10.3%)
Irish: 324 (7.2%)
German: 236 (5.2%)
Polish: 127 (2.8%)
Russian: 123 (2.7%)
Turkish: 94 (2.1%)
European: 55 (1.2%)
English: 54 (1.2%)
Hungarian: 50 (1.1%)
Egyptian: 43 (1.0%)
Eastern European: 36 (0.8%)
Greek: 36 (0.8%)
Dutch: 29 (0.6%)
Nigerian: 21 (0.5%)
Belgian: 17 (0.4%)
French: 17 (0.4%)
Jamaican: 17 (0.4%)
Austrian: 10 (0.2%)
Brazilian: 9 (0.2%)
Basque: 7 (0.2%)
South African: 7 (0.2%)
British: 5 (0.1%)
Estonian: 5 (0.1%) Most common places of birth for foreign-born residents (%): India South Huntington:
11.3% (165)New York:
3.5% (158,432)
Colombia South Huntington:
10.4% (151)New York:
2.5% (111,920)
Ecuador South Huntington:
9.9% (144)New York:
3.9% (177,448)
Bangladesh South Huntington:
8.7% (127)New York:
2.6% (117,288)
Honduras South Huntington:
7.2% (105)New York:
1.2% (55,571)
Turkey South Huntington:
6.7% (97)New York:
0.5% (21,009)
Philippines South Huntington:
4.7% (68)New York:
2.0% (91,070)
United Arab Emirates South Huntington:
2.9% (42)New York:
0.1% (2,409)
Poland South Huntington:
2.7% (40)New York:
1.4% (65,102)
Germany South Huntington:
2.3% (34)New York:
0.9% (38,713)
Jamaica South Huntington:
1.9% (27)New York:
5.0% (227,557)
Japan South Huntington:
1.8% (26)New York:
0.6% (28,472)
Switzerland South Huntington:
1.7% (25)New York:
0.1% (4,429)
Hong Kong South Huntington:
1.7% (25)New York:
0.9% (42,220)
Laos South Huntington:
1.6% (23)New York:
0.0% (2,177)
Italy South Huntington:
1.6% (23)New York:
1.8% (81,374)
Argentina South Huntington:
1.5% (22)New York:
0.5% (21,928)
Place of birth for U.S.-born residents:
This state: 7,893Other state: 602Northeast: 305Midwest: 77South: 124West: 91 91.6% of South Huntington residents lived in the same house 1 years ago.
Out of people who lived in different houses, 33.1% lived in this county.
Out of people who lived in different counties, 95.4% lived in New York.
South Huntington:
91.6%State average:
89.6%
Education attainment for males 25 years and older:
No schooling: 23Nursery to 4th grade: 05th and 6th grade: 697th and 8th grade: 139th grade: 310th grade: 011th grade: 1012th grade, no diploma: 24High school graduate (or equivalency): 591Less than 1 year of college: 216Some college more than 1 year, no degree: 351Associate degree: 296Bachelor's degree: 1,289Master's degree: 562Professional school degree: 193Doctorate degree: 31
Education attainment for females 25 years and older:
No schooling: 37Nursery to 4th grade: 205th and 6th grade: 37th and 8th grade: 169th grade: 410th grade: 011th grade: 612th grade, no diploma: 45High school graduate (or equivalency): 580Less than 1 year of college: 106Some college more than 1 year, no degree: 381Associate degree: 346Bachelor's degree: 1,073Master's degree: 789Professional school degree: 107Doctorate degree: 109
Housing units in structures:
One, detached: 3,212One, attached: 132Two: 11910 to 19: 1250 or more: 61Housing units lacking complete plumbing facilities in 2022: 0.6%Housing units lacking complete kitchen facilities in 2022: 1.6%House/condo owner moved in on average 14 years ago
Renter moved in on average 4 years ago
Private vs. public school enrollment:
Students in private schools in grades 1 to 8 (elementary and middle school): 88 Students in private schools in grades 9 to 12 (high school): 115 Students in private undergraduate colleges: 177