Snohomish, WA (Washington) Houses and Residents
| Snohomish: | $636,923 |
| Washington: | $569,500 |
Mean price in 2022:
Detached houses: $748,947
Here: $748,947 State: $734,307 Townhouses or other attached units: $462,733
Here: $462,733 State: $657,697 In 3-to-4-unit structures: $1,382,299
Here: $1,382,299 State: $510,239 In 5-or-more-unit structures: $374,435
Here: $374,435 State: $503,183 Mobile homes: $113,948
Here: $113,948 State: $218,362
Total population: 9,544 (Urban population: 8,454, Rural population: 0)
Houses: 4,746 (4,468 occupied: 2,547 owner occupied, 1,884 renter occupied)
| % of renters here: | 43% |
| State: | 36% |
Housing density: 1,882 houses/condos per square mile
Median price asked for vacant for-sale houses and condos in 2022: $829,233.
Median contract rent in 2022: $1,273
Median rent asked for vacant for-rent units in 2022: $842
Median gross rent in Snohomish, WA in 2022: $1,306
Housing units in Snohomish with a mortgage: 1,720 (186 second mortgage, 0 home equity loan, 174 both second mortgage and home equity loan)
Houses without a mortgage: 0
Median household income for houses/condos with a mortgage: $122,499
Median household income for apartments without a mortgage: $67,887
Median monthly housing costs: $1,471
Compare current foreclosures in Snohomish, WA:
| Photo | Address | Area | Beds / Baths | Price | Details |
|---|---|---|---|---|---|

|
#1
210th St SE
Snohomish, WA 98296
|
1,580 sq. feet
|
3 baths 3 beds |
show details | |

|
#2
Interurban Blvd
Snohomish, WA 98296
|
1,156 sq. feet
|
1 baths 3 beds |
show details | |

|
#3
N Ridge Dr
Snohomish, WA 98290
|
2,033 sq. feet
|
3 baths 3 beds |
show details | |

|
#4
Storm Lake Rd
Snohomish, WA 98290
|
2,323 sq. feet
|
3 baths 3 beds |
show details | |

|
#5
Carlson Rd
Snohomish, WA 98290
|
2,432 sq. feet
|
2 baths 4 beds |
show details | |

|
#6
59th Ave SE
Snohomish, WA 98296
|
2,641 sq. feet
|
2 baths 5 beds |
show details | |

|
#7
Northridge Dr
Snohomish, WA 98290
|
2,033 sq. feet
|
3 baths 3 beds |
show details | |

|
#8
Lost Lake Rd
Snohomish, WA 98296
|
2,782 sq. feet
|
2 baths 5 beds |
show details | |

|
#9
E Lowell Larimer Rd
Snohomish, WA 98296
|
1,556 sq. feet
|
1 baths 3 beds |
show details | |

|
#10
153rd Ave SE
Snohomish, WA 98290
|
1,196 sq. feet
|
1 baths 2 beds |
show details |
| Photo | Address | Area | Beds / Baths | Price | Details |
|---|---|---|---|---|---|

|
#11
23rd St
Snohomish, WA 98290
|
2,265 sq. feet
|
2 baths 3 beds |
show details | |

|
#12
207th St SE
Snohomish, WA 98296
|
1,822 sq. feet
|
2 baths 3 beds |
show details | |

|
#13
48th St NE
Snohomish, WA 98290
|
1,404 sq. feet
|
2 baths - beds |
show details | |

|
#14
71st Pl SE
Snohomish, WA 98290
|
1,464 sq. feet
|
1 baths 3 beds |
show details | |

|
#15
67th Ave SE
Snohomish, WA 98290
|
1,032 sq. feet
|
1 baths 2 beds |
show details | |

|
#16
132nd Ave SE
Snohomish, WA 98290
|
2,615 sq. feet
|
2 baths 3 beds |
show details | |

|
#17
71st Pl SE
Snohomish, WA 98290
|
1,344 sq. feet
|
1 baths 3 beds |
show details | |

|
#18
Mcallister Rd
Snohomish, WA 98290
|
2,624 sq. feet
|
3 baths 4 beds |
show details | |

|
#19
3rd St
Snohomish, WA 98290
|
1,880 sq. feet
|
2 baths 4 beds |
show details | |

|
#20
Ingraham Rd
Snohomish, WA 98290
|
1,312 sq. feet
|
1 baths 3 beds |
show details |
| Photo | Address | Area | Beds / Baths | Price | Details |
|---|---|---|---|---|---|

|
#21
Pine Ave
Snohomish, WA 98290
|
1,332 sq. feet
|
1 baths 2 beds |
show details | |

|
#22
Maple Ave
Snohomish, WA 98290
|
1,612 sq. feet
|
1 baths 3 beds |
show details | |

|
#23
153rd Ave SE
Snohomish, WA 98296
|
2,112 sq. feet
|
2 baths 3 beds |
show details | |

|
#24
State St
Snohomish, WA 98296
|
1,348 sq. feet
|
2 baths 2 beds |
show details | |

|
#25
Pilchuck Tree Farm Rd
Snohomish, WA 98290
|
2,837 sq. feet
|
2 baths 4 beds |
show details | |

|
#26
219th Ave SE
Snohomish, WA 98290
|
3,531 sq. feet
|
3 baths 4 beds |
show details | |

|
#27
Welch Rd
Snohomish, WA 98296
|
3,228 sq. feet
|
2 baths 4 beds |
show details | |

|
#28
67th Ave SE
Snohomish, WA 98296
|
2,146 sq. feet
|
3 baths 3 beds |
show details | |

|
#29
Root Ave
Snohomish, WA 98290
|
984 sq. feet
|
1 baths 3 beds |
show details | |

|
#30
Welch Rd
Snohomish, WA 98296
|
3,228 sq. feet
|
2 baths 4 beds |
show details |
| Photo | Address | Area | Beds / Baths | Price | Details |
|---|---|---|---|---|---|

|
#31
68th Ave SE
Snohomish, WA 98296
|
3,307 sq. feet
|
3 baths 4 beds |
show details | |

|
#32
Orchard Ave
Snohomish, WA 98290
|
1,074 sq. feet
|
2 baths 3 beds |
show details | |

|
#33
Weber Rd
Snohomish, WA 98290
|
768 sq. feet
|
1 baths 2 beds |
show details | |

|
#34
15th St
Snohomish, WA 98290
|
1,630 sq. feet
|
1 baths 3 beds |
show details | |

|
#35
178th Dr SE
Snohomish, WA 98290
|
1,625 sq. feet
|
2 baths 3 beds |
show details | |

|
#36
63rd Dr SE
Snohomish, WA 98296
|
2,154 sq. feet
|
2 baths 3 beds |
show details | |

|
#37
3 Lakes Rd
Snohomish, WA 98290
|
1,740 sq. feet
|
1 baths 2 beds |
show details | |

|
#38
148th Ave SE
Snohomish, WA 98296
|
4,320 sq. feet
|
4 baths 4 beds |
show details | |

|
#39
195th Ave SE
Snohomish, WA 98290
|
4,836 sq. feet
|
3 baths 3 beds |
show details | |

|
#40
96th Dr SE
Snohomish, WA 98290
|
1,932 sq. feet
|
2 baths 4 beds |
show details |
| Photo | Address | Area | Beds / Baths | Price | Details |
|---|---|---|---|---|---|

|
#41
N Machias Rd
Snohomish, WA 98290
|
600 sq. feet
|
1 baths - beds |
show details | |

|
#42
144th Dr SE
Snohomish, WA 98290
|
1,440 sq. feet
|
2 baths - beds |
show details | |

|
#43
218th Pl SE
Snohomish, WA 98296
|
1,762 sq. feet
|
- baths - beds |
show details | |

|
#44
Avenue D
Snohomish, WA 98290
|
- sq. feet
|
- baths - beds |
show details | |

|
#45
Northridge Dr
Snohomish, WA 98290
|
- sq. feet
|
- baths - beds |
show details | |

|
#46
55th Dr SE
Snohomish, WA 98296
|
- sq. feet
|
- baths - beds |
show details | |

|
#47
77th Ave SE
Snohomish, WA 98296
|
- sq. feet
|
- baths - beds |
show details | |

|
#48
62nd St SE
Snohomish, WA 98290
|
- sq. feet
|
- baths - beds |
show details | |

|
#49
7th St Apt B
Snohomish, WA 98290
|
- sq. feet
|
- baths - beds |
show details | |

|
Check over 1 million property listings on Foreclosure.com!
|
browse all offers | |||

Latest news about housing in Snohomish, WA collected exclusively by city-data.com from local newspapers, TV, and radio stations


Median year apartment built: 1977
Household type by relationship:
Households: 10,276- Male householders: 1,777 (545 living alone), Female householders: 2,613 (857 living alone)
1,800 spouses (1,767 opposite-sex spouses), 241 unmarried partners, (241 opposite-sex unmarried partners), 2,512 children (2,445 natural, 29 adopted, 37 stepchildren), 367 grandchildren, 34 brothers or sisters, 145 parents, 0 foster children, 98 other relatives, 363 non-relatives
- In group quarters: 323
Size of family households: 1,313 2-persons, 530 3-persons, 624 4-persons, 165 5-persons, 19 6-persons, 19 7-or-more-persons.
Size of nonfamily households: 1,495 1-person, 277 2-persons, 7 3-persons.
1,134 married couples with children.
448 single-parent households (132 men, 316 women).
94.0% of residents of Snohomish speak English at home.
1.7% of residents speak Spanish at home (84% speak English very well, 7% speak English not well, 9% don't speak English at all).
1.2% of residents speak other Indo-European language at home (70% speak English very well, 25% speak English well, 4% speak English not well).
3.8% of residents speak Asian or Pacific Island language at home (51% speak English very well, 18% speak English well, 22% speak English not well, 9% don't speak English at all).
0.1% of residents speak other language at home (100% speak English very well).
Foreign born population: 485 (4.7%)
(60.6% of them are naturalized citizens)
| Here: | 6.0 |
| State: | 6.5 |
| Here: | 3.9 |
| State: | 3.9 |

- Bedrooms in owner-occupied houses and condos in Snohomish, Washington
- 0no bedroom
- 241 bedroom
- 6582 bedrooms
- 1,2473 bedrooms
- 4754 bedrooms
- 1445+ bedrooms

- Bedrooms in renter-occupied apartments in Snohomish, Washington
- 171no bedroom
- 5051 bedroom
- 7362 bedrooms
- 3803 bedrooms
- 764 bedrooms
- 175+ bedrooms

- Cars and other vehicles available in Snohomish in owner-occupied houses/condos
- 21no vehicle
- 8821 vehicle
- 9922 vehicles
- 3723 vehicles
- 1784 vehicles
- 1025+ vehicles

- Cars and other vehicles available in Snohomish in renter-occupied apartments
- 156no vehicle
- 1,0281 vehicle
- 4122 vehicles
- 2193 vehicles
- 264 vehicles
- 445+ vehicles

- Rooms in owner-occupied houses in Snohomish, Washington
- 01 room
- 02 rooms
- 503 rooms
- 4274 rooms
- 4785 rooms
- 6116 rooms
- 2617 rooms
- 3158 rooms
- 4059+ rooms

- Rooms in renter-occupied apartments in Snohomish, Washington
- 1711 room
- 1002 rooms
- 3883 rooms
- 5634 rooms
- 2675 rooms
- 2376 rooms
- 797 rooms
- 438 rooms
- 369+ rooms


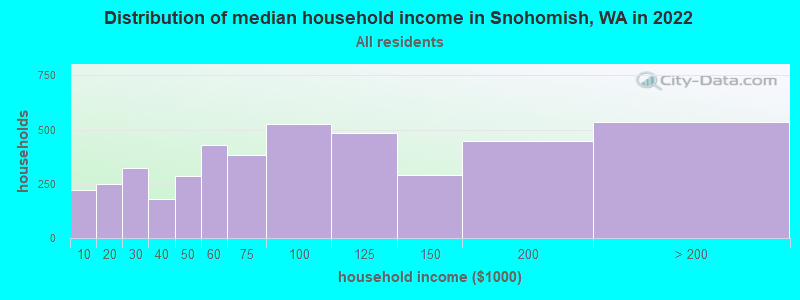
Snohomish, WA household income distribution

- 223Less than $10,000
- 249$10,000 to $19,999
- 321$20,000 to $29,999
- 181$30,000 to $39,999
- 287$40,000 to $49,999
- 427$50,000 to $59,999
- 385$60,000 to $74,999
- 528$75,000 to $99,999
- 486$100,000 to $124,999
- 289$125,000 to $149,999
- 449$150,000 to $199,999
- 535$200,000 or more
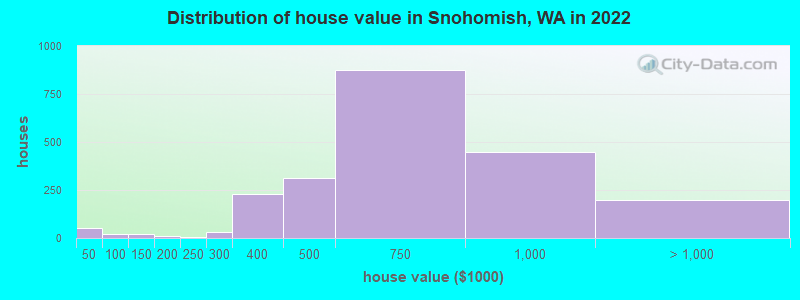
Home value of owner - occupied houses in 2022 in Snohomish, WA
-
- 36Less than $10,000
- 5$30,000 to $34,999
- 11$40,000 to $49,999
- 8$50,000 to $59,999
- 18$100,000 to $124,999
- 9$150,000 to $174,999
- 6$200,000 to $249,999
- 30$250,000 to $299,999
- 228$300,000 to $399,999
- 311$400,000 to $499,999
- 877$500,000 to $749,999
- 446$750,000 to $999,999
- 143$1,000,000 to $1,499,999
- 54$2,000,000 or more
Rent paid by renters in 2022 in Snohomish, WA
-
- 5$150 to $199
- 11$250 to $299
- 31$300 to $349
- 23$350 to $399
- 16$400 to $449
- 122$450 to $499
- 92$500 to $549
- 10$650 to $699
- 10$700 to $749
- 10$750 to $799
- 39$800 to $899
- 92$900 to $999
- 192$1,000 to $1,249
- 257$1,250 to $1,499
- 459$1,500 to $1,999
- 114$2,000 to $2,499
- 114$2,500 to $2,999
- 10$3,000 to $3,499
- 9$3,500 or more
- 40No cash rent


Percentage of workers working in this county: 77.3%
Number of people working at home: 717 (15.3% of all workers)
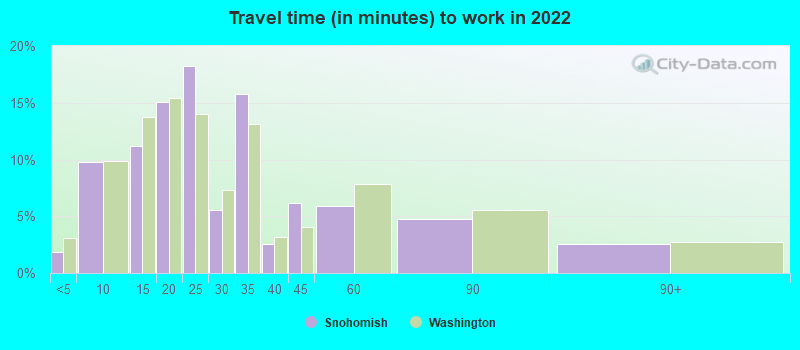
Travel time to work (commute)
- Less than 5 minutes: 137
- 5 to 9 minutes: 250
- 10 to 14 minutes: 261
- 15 to 19 minutes: 433
- 20 to 24 minutes: 588
- 25 to 29 minutes: 320
- 30 to 34 minutes: 523
- 35 to 39 minutes: 173
- 40 to 44 minutes: 249
- 45 to 59 minutes: 412
- 60 to 89 minutes: 361
- 90 or more minutes: 142
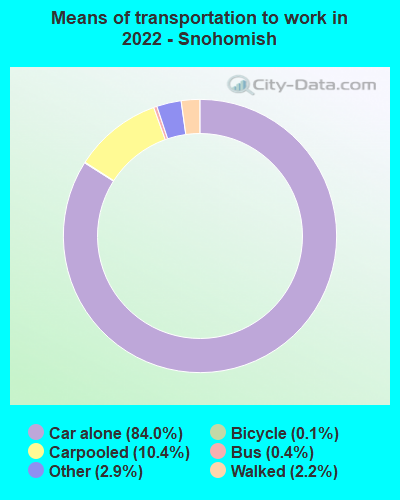
Means of transportation to work:
- Drove a car alone: 5,933 (70.5%)
- Carpooled: 784 (9.3%)
- Bus: 39 (0.5%)
- Taxi: 235 (2.8%)
- Bicycle: 6 (0.1%)
- Walked: 184 (2.2%)
- Worked at home: 717 (8.5%)

- Unemployment by race in 2022
- Unemployment rate for White non-Hispanic residents
- 4.8%Males
- 7.5%Females
- Unemployment rate for Asian residents
- 5.4%Females
- Unemployment rate for two or more race residents
- 2.2%Males
- 18.1%Females

- Year of entry for the foreign-born population in Snohomish, Washington
- 1672010 or later
- 782000 to 2009
- 1151990 to 1999
- 931980 to 1989
- 231970 to 1979
- 110Before 1970

First ancestries reported:
- English: 597 (15.4%)
- German: 471 (12.2%)
- American: 336 (8.7%)
- Irish: 277 (7.2%)
- European: 209 (5.4%)
- Norwegian: 160 (4.1%)
- Dutch: 150 (3.9%)
- French: 118 (3.0%)
- Swedish: 72 (1.9%)
- Scotch-Irish: 70 (1.8%)
- Italian: 58 (1.5%)
- British: 35 (0.9%)
- Danish: 33 (0.9%)
- Basque: 27 (0.7%)
- Scandinavian: 25 (0.6%)
- Scottish: 25 (0.6%)
- Northern European: 20 (0.5%)
- French Canadian: 15 (0.4%)
- Canadian: 14 (0.4%)
- Ugandan: 14 (0.4%)
- Belizean: 12 (0.3%)
- Swiss: 7 (0.2%)
- Czechoslovakian: 6 (0.2%)
- Eastern European: 5 (0.1%)
- Greek: 5 (0.1%)
- Russian: 5 (0.1%)
- Australian: 4 (0.1%)
Most common places of birth for foreign-born residents (%):
| Snohomish: | 14.9% (72) |
| Washington: | 7.4% (84,470) |
| Snohomish: | 12.7% (61) |
| Washington: | 21.1% (241,655) |
| Snohomish: | 9.5% (46) |
| Washington: | 0.9% (9,937) |
| Snohomish: | 8.7% (42) |
| Washington: | 6.3% (71,661) |
| Snohomish: | 6.8% (33) |
| Washington: | 1.6% (17,761) |
| Snohomish: | 5.6% (27) |
| Washington: | 0.4% (4,144) |
| Snohomish: | 4.8% (23) |
| Washington: | 0.8% (9,457) |
| Snohomish: | 3.9% (19) |
| Washington: | 0.5% (5,926) |
| Snohomish: | 3.9% (19) |
| Washington: | 4.1% (47,238) |
| Snohomish: | 3.7% (18) |
| Washington: | 0.6% (6,500) |
| Snohomish: | 3.5% (17) |
| Washington: | 1.0% (10,943) |
| Snohomish: | 3.3% (16) |
| Washington: | 0.1% (1,182) |
| Snohomish: | 3.1% (15) |
| Washington: | 0.1% (1,259) |
| Snohomish: | 2.7% (13) |
| Washington: | 5.4% (62,003) |
| Snohomish: | 2.7% (13) |
| Washington: | 0.2% (1,754) |
| Snohomish: | 2.5% (12) |
| Washington: | 1.5% (17,453) |
| Snohomish: | 2.5% (12) |
| Washington: | 4.3% (48,886) |
| Snohomish: | 2.5% (12) |
| Washington: | 0.0% (502) |
| Snohomish: | 2.1% (10) |
| Washington: | 0.4% (4,951) |
Place of birth for U.S.-born residents:
- This state: 6,157
- Other state: 3,455
- Northeast: 372
- Midwest: 656
- South: 697
- West: 1,708
88.9% of Snohomish residents lived in the same house 1 years ago.
Out of people who lived in different houses, 41.6% lived in this county.
Out of people who lived in different counties, 73.8% lived in Washington.
| Snohomish: | 88.9% |
| State average: | 85.2% |
Education attainment for males 25 years and older:
- No schooling: 75
- Nursery to 4th grade: 6
- 5th and 6th grade: 0
- 7th and 8th grade: 24
- 9th grade: 121
- 10th grade: 33
- 11th grade: 104
- 12th grade, no diploma: 81
- High school graduate (or equivalency): 818
- Less than 1 year of college: 249
- Some college more than 1 year, no degree: 610
- Associate degree: 418
- Bachelor's degree: 567
- Master's degree: 252
- Professional school degree: 159
- Doctorate degree: 20

Education attainment for females 25 years and older:
- No schooling: 15
- Nursery to 4th grade: 0
- 5th and 6th grade: 18
- 7th and 8th grade: 0
- 9th grade: 38
- 10th grade: 90
- 11th grade: 33
- 12th grade, no diploma: 63
- High school graduate (or equivalency): 868
- Less than 1 year of college: 400
- Some college more than 1 year, no degree: 567
- Associate degree: 461
- Bachelor's degree: 1,189
- Master's degree: 264
- Professional school degree: 18
- Doctorate degree: 20


Housing units in structures:
- One, detached: 2,996
- One, attached: 177
- Two: 79
- 3 or 4: 460
- 5 to 9: 324
- 10 to 19: 375
- 20 to 49: 165
- 50 or more: 50
- Mobile homes: 117
Median worth of mobile homes: $11,878
Housing units lacking complete kitchen facilities in 2022: 0.5%
House/condo owner moved in on average 8 years ago
Renter moved in on average 6 years ago

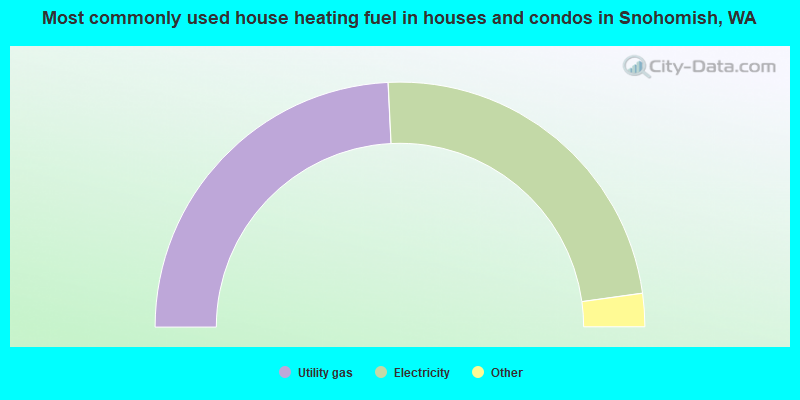
- 48.5%Utility gas
- 47.2%Electricity
- 1.3%Wood
- 1.3%Fuel oil, kerosene, etc.
- 1.0%Bottled, tank, or LP gas
- 0.7%Solar energy
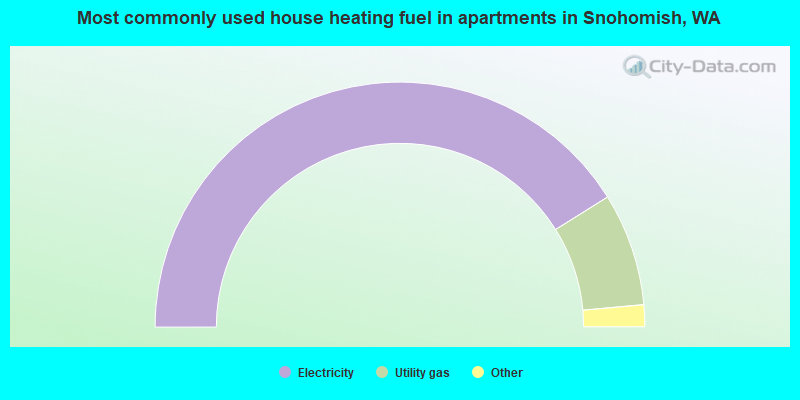
- 82.2%Electricity
- 14.9%Utility gas
- 1.5%No fuel used
- 1.0%Bottled, tank, or LP gas
- 0.4%Coal or coke
Private vs. public school enrollment:
| Here: | 31.5% |
| Washington: | 12.4% |
| Here: | 4.8% |
| Washington: | 9.2% |
| Here: | 12.7% |
| Washington: | 16.5% |


