Silverdale, WA (Washington) Houses and Residents
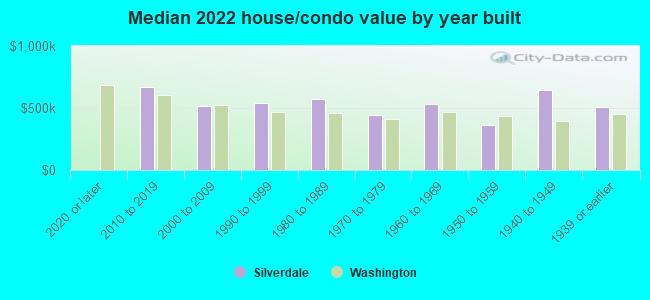
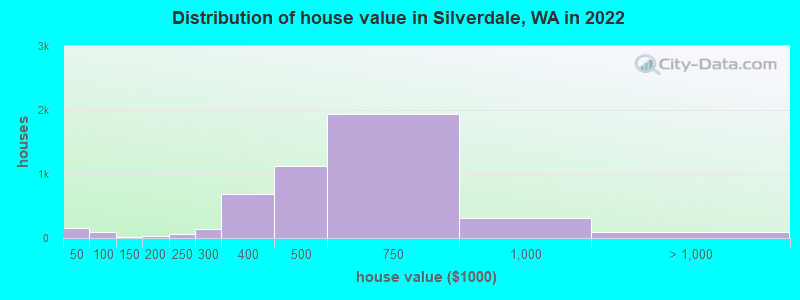
Estimated median house or condo value in 2022: $533,516 (it was $150,400 in 2000 )
Silverdale:
$533,516Washington:
$569,500
Lower value quartile - upper value quartile: $423,245 - $666,700Total population: 19,204 (Urban population: 15,768, Rural population: 0)
Houses: 9,184 (8,694 occupied: 4,570 owner occupied, 4,151 renter occupied )
% of renters here:
48%State:
36%
Housing density: 1,323 houses/condos per square mile
Median price asked for vacant for-sale houses and condos in 2022: $489,997.
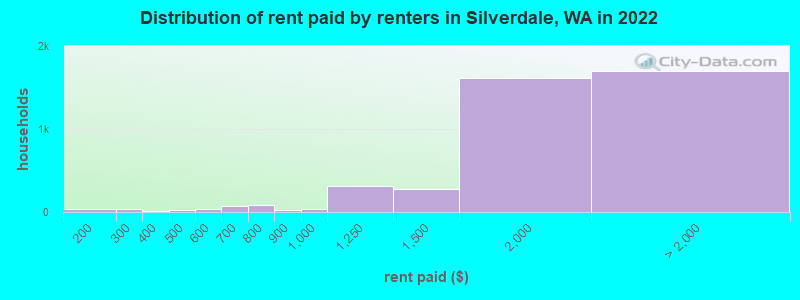
Median contract rent in 2022: $1,886 (lower quartile is $1,566, upper quartile is over $2,000)
Median rent asked for vacant for-rent units in 2022: $1,500
Median gross rent in Silverdale, WA in 2022: over $2,000
Housing units in Silverdale with a mortgage: 3,148 (231 second mortgage, 0 home equity loan, 158 both second mortgage and home equity loan )Houses without a mortgage: 109
Median household income for houses/condos with a mortgage: $128,659
Median household income for apartments without a mortgage: $116,333
Median monthly housing costs: $1,867
Data:
Median house or condo value ($)
Median house or condo value ($ change since 2000)
Median house or condo value ($) - White
Median house or condo value ($) - Black or African American
Median house or condo value ($) - Asian
Median house or condo value ($) - Hispanic or Latino
Median house or condo value ($) - American Indian and Alaska Native
Median house or condo value ($) - Multirace
Median house or condo value ($) - Other Race
Median price asked for mobile homes ($)
Household density (households per square mile)
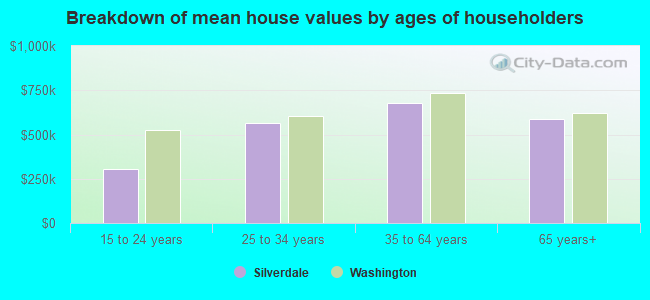
Mean house or condo value by units in structure - 1, detached ($)
Mean house or condo value by units in structure - 1, attached ($)
Mean house or condo value by units in structure - 2 ($)
Mean house or condo value by units in structure by units in structure - 3 or 4 ($)
Mean house or condo value by units in structure - 5 or more ($)
Mean house or condo value by units in structure - Boat, RV, van, etc. ($)
Mean house or condo value by units in structure - Mobile home ($)
Median contract rent ($)
Median contract rent - Lower quartile ($)
Median contract rent - Upper quartile ($)
Median gross rent ($)
Urban houses (%)
Rural houses (%)
Houses occupied (%)
Houses occupied (% change since 2000)
Houses owner occupied (%)
Houses owner occupied (% change since 2000)
Houses renter occupied (%)
Houses renter occupied (% change since 2000)
Vacant housing units - For rent (%)
Vacant housing units - For rent (% change since 2000)
Vacant housing units - For sale only (%)
Vacant housing units - For sale only (% change since 2000)
Vacant housing units - Rented or sold, not occupied (%)
Vacant housing units - Rented or sold, not occupied (% change since 2000)
Vacant housing units - For seasonal, recreational, or occasional use (%)
Vacant housing units - For seasonal, recreational, or occasional use (% change since 2000)
Vacant housing units - For migrant workers (%)
Vacant housing units - For migrant workers (% change since 2000)
Vacant housing units - Other vacant (%)
Vacant housing units - Other vacant (% change since 2000)
Median monthly housing costs ($)
Median household income for houses/condos with a mortgage ($)
Median household income for houses/condos without a mortgage ($)
Median household income ($)
Median household income ($) - White
Median household income ($) - Black or African American
Median household income ($) - Asian
Median household income ($) - Hispanic or Latino
Median household income ($) - American Indian and Alaska Native
Median household income ($) - Multirace
Median household income ($) - Other Race
Mortgage status - with mortgage (%)
Mortgage status - with second mortgage (%)
Mortgage status - with home equity loan (%)
Mortgage status - with both second mortgage and home equity loan (%)
Mortgage status - without a mortgage (%)
Median year house/condo built
Median year apartment built
Household type by relationship - Male householder living alone (%)
Household type by relationship - Male householder not living alone (%)
Household type by relationship - Female householder living alone (%)
Household type by relationship - Female householder not living alone (%)
Household type by relationship - Opposite-Sex spouse (%)
Household type by relationship - Same-Sex spouse (%)
Household type by relationship - Opposite-Sex unmarried partner (%)
Household type by relationship - Same-Sex unmarried partner (%)
Household type by relationship - In group quarters (%)
Size of family households - 2-person household (%)
Size of family households - 3-person household (%)
Size of family households - 4-person household (%)
Size of family households - 5-person household (%)
Size of family households - 6-person household (%)
Size of family households - 7-or-more-person household (%)
Size of nonfamily households - 1-person household (%)
Size of nonfamily households - 2-person household (%)
Size of nonfamily households - 3-person household (%)
Size of nonfamily households - 4-person household (%)
Size of nonfamily households - 5-person household (%)
Size of nonfamily households - 6-person household (%)
Size of nonfamily households - 7-or-moreperson household (%)
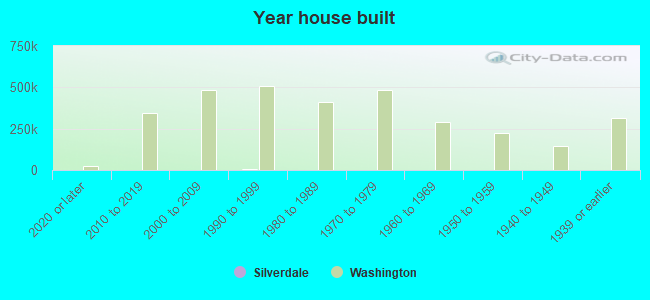
Year house built - Built 2010 or later (%)
Year house built - Built 2000 to 2009 (%)
Year house built - Built 1990 to 1999 (%)
Year house built - Built 1980 to 1989 (%)
Year house built - Built 1970 to 1979 (%)
Year house built - Built 1960 to 1969 (%)
Year house built - Built 1950 to 1959 (%)
Year house built - Built 1940 to 1949 (%)
Year house built - Built 1939 or earlier (%)
Median number of rooms in houses and condos
Median number of rooms in apartments
Median number of bedrooms in owner occupied houses
Mean number of bedrooms in owner occupied houses
Median number of bedrooms in renter occupied houses
Mean number of bedrooms in renter occupied houses
Median number of vehichles in owner occupied houses
Mean number of vehichles in owner occupied houses
Median number of vehichles in renter occupied houses
Mean number of vehichles in renter occupied houses
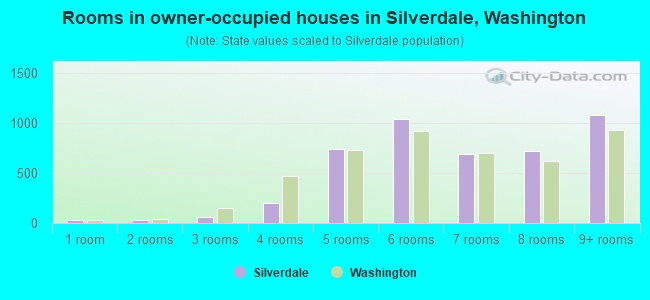
Rooms in owner-occupied houses - 1 room (%)
Rooms in owner-occupied houses - 2 rooms (%)
Rooms in owner-occupied houses - 3 rooms (%)
Rooms in owner-occupied houses - 4 rooms (%)
Rooms in owner-occupied houses - 5 rooms (%)
Rooms in owner-occupied houses - 6 rooms (%)
Rooms in owner-occupied houses - 7 rooms (%)
Rooms in owner-occupied houses - 8 rooms (%)
Rooms in owner-occupied houses - 9+ rooms (%)
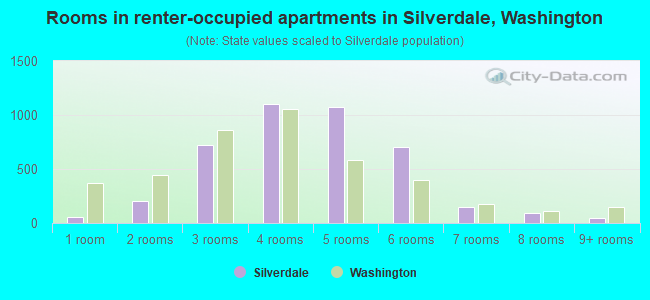
Rooms in renter-occupied houses - 1 room (%)
Rooms in renter-occupied houses - 2 rooms (%)
Rooms in renter-occupied houses - 3 rooms (%)
Rooms in renter-occupied houses - 4 rooms (%)
Rooms in renter-occupied houses - 5 rooms (%)
Rooms in renter-occupied houses - 6 rooms (%)
Rooms in renter-occupied houses - 7 rooms (%)
Rooms in renter-occupied houses - 8 rooms (%)
Rooms in renter-occupied houses - 9+ rooms (%)
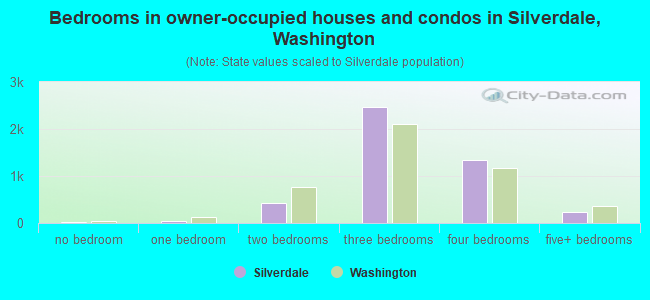
Bedrooms in owner-occupied houses - no bedrooms (%)
Bedrooms in owner-occupied houses - 1 bedroom (%)
Bedrooms in owner-occupied houses - 2 bedrooms (%)
Bedrooms in owner-occupied houses - 3 bedrooms (%)
Bedrooms in owner-occupied houses - 4 bedrooms (%)
Bedrooms in owner-occupied houses - 5+ bedrooms (%)
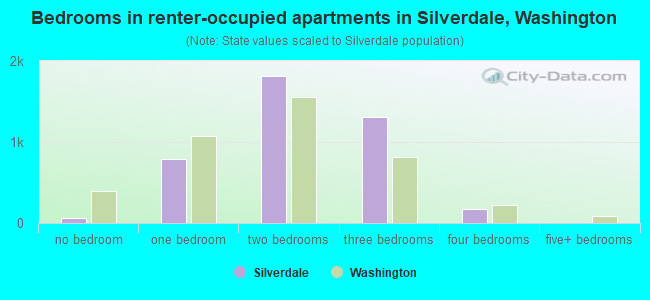
Bedrooms in renter-occupied houses - no bedrooms (%)
Bedrooms in renter-occupied houses - 1 bedroom (%)
Bedrooms in renter-occupied houses - 2 bedrooms (%)
Bedrooms in renter-occupied houses - 3 bedrooms (%)
Bedrooms in renter-occupied houses - 4 bedrooms (%)
Bedrooms in renter-occupied houses - 5+ bedrooms (%)
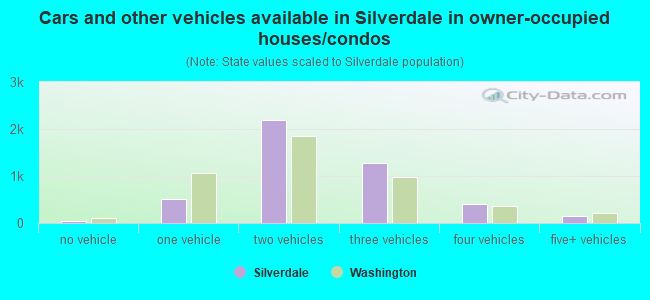
Vehicles available in owner-occupied houses - no vehicle available (%)
Vehicles available in owner-occupied houses - 1 vehicle available(%)
Vehicles available in owner-occupied houses - 2 Vehicles available (%)
Vehicles available in owner-occupied houses - 3 Vehicles available (%)
Vehicles available in owner-occupied houses - 4 Vehicles available (%)
Vehicles available in owner-occupied houses - 5+ Vehicles available (%)
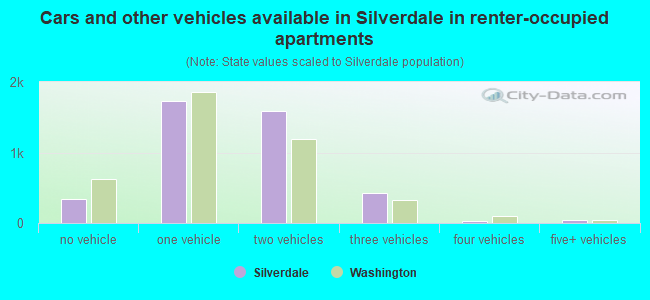
Vehicles available in renter-occupied houses - no vehicle available (%)
Vehicles available in renter-occupied houses - 1 vehicle available (%)
Vehicles available in renter-occupied houses - 2 Vehicles available (%)
Vehicles available in renter-occupied houses - 3 Vehicles available (%)
Vehicles available in renter-occupied houses - 4 Vehicles available (%)
Vehicles available in renter-occupied houses - 5+ Vehicles available (%)
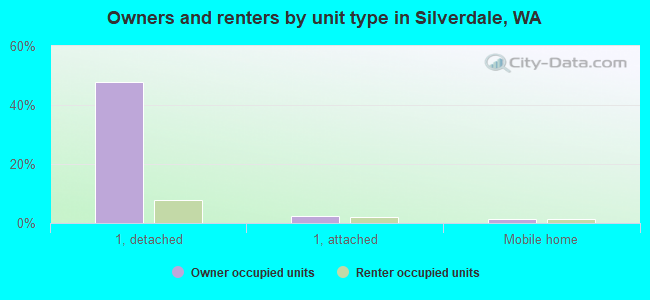
Housing units in structures - 1, detached (%)
Housing units in structures - 1, attached (%)
Housing units in structures - 2 (%)
Housing units in structures - 3 or 4 (%)
Housing units in structures - 5 to 9 (%)
Housing units in structures - 10 to 19 (%)
Housing units in structures - 20 to 49 (%)
Housing units in structures - 50 or more (%)
Housing units in structures - Mobile home (%)
Housing units in structures - Boat, RV, van, etc. (%)
Housing units in structures - Owners - 1, detached (%)
Housing units in structures - Owners - 1, attached (%)
Housing units in structures - Owners - 2 (%)
Housing units in structures - Owners - 3 or 4 (%)
Housing units in structures - Owners - 5 to 9 (%)
Housing units in structures - Owners - 10 to 19 (%)
Housing units in structures - Owners - 20 to 49 (%)
Housing units in structures - Owners - 50 or more (%)
Housing units in structures - Owners - Mobile home (%)
Housing units in structures - Owners - Boat, RV, van, etc. (%)
Housing units in structures - Renters - 1, detached (%)
Housing units in structures - Renters - 1, attached (%)
Housing units in structures - Renters - 2 (%)
Housing units in structures - Renters - 3 or 4 (%)
Housing units in structures - Renters - 5 to 9 (%)
Housing units in structures - Renters - 10 to 19 (%)
Housing units in structures - Renters - 20 to 49 (%)
Housing units in structures - Renters - 50 or more (%)
Housing units in structures - Renters - Mobile home (%)
Housing units in structures - Renters - Boat, RV, van, etc. (%)
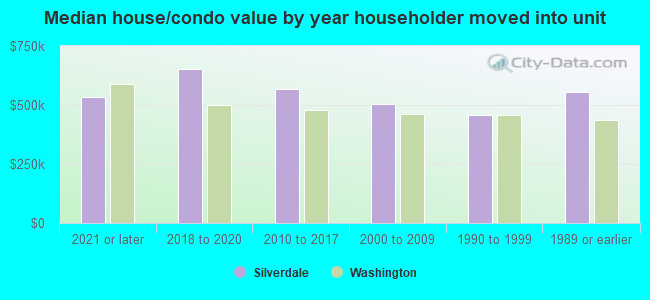
House/condo owner moved in on average (years ago)
Renter moved in on average (years ago)
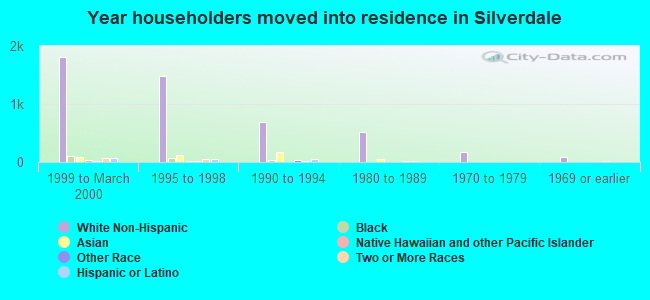
Year householder moved into unit - Moved in 1999 to March 2000 (%)
Year householder moved into unit - Moved in 1999 to March 2000 (%) - White
Year householder moved into unit - Moved in 1999 to March 2000 (%) - Black or African American
Year householder moved into unit - Moved in 1999 to March 2000 (%) - Asian
Year householder moved into unit - Moved in 1999 to March 2000 (%) - Hispanic or Latino
Year householder moved into unit - Moved in 1999 to March 2000 (%) - American Indian and Alaska Native
Year householder moved into unit - Moved in 1999 to March 2000 (%) - Multirace
Year householder moved into unit - Moved in 1999 to March 2000 (%) - Other Race
Year householder moved into unit - Moved in 1995 to 1998 (%)
Year householder moved into unit - Moved in 1995 to 1998 (%) - White
Year householder moved into unit - Moved in 1995 to 1998 (%) - Black or African American
Year householder moved into unit - Moved in 1995 to 1998 (%) - Asian
Year householder moved into unit - Moved in 1995 to 1998 (%) - Hispanic or Latino
Year householder moved into unit - Moved in 1995 to 1998 (%) - American Indian and Alaska Native
Year householder moved into unit - Moved in 1995 to 1998 (%) - Multirace
Year householder moved into unit - Moved in 1995 to 1998 (%) - Other Race
Year householder moved into unit - Moved in 1990 to 1994 (%)
Year householder moved into unit - Moved in 1990 to 1994 (%) - White
Year householder moved into unit - Moved in 1990 to 1994 (%) - Black or African American
Year householder moved into unit - Moved in 1990 to 1994 (%) - Asian
Year householder moved into unit - Moved in 1990 to 1994 (%) - Hispanic or Latino
Year householder moved into unit - Moved in 1990 to 1994 (%) - American Indian and Alaska Native
Year householder moved into unit - Moved in 1990 to 1994 (%) - Multirace
Year householder moved into unit - Moved in 1990 to 1994 (%) - Other Race
Year householder moved into unit - Moved in 1980 to 1989 (%)
Year householder moved into unit - Moved in 1980 to 1989 (%) - White
Year householder moved into unit - Moved in 1980 to 1989 (%) - Black or African American
Year householder moved into unit - Moved in 1980 to 1989 (%) - Asian
Year householder moved into unit - Moved in 1980 to 1989 (%) - Hispanic or Latino
Year householder moved into unit - Moved in 1980 to 1989 (%) - American Indian and Alaska Native
Year householder moved into unit - Moved in 1980 to 1989 (%) - Multirace
Year householder moved into unit - Moved in 1980 to 1989 (%) - Other Race
Year householder moved into unit - Moved in 1970 to 1979 (%)
Year householder moved into unit - Moved in 1970 to 1979 (%) - White
Year householder moved into unit - Moved in 1970 to 1979 (%) - Black or African American
Year householder moved into unit - Moved in 1970 to 1979 (%) - Asian
Year householder moved into unit - Moved in 1970 to 1979 (%) - Hispanic or Latino
Year householder moved into unit - Moved in 1970 to 1979 (%) - American Indian and Alaska Native
Year householder moved into unit - Moved in 1970 to 1979 (%) - Multirace
Year householder moved into unit - Moved in 1970 to 1979 (%) - Other Race
Year householder moved into unit - Moved in 1969 or earlier (%)
Year householder moved into unit - Moved in 1969 or earlier (%) - White
Year householder moved into unit - Moved in 1969 or earlier (%) - Black or African American
Year householder moved into unit - Moved in 1969 or earlier (%) - Asian
Year householder moved into unit - Moved in 1969 or earlier (%) - Hispanic or Latino
Year householder moved into unit - Moved in 1969 or earlier (%) - American Indian and Alaska Native
Year householder moved into unit - Moved in 1969 or earlier (%) - Multirace
Year householder moved into unit - Moved in 1969 or earlier (%) - Other Race
Housing units lacking complete plumbing facilities (%)
Housing units lacking complete kitchen facilities (%)
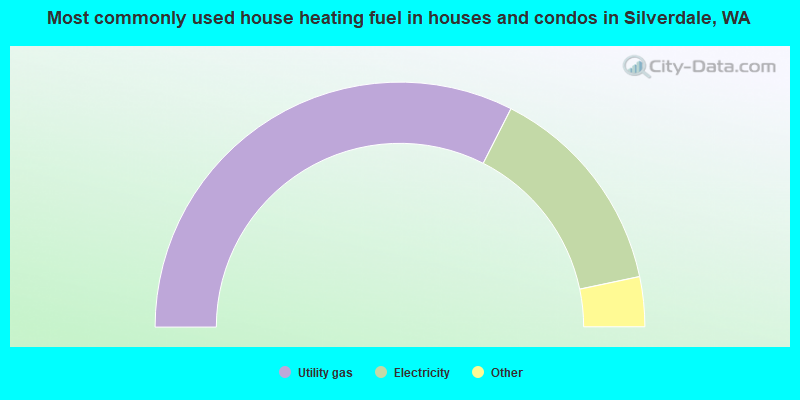
House heating fuel used in houses and condos - Utility gas (%)
House heating fuel used in houses and condos - Bottled, tank, or LP gas (%)
House heating fuel used in houses and condos - Electricity (%)
House heating fuel used in houses and condos - Fuel oil, kerosene, etc. (%)
House heating fuel used in houses and condos - Coal or coke (%)
House heating fuel used in houses and condos - Wood (%)
House heating fuel used in houses and condos - Solar energy (%)
House heating fuel used in houses and condos - Other fuel (%)
House heating fuel used in houses and condos - No fuel used (%)
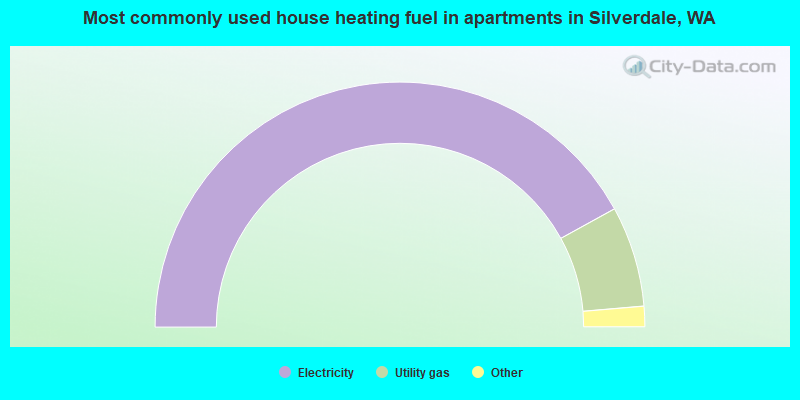
House heating fuel used in apartments - Utility gas (%)
House heating fuel used in apartments - Bottled, tank, or LP gas (%)
House heating fuel used in apartments - Electricity (%)
House heating fuel used in apartments - Fuel oil, kerosene, etc. (%)
House heating fuel used in apartments - Coal or coke (%)
House heating fuel used in apartments - Wood (%)
House heating fuel used in apartments - Solar energy (%)
House heating fuel used in apartments - Other fuel (%)
House heating fuel used in apartments - No fuel used (%)
Latest news about housing in Silverdale, WA collected exclusively by city-data.com from local newspapers, TV, and radio stations
Median year house/condo built: 1992Median year apartment built: 1994Household type by relationship:
Households: 21,952
Male householders: 4,611 (824 living alone ), Female householders: 3,922 (1,264 living alone )4,269 spouses (4,211 opposite-sex spouses ), 593 unmarried partners , (583 opposite-sex unmarried partners ), 6,158 children (5,501 natural , 350 adopted , 305 stepchildren ), 415 grandchildren , 97 brothers or sisters , 221 parents , 12 foster children , 237 other relatives , 1,199 non-relatives In group quarters: 211
Size of family households: 2,256 2-persons , 1,731 3-persons , 1,250 4-persons , 497 5-persons , 130 6-persons , 145 7-or-more-persons .
Size of nonfamily households: 2,101 1-person , 523 2-persons , 51 3-persons , 46 4-persons .
2,839 married couples with children. single-parent households (333 men , 768 women ).
90.1% of residents of Silverdale speak English at home. of residents speak Spanish at home (68% speak English very well , 25% speak English well , 2% speak English not well , 5% don't speak English at all ).of residents speak other Indo-European language at home (91% speak English very well , 9% speak English well ).of residents speak Asian or Pacific Island language at home (65% speak English very well , 35% speak English well , 1% speak English not well ).of residents speak other language at home (100% speak English very well ).
Foreign born population: 2,012 (9.2%)of them are naturalized citizens )
Median number of rooms in houses and condos:
Median number of rooms in apartments
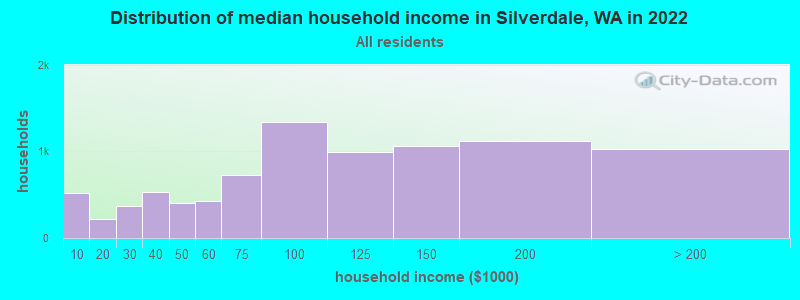
Silverdale, WA household income distribution 514 Less than $10,000217 $10,000 to $19,999364 $20,000 to $29,999527 $30,000 to $39,999406 $40,000 to $49,999432 $50,000 to $59,999730 $60,000 to $74,9991,338 $75,000 to $99,999987 $100,000 to $124,9991,056 $125,000 to $149,9991,123 $150,000 to $199,9991,031 $200,000 or more
Home value of owner - occupied houses in 2022 in Silverdale, WA 77 Less than $10,00015 $25,000 to $29,99910 $30,000 to $34,99949 $40,000 to $49,99916 $50,000 to $59,9999 $60,000 to $69,99916 $90,000 to $99,9999 $100,000 to $124,99921 $150,000 to $174,99914 $175,000 to $199,99958 $200,000 to $249,999142 $250,000 to $299,999685 $300,000 to $399,9991,124 $400,000 to $499,9991,943 $500,000 to $749,999315 $750,000 to $999,99946 $1,000,000 to $1,499,99935 $1,500,000 to $1,999,9996 $2,000,000 or moreRent paid by renters in 2022 in Silverdale, WA 7 Less than $10034 $150 to $19920 $200 to $24919 $250 to $2997 $350 to $3999 $400 to $44917 $450 to $49929 $500 to $54911 $550 to $59959 $600 to $64913 $650 to $69989 $700 to $74929 $800 to $89940 $900 to $999310 $1,000 to $1,249282 $1,250 to $1,4991,618 $1,500 to $1,9991,353 $2,000 to $2,499128 $2,500 to $2,99923 $3,000 to $3,499114 $3,500 or more80 No cash rent
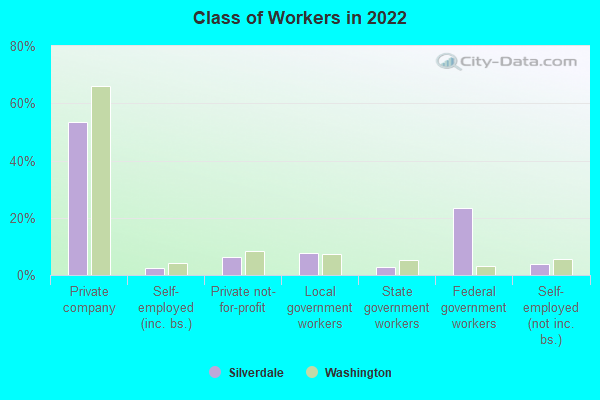
Percentage of workers working in this county: 92.6%Number of people working at home: 946 (8.8% of all workers )
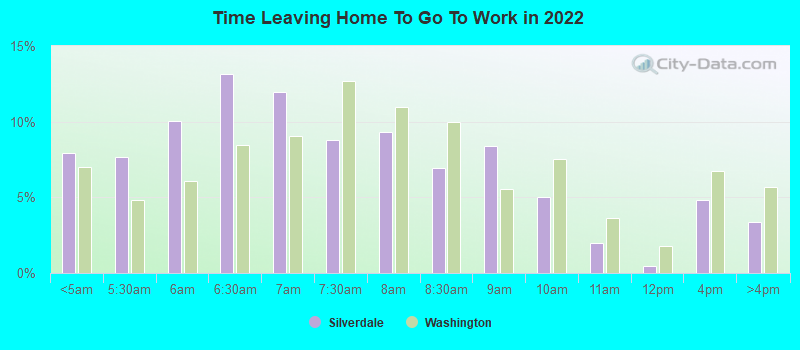
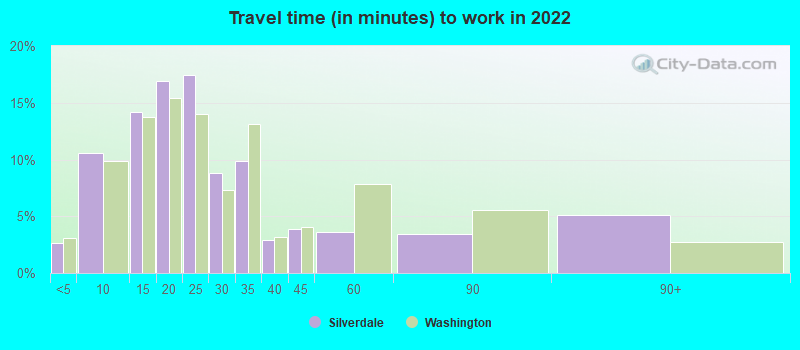
Travel time to work (commute)
Less than 5 minutes: 3005 to 9 minutes: 92410 to 14 minutes: 1,04015 to 19 minutes: 1,93720 to 24 minutes: 1,77325 to 29 minutes: 56330 to 34 minutes: 1,35435 to 39 minutes: 9240 to 44 minutes: 22045 to 59 minutes: 48760 to 89 minutes: 49890 or more minutes: 501
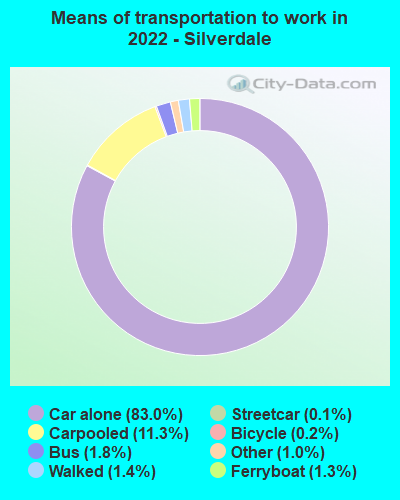
Means of transportation to work:
Drove a car alone: 11,315 (75.2%)Carpooled: 2,067 (13.7%)Bus : 102 (0.7%)Subway or elevated rail : 14 (0.1%)Ferryboat: 152 (1.0%)Taxi: 155 (1.0%)Bicycle: 30 (0.2%)Walked: 187 (1.2%)Worked at home: 946 (6.3%)
Unemployment by race in 2022
Unemployment rate for White non-Hispanic residents 8.1% Males3.7% FemalesUnemployment rate for Black residents 3.9% FemalesUnemployment rate for Asian residents 1.0% FemalesUnemployment rate for two or more race residents 10.0% Males1.9% FemalesUnemployment rate for Hispanic or Latino residents 5.3% Males1.6% Females
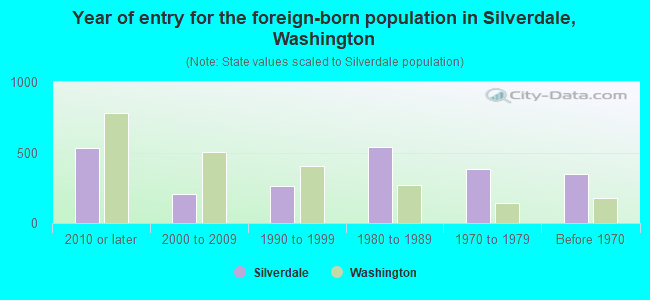
Year of entry for the foreign-born population in Silverdale, Washington
531 2010 or later 209 2000 to 2009 265 1990 to 1999 538 1980 to 1989 380 1970 to 1979 346 Before 1970
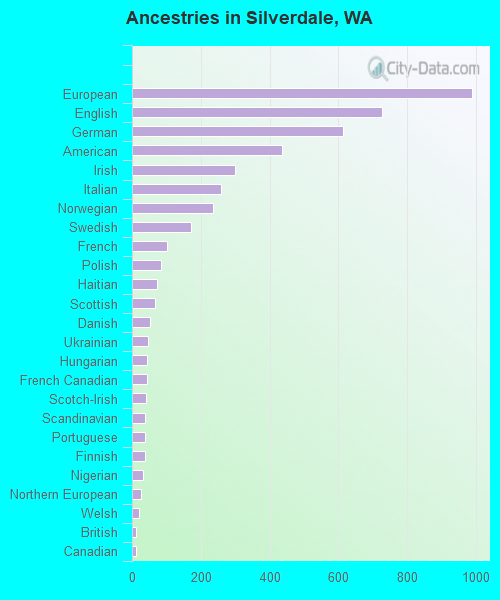
First ancestries reported:
European: 989 (11.5%)
English: 727 (8.5%)
German: 614 (7.1%)
American: 437 (5.1%)
Irish: 300 (3.5%)
Italian: 260 (3.0%)
Norwegian: 237 (2.8%)
Swedish: 172 (2.0%)
French: 103 (1.2%)
Polish: 84 (1.0%)
Haitian: 74 (0.9%)
Scottish: 67 (0.8%)
Danish: 52 (0.6%)
Ukrainian: 46 (0.5%)
Hungarian: 45 (0.5%)
French Canadian: 44 (0.5%)
Scotch-Irish: 42 (0.5%)
Scandinavian: 39 (0.5%)
Portuguese: 38 (0.4%)
Finnish: 37 (0.4%)
Nigerian: 31 (0.4%)
Northern European: 27 (0.3%)
Welsh: 19 (0.2%)
British: 13 (0.2%)
Canadian: 12 (0.1%)
African: 12 (0.1%)
British West Indian: 10 (0.1%)
Russian: 8 (0.09%)
Lebanese: 4 (0.05%)
Eastern European: 4 (0.05%)
Jamaican: 4 (0.05%) Most common places of birth for foreign-born residents (%): Philippines Silverdale:
42.2% (794)Washington:
6.3% (71,661)
Mexico Silverdale:
11.5% (217)Washington:
21.1% (241,655)
Japan Silverdale:
7.1% (134)Washington:
1.5% (17,453)
India Silverdale:
4.3% (81)Washington:
8.9% (101,353)
Italy Silverdale:
4.1% (78)Washington:
0.2% (2,551)
China, excluding Hong Kong and Taiwan Silverdale:
4.0% (76)Washington:
7.4% (84,470)
Thailand Silverdale:
3.9% (74)Washington:
0.9% (9,937)
Vietnam Silverdale:
3.9% (73)Washington:
5.4% (62,003)
Poland Silverdale:
3.4% (64)Washington:
0.4% (4,963)
England Silverdale:
2.9% (55)Washington:
0.8% (9,457)
Korea Silverdale:
2.7% (50)Washington:
4.3% (48,886)
Haiti Silverdale:
2.0% (37)Washington:
0.2% (2,421)
Nigeria Silverdale:
1.5% (29)Washington:
0.2% (2,660)
Place of birth for U.S.-born residents:
This state: 8,058Other state: 11,065Northeast: 1,669Midwest: 2,275South: 2,803West: 4,380 77.4% of Silverdale residents lived in the same house 1 years ago.
Out of people who lived in different houses, 37.1% lived in this county.
Out of people who lived in different counties, 18.5% lived in Washington.
Silverdale:
77.4%State average:
85.2%
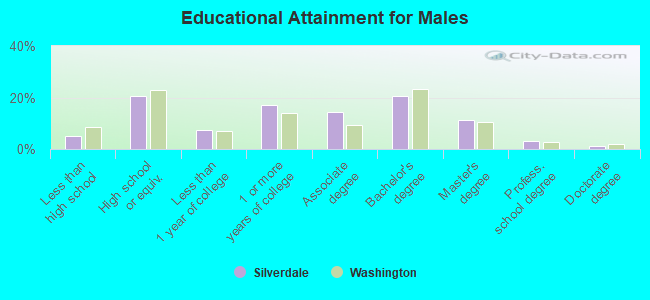
Education attainment for males 25 years and older:
No schooling: 42Nursery to 4th grade: 05th and 6th grade: 167th and 8th grade: 19th grade: 5910th grade: 2311th grade: 7412th grade, no diploma: 134High school graduate (or equivalency): 1,457Less than 1 year of college: 537Some college more than 1 year, no degree: 1,218Associate degree: 1,017Bachelor's degree: 1,466Master's degree: 789Professional school degree: 209Doctorate degree: 70
Education attainment for females 25 years and older:
No schooling: 65Nursery to 4th grade: 505th and 6th grade: 07th and 8th grade: 1099th grade: 2810th grade: 511th grade: 4612th grade, no diploma: 50High school graduate (or equivalency): 1,553Less than 1 year of college: 485Some college more than 1 year, no degree: 1,447Associate degree: 1,172Bachelor's degree: 1,872Master's degree: 686Professional school degree: 118Doctorate degree: 35
Housing units in structures:
One, detached: 4,865One, attached: 472Two: 2843 or 4: 3705 to 9: 61610 to 19: 99920 to 49: 61050 or more: 736Mobile homes: 229Median worth of mobile homes: $218,964
Housing units lacking complete plumbing facilities in 2022: 1.4%Housing units lacking complete kitchen facilities in 2022: 1.5%House/condo owner moved in on average 14 years ago
Renter moved in on average 3 years ago
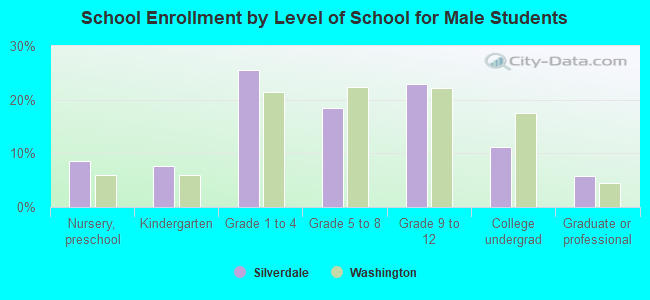
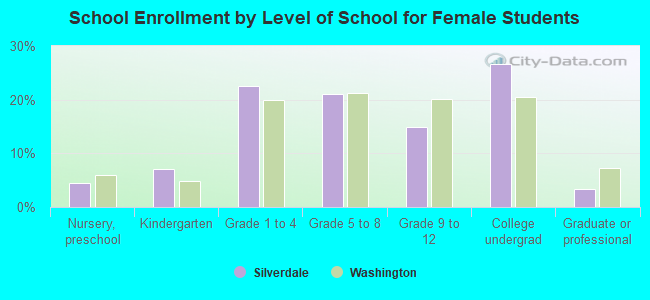
Private vs. public school enrollment:
Students in private schools in grades 1 to 8 (elementary and middle school): 156 Here:
7.8%Washington:
12.4%
Students in private schools in grades 9 to 12 (high school): 45 Students in private undergraduate colleges: 143 Here:
15.8%Washington:
16.5%