Silver Springs Shores, FL (Florida) Houses and Residents
Estimated median house or condo value in 2022: $204,518 (it was $56,600 in 2000 )
Silver Springs Shores:
$204,518Florida:
$354,100
Lower value quartile - upper value quartile: $161,921 - $254,487Mean price in 2022: Detached houses: $173,939 Here:
$173,939State:
$500,941
Townhouses or other attached units: $109,478 Here:
$109,478State:
$370,869
In 2-unit structures: $175,168 Here:
$175,168State:
$423,188
In 3-to-4-unit structures: $64,569 Here:
$64,569State:
$309,944
In 5-or-more-unit structures: $150,989 Here:
$150,989State:
$447,145
Total population: 6,539 (All urban)
Houses: 10,924 (9,877 occupied: 7,351 owner occupied, 2,575 renter occupied )
% of renters here:
26%State:
33%
Housing density: 2,288 houses/condos per square mile
Median price asked for vacant for-sale houses and condos in 2022: $387,468.
Median contract rent in 2022: $983 (lower quartile is $792, upper quartile is $1,213)
Median rent asked for vacant for-rent units in 2022: $1,641
Median gross rent in Silver Springs Shores, FL in 2022: $1,136
Housing units in Silver Springs Shores with a mortgage: 5,003 (197 second mortgage, 0 home equity loan, 129 both second mortgage and home equity loan )Houses without a mortgage: 56
Median household income for houses/condos with a mortgage: $62,534
Median household income for apartments without a mortgage: $31,419
Median monthly housing costs: $978
Data:
Median house or condo value ($)
Median house or condo value ($ change since 2000)
Median house or condo value ($) - White
Median house or condo value ($) - Black or African American
Median house or condo value ($) - Asian
Median house or condo value ($) - Hispanic or Latino
Median house or condo value ($) - American Indian and Alaska Native
Median house or condo value ($) - Multirace
Median house or condo value ($) - Other Race
Median price asked for mobile homes ($)
Household density (households per square mile)
Mean house or condo value by units in structure - 1, detached ($)
Mean house or condo value by units in structure - 1, attached ($)
Mean house or condo value by units in structure - 2 ($)
Mean house or condo value by units in structure by units in structure - 3 or 4 ($)
Mean house or condo value by units in structure - 5 or more ($)
Mean house or condo value by units in structure - Boat, RV, van, etc. ($)
Mean house or condo value by units in structure - Mobile home ($)
Median contract rent ($)
Median contract rent - Lower quartile ($)
Median contract rent - Upper quartile ($)
Median gross rent ($)
Urban houses (%)
Rural houses (%)
Houses occupied (%)
Houses occupied (% change since 2000)
Houses owner occupied (%)
Houses owner occupied (% change since 2000)
Houses renter occupied (%)
Houses renter occupied (% change since 2000)
Vacant housing units - For rent (%)
Vacant housing units - For rent (% change since 2000)
Vacant housing units - For sale only (%)
Vacant housing units - For sale only (% change since 2000)
Vacant housing units - Rented or sold, not occupied (%)
Vacant housing units - Rented or sold, not occupied (% change since 2000)
Vacant housing units - For seasonal, recreational, or occasional use (%)
Vacant housing units - For seasonal, recreational, or occasional use (% change since 2000)
Vacant housing units - For migrant workers (%)
Vacant housing units - For migrant workers (% change since 2000)
Vacant housing units - Other vacant (%)
Vacant housing units - Other vacant (% change since 2000)
Median monthly housing costs ($)
Median household income for houses/condos with a mortgage ($)
Median household income for houses/condos without a mortgage ($)
Median household income ($)
Median household income ($) - White
Median household income ($) - Black or African American
Median household income ($) - Asian
Median household income ($) - Hispanic or Latino
Median household income ($) - American Indian and Alaska Native
Median household income ($) - Multirace
Median household income ($) - Other Race
Mortgage status - with mortgage (%)
Mortgage status - with second mortgage (%)
Mortgage status - with home equity loan (%)
Mortgage status - with both second mortgage and home equity loan (%)
Mortgage status - without a mortgage (%)
Median year house/condo built
Median year apartment built
Household type by relationship - Male householder living alone (%)
Household type by relationship - Male householder not living alone (%)
Household type by relationship - Female householder living alone (%)
Household type by relationship - Female householder not living alone (%)
Household type by relationship - Opposite-Sex spouse (%)
Household type by relationship - Same-Sex spouse (%)
Household type by relationship - Opposite-Sex unmarried partner (%)
Household type by relationship - Same-Sex unmarried partner (%)
Household type by relationship - In group quarters (%)
Size of family households - 2-person household (%)
Size of family households - 3-person household (%)
Size of family households - 4-person household (%)
Size of family households - 5-person household (%)
Size of family households - 6-person household (%)
Size of family households - 7-or-more-person household (%)
Size of nonfamily households - 1-person household (%)
Size of nonfamily households - 2-person household (%)
Size of nonfamily households - 3-person household (%)
Size of nonfamily households - 4-person household (%)
Size of nonfamily households - 5-person household (%)
Size of nonfamily households - 6-person household (%)
Size of nonfamily households - 7-or-moreperson household (%)
Year house built - Built 2010 or later (%)
Year house built - Built 2000 to 2009 (%)
Year house built - Built 1990 to 1999 (%)
Year house built - Built 1980 to 1989 (%)
Year house built - Built 1970 to 1979 (%)
Year house built - Built 1960 to 1969 (%)
Year house built - Built 1950 to 1959 (%)
Year house built - Built 1940 to 1949 (%)
Year house built - Built 1939 or earlier (%)
Median number of rooms in houses and condos
Median number of rooms in apartments
Median number of bedrooms in owner occupied houses
Mean number of bedrooms in owner occupied houses
Median number of bedrooms in renter occupied houses
Mean number of bedrooms in renter occupied houses
Median number of vehichles in owner occupied houses
Mean number of vehichles in owner occupied houses
Median number of vehichles in renter occupied houses
Mean number of vehichles in renter occupied houses
Rooms in owner-occupied houses - 1 room (%)
Rooms in owner-occupied houses - 2 rooms (%)
Rooms in owner-occupied houses - 3 rooms (%)
Rooms in owner-occupied houses - 4 rooms (%)
Rooms in owner-occupied houses - 5 rooms (%)
Rooms in owner-occupied houses - 6 rooms (%)
Rooms in owner-occupied houses - 7 rooms (%)
Rooms in owner-occupied houses - 8 rooms (%)
Rooms in owner-occupied houses - 9+ rooms (%)
Rooms in renter-occupied houses - 1 room (%)
Rooms in renter-occupied houses - 2 rooms (%)
Rooms in renter-occupied houses - 3 rooms (%)
Rooms in renter-occupied houses - 4 rooms (%)
Rooms in renter-occupied houses - 5 rooms (%)
Rooms in renter-occupied houses - 6 rooms (%)
Rooms in renter-occupied houses - 7 rooms (%)
Rooms in renter-occupied houses - 8 rooms (%)
Rooms in renter-occupied houses - 9+ rooms (%)
Bedrooms in owner-occupied houses - no bedrooms (%)
Bedrooms in owner-occupied houses - 1 bedroom (%)
Bedrooms in owner-occupied houses - 2 bedrooms (%)
Bedrooms in owner-occupied houses - 3 bedrooms (%)
Bedrooms in owner-occupied houses - 4 bedrooms (%)
Bedrooms in owner-occupied houses - 5+ bedrooms (%)
Bedrooms in renter-occupied houses - no bedrooms (%)
Bedrooms in renter-occupied houses - 1 bedroom (%)
Bedrooms in renter-occupied houses - 2 bedrooms (%)
Bedrooms in renter-occupied houses - 3 bedrooms (%)
Bedrooms in renter-occupied houses - 4 bedrooms (%)
Bedrooms in renter-occupied houses - 5+ bedrooms (%)
Vehicles available in owner-occupied houses - no vehicle available (%)
Vehicles available in owner-occupied houses - 1 vehicle available(%)
Vehicles available in owner-occupied houses - 2 Vehicles available (%)
Vehicles available in owner-occupied houses - 3 Vehicles available (%)
Vehicles available in owner-occupied houses - 4 Vehicles available (%)
Vehicles available in owner-occupied houses - 5+ Vehicles available (%)
Vehicles available in renter-occupied houses - no vehicle available (%)
Vehicles available in renter-occupied houses - 1 vehicle available (%)
Vehicles available in renter-occupied houses - 2 Vehicles available (%)
Vehicles available in renter-occupied houses - 3 Vehicles available (%)
Vehicles available in renter-occupied houses - 4 Vehicles available (%)
Vehicles available in renter-occupied houses - 5+ Vehicles available (%)
Housing units in structures - 1, detached (%)
Housing units in structures - 1, attached (%)
Housing units in structures - 2 (%)
Housing units in structures - 3 or 4 (%)
Housing units in structures - 5 to 9 (%)
Housing units in structures - 10 to 19 (%)
Housing units in structures - 20 to 49 (%)
Housing units in structures - 50 or more (%)
Housing units in structures - Mobile home (%)
Housing units in structures - Boat, RV, van, etc. (%)
Housing units in structures - Owners - 1, detached (%)
Housing units in structures - Owners - 1, attached (%)
Housing units in structures - Owners - 2 (%)
Housing units in structures - Owners - 3 or 4 (%)
Housing units in structures - Owners - 5 to 9 (%)
Housing units in structures - Owners - 10 to 19 (%)
Housing units in structures - Owners - 20 to 49 (%)
Housing units in structures - Owners - 50 or more (%)
Housing units in structures - Owners - Mobile home (%)
Housing units in structures - Owners - Boat, RV, van, etc. (%)
Housing units in structures - Renters - 1, detached (%)
Housing units in structures - Renters - 1, attached (%)
Housing units in structures - Renters - 2 (%)
Housing units in structures - Renters - 3 or 4 (%)
Housing units in structures - Renters - 5 to 9 (%)
Housing units in structures - Renters - 10 to 19 (%)
Housing units in structures - Renters - 20 to 49 (%)
Housing units in structures - Renters - 50 or more (%)
Housing units in structures - Renters - Mobile home (%)
Housing units in structures - Renters - Boat, RV, van, etc. (%)
House/condo owner moved in on average (years ago)
Renter moved in on average (years ago)
Year householder moved into unit - Moved in 1999 to March 2000 (%)
Year householder moved into unit - Moved in 1999 to March 2000 (%) - White
Year householder moved into unit - Moved in 1999 to March 2000 (%) - Black or African American
Year householder moved into unit - Moved in 1999 to March 2000 (%) - Asian
Year householder moved into unit - Moved in 1999 to March 2000 (%) - Hispanic or Latino
Year householder moved into unit - Moved in 1999 to March 2000 (%) - American Indian and Alaska Native
Year householder moved into unit - Moved in 1999 to March 2000 (%) - Multirace
Year householder moved into unit - Moved in 1999 to March 2000 (%) - Other Race
Year householder moved into unit - Moved in 1995 to 1998 (%)
Year householder moved into unit - Moved in 1995 to 1998 (%) - White
Year householder moved into unit - Moved in 1995 to 1998 (%) - Black or African American
Year householder moved into unit - Moved in 1995 to 1998 (%) - Asian
Year householder moved into unit - Moved in 1995 to 1998 (%) - Hispanic or Latino
Year householder moved into unit - Moved in 1995 to 1998 (%) - American Indian and Alaska Native
Year householder moved into unit - Moved in 1995 to 1998 (%) - Multirace
Year householder moved into unit - Moved in 1995 to 1998 (%) - Other Race
Year householder moved into unit - Moved in 1990 to 1994 (%)
Year householder moved into unit - Moved in 1990 to 1994 (%) - White
Year householder moved into unit - Moved in 1990 to 1994 (%) - Black or African American
Year householder moved into unit - Moved in 1990 to 1994 (%) - Asian
Year householder moved into unit - Moved in 1990 to 1994 (%) - Hispanic or Latino
Year householder moved into unit - Moved in 1990 to 1994 (%) - American Indian and Alaska Native
Year householder moved into unit - Moved in 1990 to 1994 (%) - Multirace
Year householder moved into unit - Moved in 1990 to 1994 (%) - Other Race
Year householder moved into unit - Moved in 1980 to 1989 (%)
Year householder moved into unit - Moved in 1980 to 1989 (%) - White
Year householder moved into unit - Moved in 1980 to 1989 (%) - Black or African American
Year householder moved into unit - Moved in 1980 to 1989 (%) - Asian
Year householder moved into unit - Moved in 1980 to 1989 (%) - Hispanic or Latino
Year householder moved into unit - Moved in 1980 to 1989 (%) - American Indian and Alaska Native
Year householder moved into unit - Moved in 1980 to 1989 (%) - Multirace
Year householder moved into unit - Moved in 1980 to 1989 (%) - Other Race
Year householder moved into unit - Moved in 1970 to 1979 (%)
Year householder moved into unit - Moved in 1970 to 1979 (%) - White
Year householder moved into unit - Moved in 1970 to 1979 (%) - Black or African American
Year householder moved into unit - Moved in 1970 to 1979 (%) - Asian
Year householder moved into unit - Moved in 1970 to 1979 (%) - Hispanic or Latino
Year householder moved into unit - Moved in 1970 to 1979 (%) - American Indian and Alaska Native
Year householder moved into unit - Moved in 1970 to 1979 (%) - Multirace
Year householder moved into unit - Moved in 1970 to 1979 (%) - Other Race
Year householder moved into unit - Moved in 1969 or earlier (%)
Year householder moved into unit - Moved in 1969 or earlier (%) - White
Year householder moved into unit - Moved in 1969 or earlier (%) - Black or African American
Year householder moved into unit - Moved in 1969 or earlier (%) - Asian
Year householder moved into unit - Moved in 1969 or earlier (%) - Hispanic or Latino
Year householder moved into unit - Moved in 1969 or earlier (%) - American Indian and Alaska Native
Year householder moved into unit - Moved in 1969 or earlier (%) - Multirace
Year householder moved into unit - Moved in 1969 or earlier (%) - Other Race
Housing units lacking complete plumbing facilities (%)
Housing units lacking complete kitchen facilities (%)
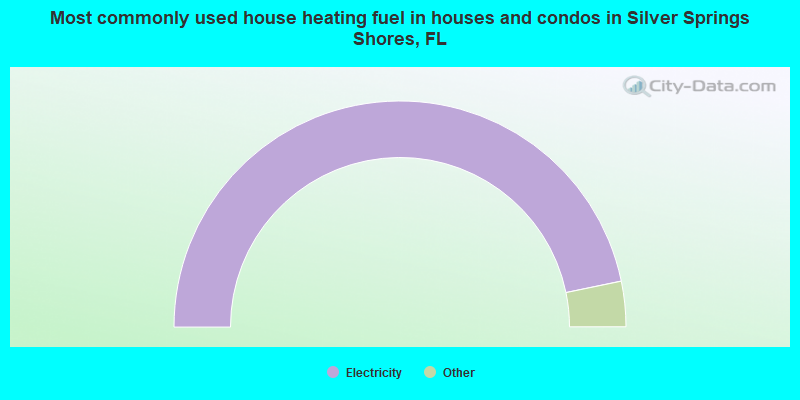
House heating fuel used in houses and condos - Utility gas (%)
House heating fuel used in houses and condos - Bottled, tank, or LP gas (%)
House heating fuel used in houses and condos - Electricity (%)
House heating fuel used in houses and condos - Fuel oil, kerosene, etc. (%)
House heating fuel used in houses and condos - Coal or coke (%)
House heating fuel used in houses and condos - Wood (%)
House heating fuel used in houses and condos - Solar energy (%)
House heating fuel used in houses and condos - Other fuel (%)
House heating fuel used in houses and condos - No fuel used (%)
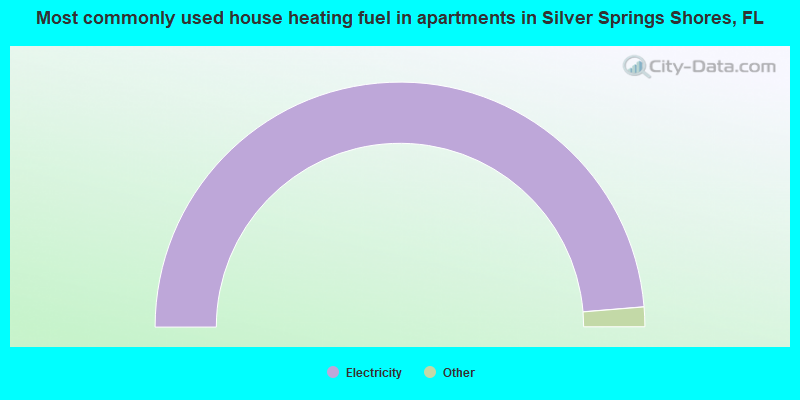
House heating fuel used in apartments - Utility gas (%)
House heating fuel used in apartments - Bottled, tank, or LP gas (%)
House heating fuel used in apartments - Electricity (%)
House heating fuel used in apartments - Fuel oil, kerosene, etc. (%)
House heating fuel used in apartments - Coal or coke (%)
House heating fuel used in apartments - Wood (%)
House heating fuel used in apartments - Solar energy (%)
House heating fuel used in apartments - Other fuel (%)
House heating fuel used in apartments - No fuel used (%)
Median year house/condo built: 1997Median year apartment built: 1992Household type by relationship:
Households: 26,677
Male householders: 4,856 (1,167 living alone ), Female householders: 5,005 (1,601 living alone )4,507 spouses (4,329 opposite-sex spouses ), 505 unmarried partners , (418 opposite-sex unmarried partners ), 7,559 children (5,909 natural , 230 adopted , 1,420 stepchildren ), 1,088 grandchildren , 248 brothers or sisters , 579 parents , 0 foster children , 834 other relatives , 1,446 non-relatives In group quarters: 44
Size of family households: 2,166 2-persons , 2,015 3-persons , 1,222 4-persons , 449 5-persons , 201 6-persons , 345 7-or-more-persons .
Size of nonfamily households: 2,697 1-person , 619 2-persons , 22 3-persons , 387 4-persons .
3,342 married couples with children. single-parent households (212 men , 1,016 women ).
75.8% of residents of Silver Springs Shores speak English at home. of residents speak Spanish at home (63% speak English very well , 26% speak English well , 8% speak English not well , 3% don't speak English at all ).of residents speak other Indo-European language at home (38% speak English very well , 19% speak English well , 44% speak English not well ).of residents speak Asian or Pacific Island language at home (68% speak English very well , 24% speak English well , 8% speak English not well ).of residents speak other language at home (100% speak English very well ).
Foreign born population: 2,603 (9.8%)of them are naturalized citizens )
Median number of rooms in houses and condos:
Median number of rooms in apartments
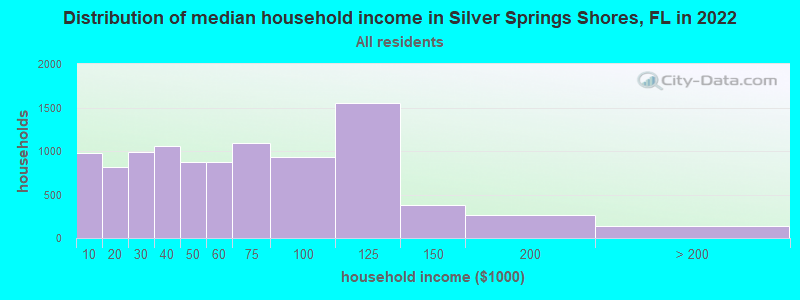
Silver Springs Shores, FL household income distribution 974 Less than $10,000820 $10,000 to $19,999987 $20,000 to $29,9991,056 $30,000 to $39,999870 $40,000 to $49,999875 $50,000 to $59,9991,091 $60,000 to $74,999929 $75,000 to $99,9991,556 $100,000 to $124,999377 $125,000 to $149,999260 $150,000 to $199,999143 $200,000 or more
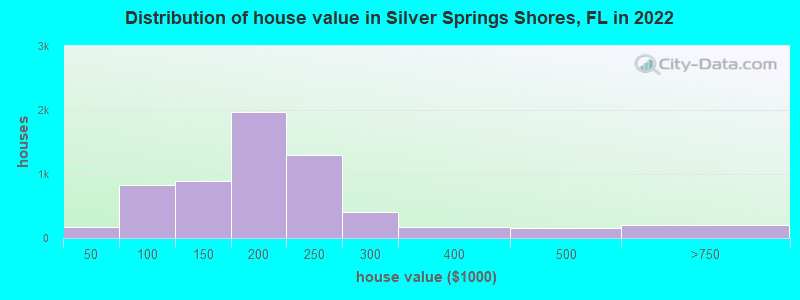
Home value of owner - occupied houses in 2022 in Silver Springs Shores, FL 19 Less than $10,00069 $10,000 to $14,99943 $15,000 to $19,9993 $20,000 to $24,9999 $30,000 to $34,99924 $40,000 to $49,99953 $50,000 to $59,99967 $60,000 to $69,999183 $70,000 to $79,999176 $80,000 to $89,999319 $90,000 to $99,999383 $100,000 to $124,999506 $125,000 to $149,999924 $150,000 to $174,9991,040 $175,000 to $199,9991,297 $200,000 to $249,999414 $250,000 to $299,999170 $300,000 to $399,999162 $400,000 to $499,999180 $500,000 to $749,99929 $2,000,000 or moreRent paid by renters in 2022 in Silver Springs Shores, FL 26 $100 to $14936 $350 to $39996 $550 to $59947 $600 to $64950 $650 to $699298 $700 to $74984 $750 to $799203 $800 to $899340 $900 to $999670 $1,000 to $1,249140 $1,250 to $1,499289 $1,500 to $1,99919 No cash rent
Percentage of workers working in this county: 82.7%Number of people working at home: 1,347 (11.8% of all workers )
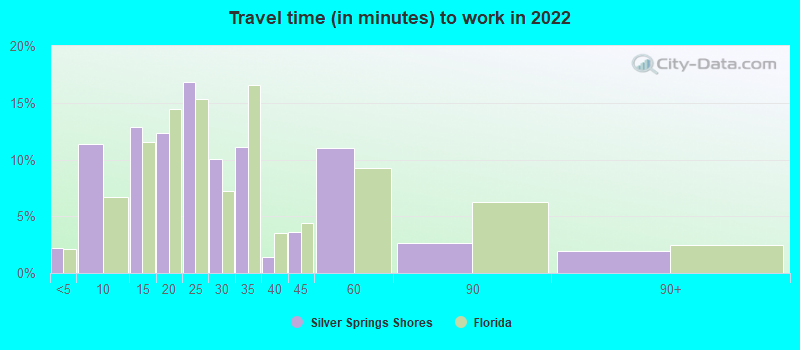
Travel time to work (commute)
Less than 5 minutes: 865 to 9 minutes: 59110 to 14 minutes: 72615 to 19 minutes: 1,58120 to 24 minutes: 1,76625 to 29 minutes: 1,03930 to 34 minutes: 2,15335 to 39 minutes: 29940 to 44 minutes: 24445 to 59 minutes: 64860 to 89 minutes: 49990 or more minutes: 212
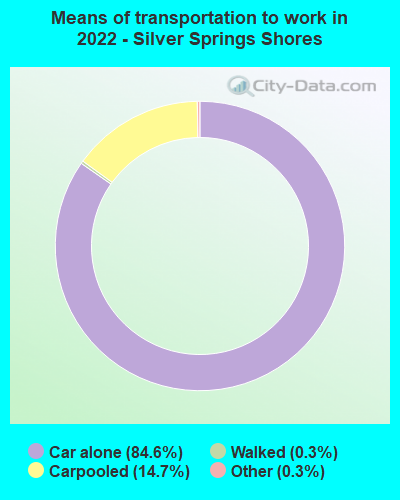
Means of transportation to work:
Drove a car alone: 3,454 (65.1%)Carpooled: 639 (12.0%)Taxi: 14 (0.3%)Walked: 13 (0.2%)Worked at home: 1,321 (24.9%)
Unemployment by race in 2022
Unemployment rate for White non-Hispanic residents 1.4% Males3.9% FemalesUnemployment rate for Black residents 1.9% Males3.1% FemalesUnemployment rate for other race residents 3.6% Males7.0% FemalesUnemployment rate for two or more race residents 3.6% MalesUnemployment rate for Hispanic or Latino residents 0.3% Males2.5% Females
Year of entry for the foreign-born population in Silver Springs Shores, Florida
636 2010 or later 410 2000 to 2009 310 1990 to 1999 150 1980 to 1989 354 1970 to 1979 478 Before 1970
First ancestries reported:
American: 1,174 (7.6%)
Jamaican: 1,056 (6.9%)
Irish: 936 (6.1%)
German: 818 (5.3%)
English: 547 (3.6%)
Italian: 486 (3.2%)
African: 342 (2.2%)
Polish: 277 (1.8%)
Dutch: 195 (1.3%)
West Indian: 153 (1.0%)
Portuguese: 130 (0.8%)
Scottish: 115 (0.7%)
Hungarian: 92 (0.6%)
Slovak: 86 (0.6%)
Brazilian: 82 (0.5%)
Norwegian: 76 (0.5%)
European: 59 (0.4%)
Scotch-Irish: 54 (0.4%)
Swiss: 46 (0.3%)
Guyanese: 45 (0.3%)
Russian: 44 (0.3%)
Turkish: 26 (0.2%)
Austrian: 25 (0.2%)
French Canadian: 20 (0.1%)
Icelander: 17 (0.1%)
Cajun: 13 (0.08%)
Lebanese: 11 (0.07%)
Swedish: 10 (0.07%)
British: 9 (0.06%)
Welsh: 9 (0.06%)
Nigerian: 8 (0.05%)
Lithuanian: 4 (0.03%)
Armenian: 1 (0.01%) Most common places of birth for foreign-born residents (%): Jamaica Silver Springs Shores:
27.1% (689)Florida:
5.0% (227,319)
Cuba Silver Springs Shores:
15.2% (385)Florida:
22.0% (1,006,576)
Colombia Silver Springs Shores:
11.8% (299)Florida:
6.5% (298,669)
Brazil Silver Springs Shores:
4.9% (125)Florida:
2.7% (122,906)
Guyana Silver Springs Shores:
3.5% (88)Florida:
0.7% (33,556)
Dominican Republic Silver Springs Shores:
3.3% (83)Florida:
3.0% (137,727)
Venezuela Silver Springs Shores:
3.0% (77)Florida:
5.7% (262,042)
Panama Silver Springs Shores:
2.4% (60)Florida:
0.5% (22,972)
West Indies Silver Springs Shores:
2.0% (52)Florida:
0.1% (2,367)
Thailand Silver Springs Shores:
1.9% (49)Florida:
0.3% (12,303)
United Kingdom, excluding England and Scotland Silver Springs Shores:
1.8% (45)Florida:
0.7% (34,227)
Mexico Silver Springs Shores:
1.8% (45)Florida:
5.6% (257,152)
Germany Silver Springs Shores:
1.7% (44)Florida:
1.2% (54,272)
Place of birth for U.S.-born residents:
This state: 10,831Other state: 10,120Northeast: 4,541Midwest: 3,223South: 1,740West: 625 92.6% of Silver Springs Shores residents lived in the same house 1 years ago.
Out of people who lived in different houses, 29.6% lived in this county.
Out of people who lived in different counties, 45.8% lived in Florida.
Silver Springs Shores:
92.6%State average:
86.3%
Education attainment for males 25 years and older:
No schooling: 321Nursery to 4th grade: 05th and 6th grade: 647th and 8th grade: 3059th grade: 4010th grade: 5011th grade: 17112th grade, no diploma: 132High school graduate (or equivalency): 3,401Less than 1 year of college: 372Some college more than 1 year, no degree: 1,624Associate degree: 1,028Bachelor's degree: 674Master's degree: 291Professional school degree: 33Doctorate degree: 40
Education attainment for females 25 years and older:
No schooling: 151Nursery to 4th grade: 755th and 6th grade: 1287th and 8th grade: 1239th grade: 7110th grade: 22811th grade: 12912th grade, no diploma: 183High school graduate (or equivalency): 2,720Less than 1 year of college: 559Some college more than 1 year, no degree: 1,399Associate degree: 1,626Bachelor's degree: 1,118Master's degree: 624Professional school degree: 40Doctorate degree: 7
Housing units in structures:
One, detached: 9,455One, attached: 18Two: 303 or 4: 2485 to 9: 48810 to 19: 23620 to 49: 950 or more: 339Mobile homes: 98Median worth of mobile homes: $249,929
Housing units lacking complete kitchen facilities in 2022: 0.1%House/condo owner moved in on average 8 years ago
Renter moved in on average 5 years ago
Private vs. public school enrollment:
Students in private schools in grades 1 to 8 (elementary and middle school): 181 Students in private schools in grades 9 to 12 (high school): 58 Students in private undergraduate colleges: 503