Siloam Springs, AR (Arkansas) Houses and Residents
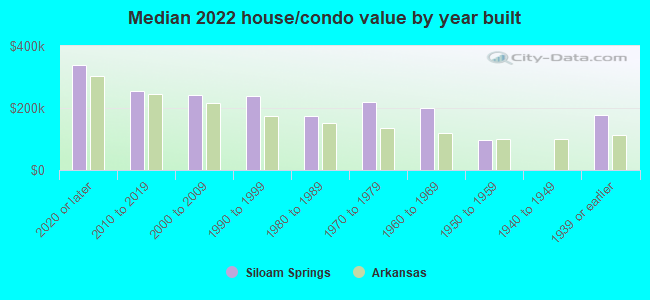
| Siloam Springs: | $229,450 |
| Arkansas: | $179,800 |
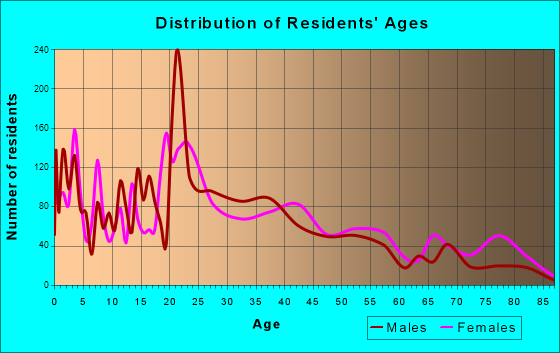
Total population: 15,944 (Urban population: 10,180 (all inside urban clusters), Rural population: 623 (all nonfarm))
Houses: 6,970 (6,383 occupied: 3,726 owner occupied, 2,688 renter occupied)
| % of renters here: | 42% |
| State: | 34% |
Housing density: 660 houses/condos per square mile
Median price asked for vacant for-sale houses and condos in 2022: $173,870.
Median contract rent in 2022: $705 (lower quartile is $583, upper quartile is $951)
Median rent asked for vacant for-rent units in 2022: $4,553
Median gross rent in Siloam Springs, AR in 2022: $928
Housing units in Siloam Springs with a mortgage: 2,659 (216 second mortgage, 0 home equity loan, 102 both second mortgage and home equity loan)
Houses without a mortgage: 12
Median household income for houses/condos with a mortgage: $86,592
Median household income for apartments without a mortgage: $48,377
Median monthly housing costs: $985
Compare current foreclosures in Siloam Springs, AR:
| Photo | Address | Area | Beds / Baths | Price | Details |
|---|---|---|---|---|---|

|
#1
Bruce Rutherford Dr
Siloam Springs, AR 72761
|
2,098 sq. feet
|
2 baths 4 beds |
show details | |

|
#2
Cortney Cir
Siloam Springs, AR 72761
|
2,213 sq. feet
|
2 baths 4 beds |
show details | |

|
#3
Old Highway 68
Siloam Springs, AR 72761
|
- sq. feet
|
2 baths 3 beds |
show details | |

|
#4
Sheffield Rd
Siloam Springs, AR 72761
|
3,276 sq. feet
|
3 baths - beds |
show details | |

|
#5
N Hico St
Siloam Springs, AR 72761
|
999 sq. feet
|
1 baths - beds |
show details | |

|
#6
Wood Tree Ct
Siloam Springs, AR 72761
|
1,014 sq. feet
|
1 baths - beds |
show details | |

|
#7
Flynt St
Siloam Springs, AR 72761
|
1,483 sq. feet
|
2 baths - beds |
show details | |

|
#8
S College St
Siloam Springs, AR 72761
|
2,172 sq. feet
|
2 baths - beds |
show details | |

|
#9
Henegar Dr
Siloam Springs, AR 72761
|
1,150 sq. feet
|
2 baths - beds |
show details | |

|
#10
S Madison St
Siloam Springs, AR 72761
|
2,390 sq. feet
|
2 baths - beds |
show details |
| Photo | Address | Area | Beds / Baths | Price | Details |
|---|---|---|---|---|---|

|
#11
S Lincoln St
Siloam Springs, AR 72761
|
1,260 sq. feet
|
1 baths - beds |
show details | |

|
#12
Reed Rd
Siloam Springs, AR 72761
|
2,556 sq. feet
|
2 baths - beds |
show details | |

|
#13
Wildwood Ln
Siloam Springs, AR 72761
|
1,431 sq. feet
|
2 baths - beds |
show details | |

|
#14
Old Highway 68
Siloam Springs, AR 72761
|
988 sq. feet
|
2 baths - beds |
show details | |

|
#15
Long Farm Rd
Siloam Springs, AR 72761
|
1,344 sq. feet
|
1 baths - beds |
show details | |

|
#16
Highway 16 E
Siloam Springs, AR 72761
|
1,354 sq. feet
|
1 baths - beds |
show details | |

|
#17
N Mount Olive St
Siloam Springs, AR 72761
|
1,961 sq. feet
|
1 baths - beds |
show details | |

|
#18
Ash Ct
Siloam Springs, AR 72761
|
1,406 sq. feet
|
2 baths - beds |
show details | |

|
#19
Highway 244 N
Siloam Springs, AR 72761
|
3,058 sq. feet
|
2 baths - beds |
show details | |

|
#20
S Maxwell St
Siloam Springs, AR 72761
|
1,700 sq. feet
|
2 baths - beds |
show details |
| Photo | Address | Area | Beds / Baths | Price | Details |
|---|---|---|---|---|---|

|
#21
Lacy St
Siloam Springs, AR 72761
|
1,342 sq. feet
|
2 baths - beds |
show details | |

|
#22
Osage Bend Rd
Siloam Springs, AR 72761
|
- sq. feet
|
- baths - beds |
show details | |

|
#23
Butler Rd
Siloam Springs, AR 72761
|
1,216 sq. feet
|
- baths - beds |
show details | |

|
#24
Bolinger Ln
Siloam Springs, AR 72761
|
- sq. feet
|
- baths - beds |
show details | |

|
#25
Latisha Ln
Siloam Springs, AR 72761
|
- sq. feet
|
- baths - beds |
show details | |

|
#26
Rodric Dr
Siloam Springs, AR 72761
|
- sq. feet
|
- baths - beds |
show details | |

|
#27
W Worchester
Siloam Springs, AR 72761
|
- sq. feet
|
- baths - beds |
show details | |

|
#28
Cozy Corner Rd
Siloam Springs, AR 72761
|
- sq. feet
|
- baths - beds |
show details | |

|
#29
W Twin Springs St Apt 5
Siloam Springs, AR 72761
|
- sq. feet
|
- baths - beds |
show details | |

|
#30
N Cameron St
Siloam Springs, AR 72761
|
- sq. feet
|
- baths - beds |
show details |
| Photo | Address | Area | Beds / Baths | Price | Details |
|---|---|---|---|---|---|

|
#31
Dawn Hill Rd E
Siloam Springs, AR 72761
|
- sq. feet
|
- baths - beds |
show details | |

|
#32
E Endura Park Dr
Siloam Springs, AR 72761
|
- sq. feet
|
- baths - beds |
show details | |

|
#33
S Corsac St
Siloam Springs, AR 72761
|
- sq. feet
|
- baths - beds |
show details | |

|
#34
W Garland St
Siloam Springs, AR 72761
|
- sq. feet
|
- baths - beds |
show details | |

|
#35
S Whiterock St
Siloam Springs, AR 72761
|
- sq. feet
|
- baths - beds |
show details | |

|
#36
S Oak Hill St
Siloam Springs, AR 72761
|
- sq. feet
|
- baths - beds |
show details | |

|
#37
N Garrett St Apt D
Siloam Springs, AR 72761
|
- sq. feet
|
- baths - beds |
show details | |

|
#38
S Crow St
Siloam Springs, AR 72761
|
- sq. feet
|
- baths - beds |
show details | |

|
#39
E Brookview Cir
Siloam Springs, AR 72761
|
- sq. feet
|
- baths - beds |
show details | |

|
#40
W Worchester
Siloam Springs, AR 72761
|
- sq. feet
|
- baths - beds |
show details |
| Photo | Address | Area | Beds / Baths | Price | Details |
|---|---|---|---|---|---|

|
#41
Lewis Cir
Siloam Springs, AR 72761
|
- sq. feet
|
- baths - beds |
show details | |

|
#42
S Parrot Ln
Siloam Springs, AR 72761
|
- sq. feet
|
- baths - beds |
show details | |

|
#43
E Annette Dr
Siloam Springs, AR 72761
|
- sq. feet
|
- baths - beds |
show details | |

|
#44
Old Highway 68
Siloam Springs, AR 72761
|
- sq. feet
|
- baths - beds |
show details | |

|
Check over 1 million property listings on Foreclosure.com!
|
browse all offers | |||


 | Where can I find small historic homes in NWA? (10 replies) |
| Seems Like A Lot Of Homes On The Market? (26 replies) |
| Sold Our House and Moved Back to California (6 replies) |
| Some questions about NWA (13 replies) |
| Fayetteville new law (73 replies) |
| NWA's Hwy. 412 to be designated as future interstate (18 replies) |
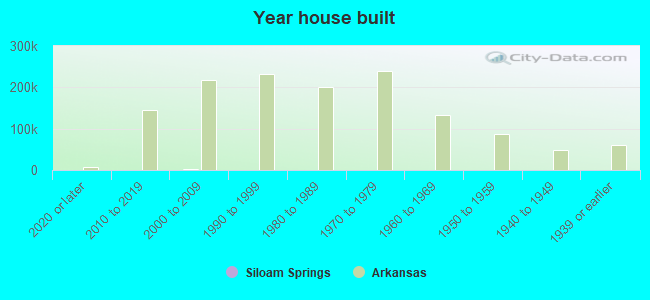
Median year apartment built: 1998
Household type by relationship:
Households: 18,637- Male householders: 3,086 (559 living alone), Female householders: 3,216 (768 living alone)
3,358 spouses (3,358 opposite-sex spouses), 353 unmarried partners, (341 opposite-sex unmarried partners), 5,919 children (5,607 natural, 139 adopted, 172 stepchildren), 276 grandchildren, 119 brothers or sisters, 324 parents, 0 foster children, 233 other relatives, 602 non-relatives
- In group quarters: 1,146
Size of family households: 1,529 2-persons, 751 3-persons, 1,412 4-persons, 689 5-persons, 180 6-persons, 142 7-or-more-persons.
Size of nonfamily households: 1,453 1-person, 206 2-persons, 18 3-persons, 17 4-persons.
3,230 married couples with children.
1,074 single-parent households (112 men, 962 women).
79.0% of residents of Siloam Springs speak English at home.
19.0% of residents speak Spanish at home (51% speak English very well, 23% speak English well, 14% speak English not well, 12% don't speak English at all).
1.7% of residents speak other Indo-European language at home (48% speak English very well, 5% speak English well, 47% don't speak English at all).
0.8% of residents speak Asian or Pacific Island language at home (64% speak English very well, 5% speak English well, 30% speak English not well).
Foreign born population: 2,462 (13.2%)
(19.9% of them are naturalized citizens)
| Here: | 6.0 |
| State: | 6.1 |
| Here: | 4.1 |
| State: | 4.3 |
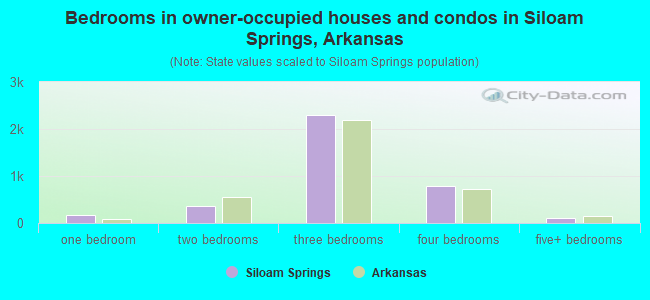
- Bedrooms in owner-occupied houses and condos in Siloam Springs, Arkansas
- 0no bedroom
- 1681 bedroom
- 3562 bedrooms
- 2,3023 bedrooms
- 7934 bedrooms
- 1085+ bedrooms
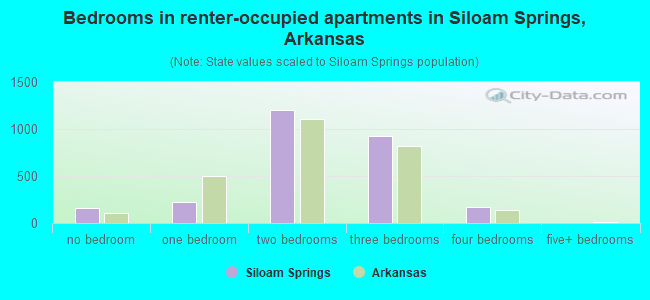
- Bedrooms in renter-occupied apartments in Siloam Springs, Arkansas
- 161no bedroom
- 2251 bedroom
- 1,2052 bedrooms
- 9303 bedrooms
- 1674 bedrooms
- 05+ bedrooms
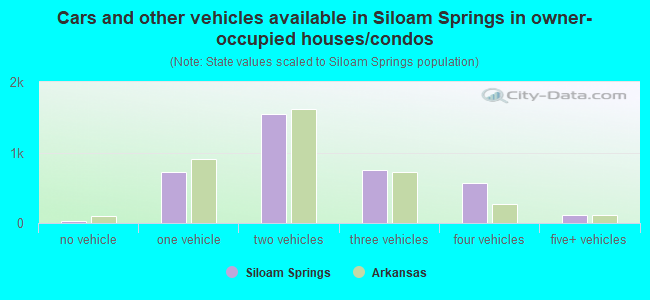
- Cars and other vehicles available in Siloam Springs in owner-occupied houses/condos
- 22no vehicle
- 7261 vehicle
- 1,5402 vehicles
- 7503 vehicles
- 5744 vehicles
- 1145+ vehicles
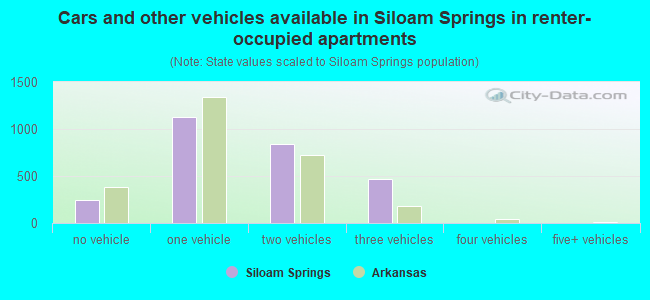
- Cars and other vehicles available in Siloam Springs in renter-occupied apartments
- 248no vehicle
- 1,1241 vehicle
- 8422 vehicles
- 4733 vehicles
- 04 vehicles
- 05+ vehicles
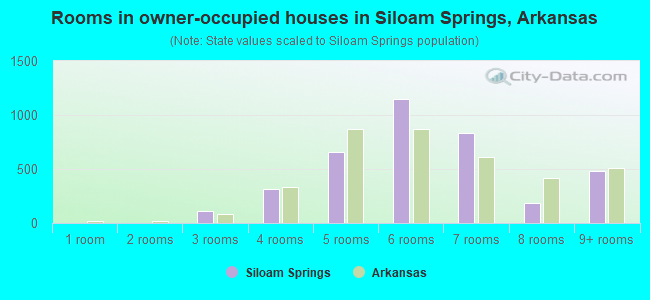
- Rooms in owner-occupied houses in Siloam Springs, Arkansas
- 01 room
- 02 rooms
- 1093 rooms
- 3134 rooms
- 6575 rooms
- 1,1516 rooms
- 8337 rooms
- 1858 rooms
- 4799+ rooms
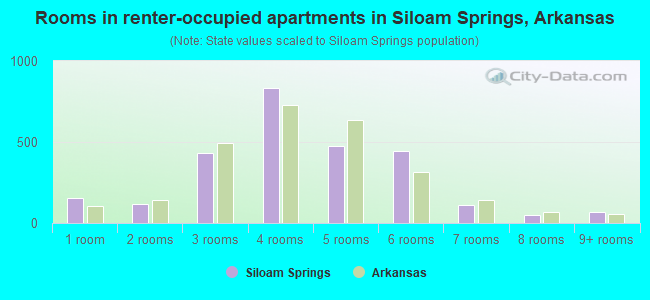
- Rooms in renter-occupied apartments in Siloam Springs, Arkansas
- 1551 room
- 1172 rooms
- 4353 rooms
- 8354 rooms
- 4755 rooms
- 4426 rooms
- 1147 rooms
- 488 rooms
- 679+ rooms
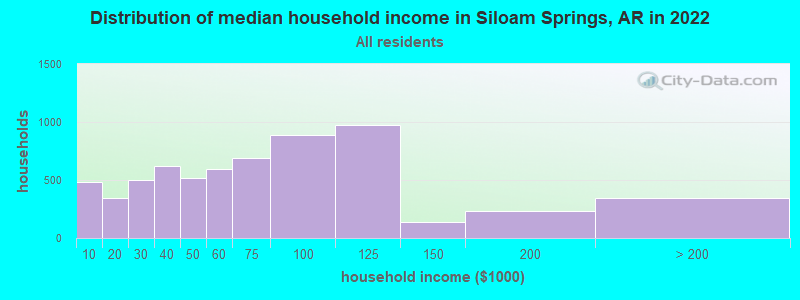
Siloam Springs, AR household income distribution

- 486Less than $10,000
- 343$10,000 to $19,999
- 502$20,000 to $29,999
- 623$30,000 to $39,999
- 516$40,000 to $49,999
- 592$50,000 to $59,999
- 688$60,000 to $74,999
- 886$75,000 to $99,999
- 972$100,000 to $124,999
- 140$125,000 to $149,999
- 229$150,000 to $199,999
- 347$200,000 or more
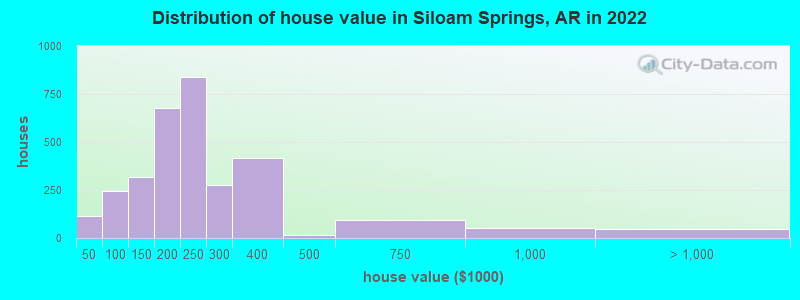
Home value of owner - occupied houses in 2022 in Siloam Springs, AR
-
- 3Less than $10,000
- 43$15,000 to $19,999
- 5$25,000 to $29,999
- 14$30,000 to $34,999
- 49$40,000 to $49,999
- 12$50,000 to $59,999
- 11$60,000 to $69,999
- 61$70,000 to $79,999
- 66$80,000 to $89,999
- 46$90,000 to $99,999
- 119$100,000 to $124,999
- 196$125,000 to $149,999
- 361$150,000 to $174,999
- 314$175,000 to $199,999
- 838$200,000 to $249,999
- 275$250,000 to $299,999
- 418$300,000 to $399,999
- 16$400,000 to $499,999
- 93$500,000 to $749,999
- 51$750,000 to $999,999
- 45$1,000,000 to $1,499,999
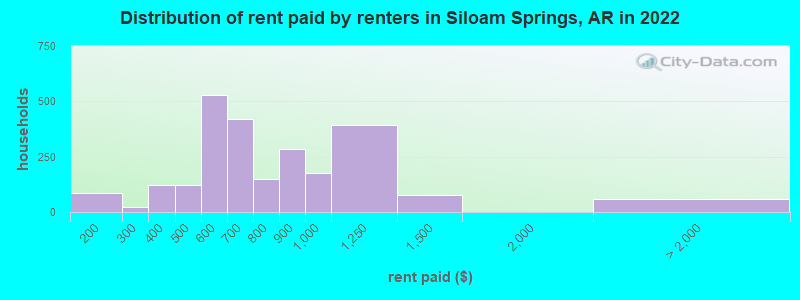
Rent paid by renters in 2022 in Siloam Springs, AR
-
- 84$150 to $199
- 23$250 to $299
- 54$300 to $349
- 65$350 to $399
- 51$400 to $449
- 70$450 to $499
- 251$500 to $549
- 278$550 to $599
- 237$600 to $649
- 179$650 to $699
- 57$700 to $749
- 91$750 to $799
- 283$800 to $899
- 175$900 to $999
- 393$1,000 to $1,249
- 77$1,250 to $1,499
- 56No cash rent
Percentage of workers working in this county: 86.4%
Number of people working at home: 714 (8.2% of all workers)
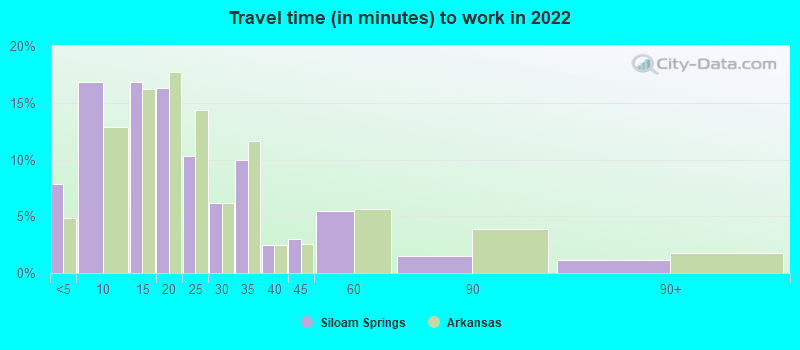
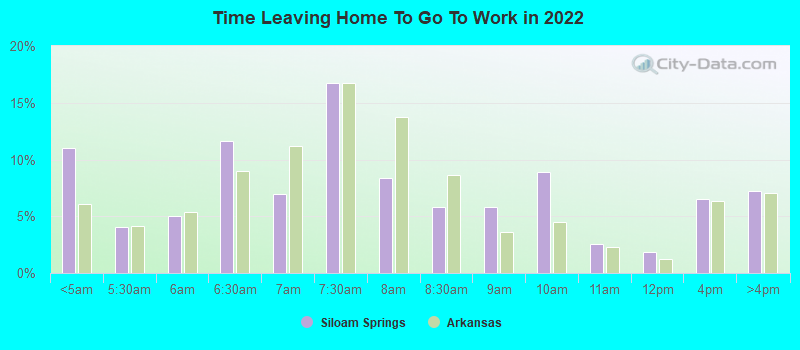
Travel time to work (commute)
- Less than 5 minutes: 762
- 5 to 9 minutes: 1,579
- 10 to 14 minutes: 1,417
- 15 to 19 minutes: 816
- 20 to 24 minutes: 582
- 25 to 29 minutes: 107
- 30 to 34 minutes: 720
- 35 to 39 minutes: 177
- 40 to 44 minutes: 282
- 45 to 59 minutes: 526
- 60 to 89 minutes: 607
- 90 or more minutes: 112
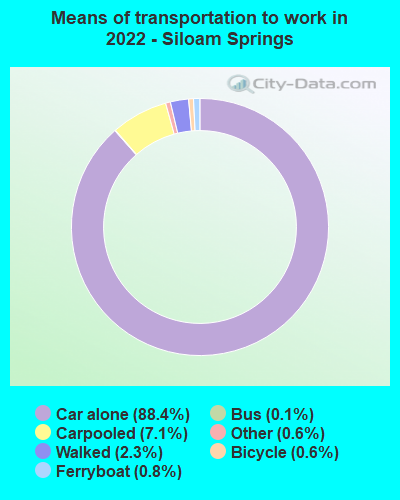
Means of transportation to work:
- Drove a car alone: 8,842 (80.3%)
- Carpooled: 677 (6.1%)
- Bus: 27 (0.2%)
- Ferryboat: 81 (0.7%)
- Taxi: 66 (0.6%)
- Bicycle: 59 (0.5%)
- Walked: 372 (3.4%)
- Worked at home: 714 (6.5%)
- Unemployment by race in 2022
- Unemployment rate for White non-Hispanic residents
- 5.2%Males
- 3.8%Females
- Unemployment rate for two or more race residents
- 0.9%Males
- 1.0%Females
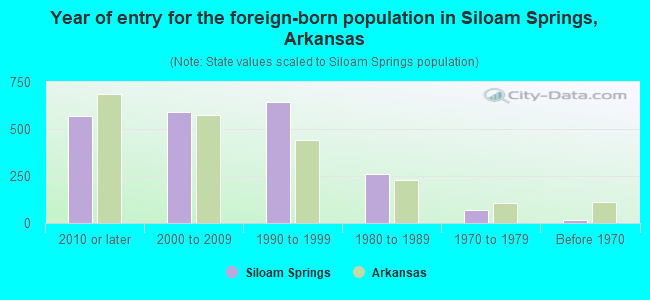
- Year of entry for the foreign-born population in Siloam Springs, Arkansas
- 5702010 or later
- 5922000 to 2009
- 6421990 to 1999
- 2601980 to 1989
- 681970 to 1979
- 16Before 1970
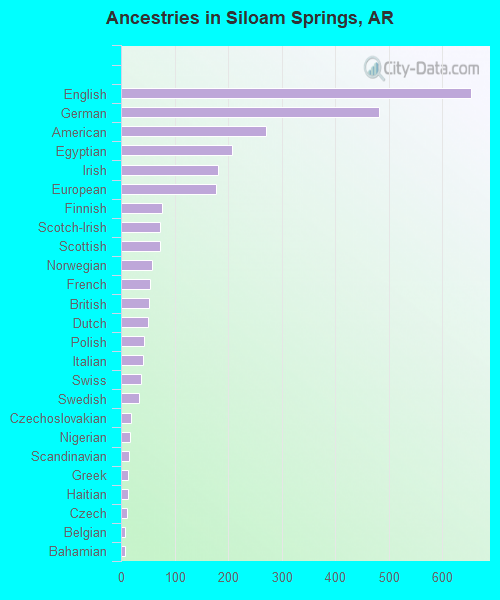
First ancestries reported:
- English: 655 (8.5%)
- German: 482 (6.2%)
- American: 271 (3.5%)
- Egyptian: 207 (2.7%)
- Irish: 181 (2.3%)
- European: 177 (2.3%)
- Finnish: 76 (1.0%)
- Scotch-Irish: 73 (0.9%)
- Scottish: 72 (0.9%)
- Norwegian: 58 (0.8%)
- French: 55 (0.7%)
- British: 52 (0.7%)
- Dutch: 50 (0.6%)
- Polish: 43 (0.6%)
- Italian: 42 (0.5%)
- Swiss: 38 (0.5%)
- Swedish: 34 (0.4%)
- Czechoslovakian: 19 (0.2%)
- Nigerian: 16 (0.2%)
- Scandinavian: 15 (0.2%)
- Greek: 13 (0.2%)
- Haitian: 13 (0.2%)
- Czech: 11 (0.1%)
- Belgian: 8 (0.1%)
- Bahamian: 8 (0.1%)
- Dutch West Indian: 8 (0.1%)
- New Zealander: 6 (0.08%)
- Russian: 5 (0.06%)
- Kenyan: 5 (0.06%)
- African: 5 (0.06%)
Most common places of birth for foreign-born residents (%):
| Siloam Springs: | 45.9% (1,057) |
| Arkansas: | 10.7% (16,210) |
| Siloam Springs: | 22.6% (521) |
| Arkansas: | 40.2% (61,075) |
| Siloam Springs: | 7.7% (178) |
| Arkansas: | 6.1% (9,278) |
| Siloam Springs: | 4.6% (107) |
| Arkansas: | 0.2% (329) |
| Siloam Springs: | 4.6% (105) |
| Arkansas: | 3.5% (5,376) |
| Siloam Springs: | 3.3% (77) |
| Arkansas: | 0.5% (755) |
| Siloam Springs: | 1.8% (42) |
| Arkansas: | 0.2% (338) |
Place of birth for U.S.-born residents:
- This state: 7,733
- Other state: 8,009
- Northeast: 400
- Midwest: 2,260
- South: 3,189
- West: 2,184
84.7% of Siloam Springs residents lived in the same house 1 years ago.
Out of people who lived in different houses, 37.0% lived in this county.
Out of people who lived in different counties, 35.5% lived in Arkansas.
| Siloam Springs: | 84.7% |
| State average: | 87.0% |
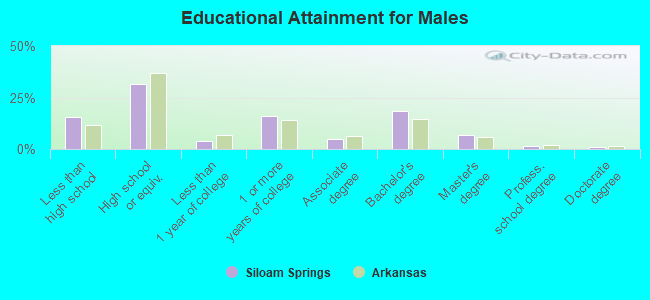
Education attainment for males 25 years and older:
- No schooling: 332
- Nursery to 4th grade: 61
- 5th and 6th grade: 92
- 7th and 8th grade: 83
- 9th grade: 95
- 10th grade: 34
- 11th grade: 32
- 12th grade, no diploma: 42
- High school graduate (or equivalency): 1,562
- Less than 1 year of college: 189
- Some college more than 1 year, no degree: 794
- Associate degree: 244
- Bachelor's degree: 911
- Master's degree: 346
- Professional school degree: 67
- Doctorate degree: 54
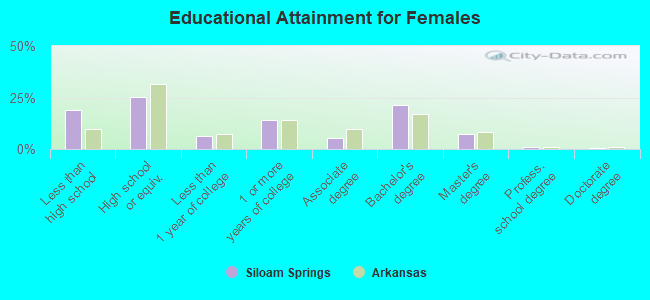
Education attainment for females 25 years and older:
- No schooling: 333
- Nursery to 4th grade: 31
- 5th and 6th grade: 147
- 7th and 8th grade: 72
- 9th grade: 200
- 10th grade: 106
- 11th grade: 137
- 12th grade, no diploma: 33
- High school graduate (or equivalency): 1,419
- Less than 1 year of college: 350
- Some college more than 1 year, no degree: 797
- Associate degree: 316
- Bachelor's degree: 1,223
- Master's degree: 404
- Professional school degree: 61
- Doctorate degree: 36
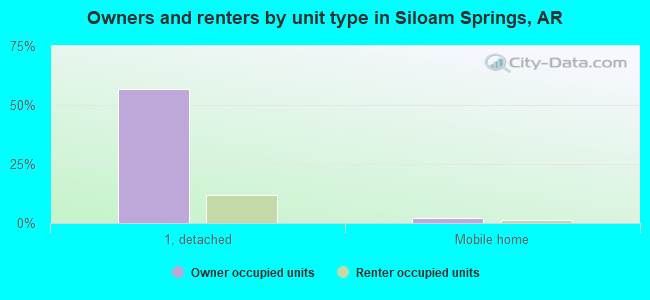
Housing units in structures:
- One, detached: 4,905
- One, attached: 441
- Two: 425
- 3 or 4: 274
- 5 to 9: 221
- 10 to 19: 432
- 20 to 49: 54
- 50 or more: 8
- Mobile homes: 207
Median worth of mobile homes: $61,442
Housing units lacking complete kitchen facilities in 2022: 5.3%
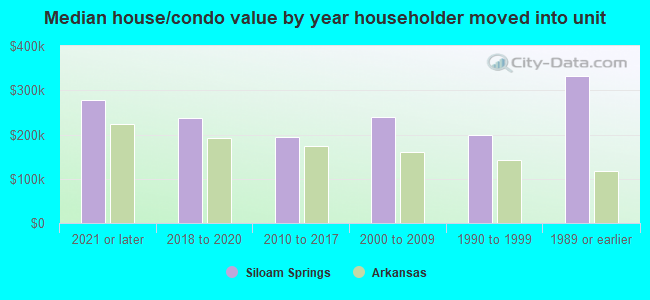
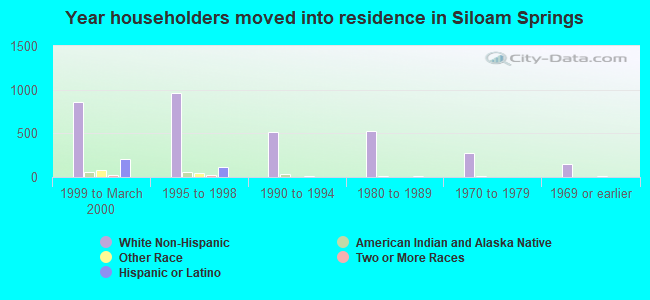
House/condo owner moved in on average 9 years ago
Renter moved in on average 3 years ago
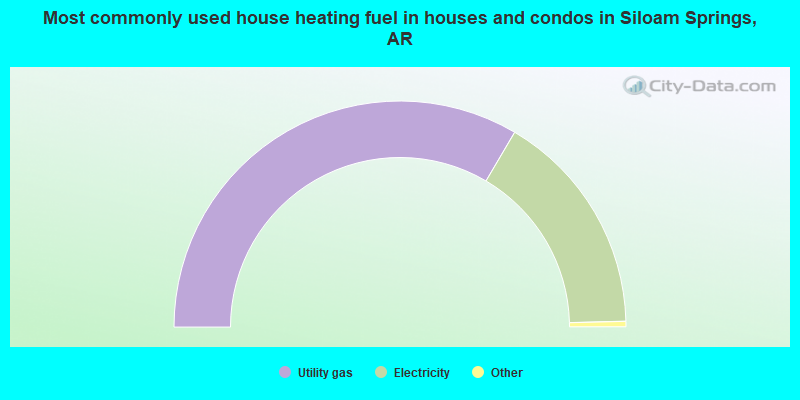
- 66.9%Utility gas
- 32.2%Electricity
- 0.6%Bottled, tank, or LP gas
- 0.2%Wood
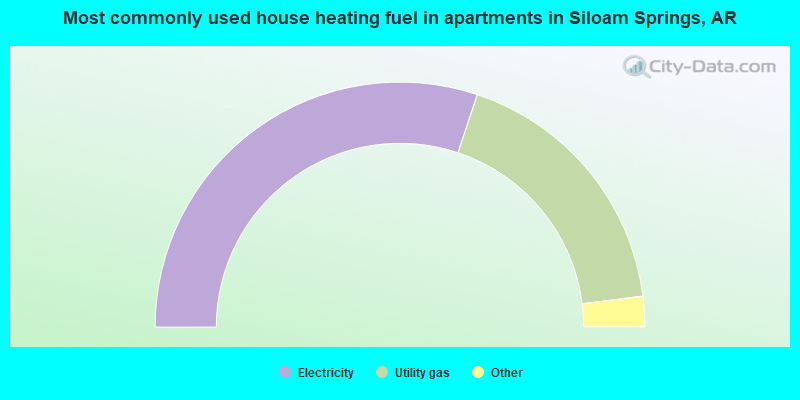
- 60.3%Electricity
- 35.8%Utility gas
- 2.3%Bottled, tank, or LP gas
- 1.6%No fuel used
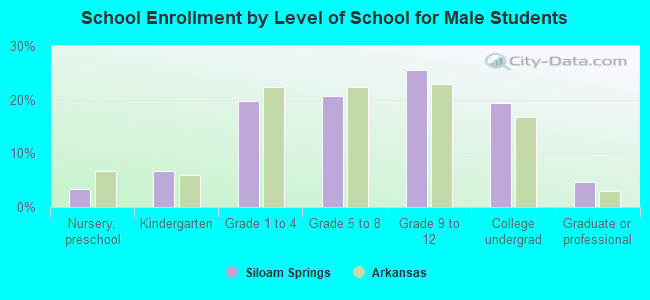
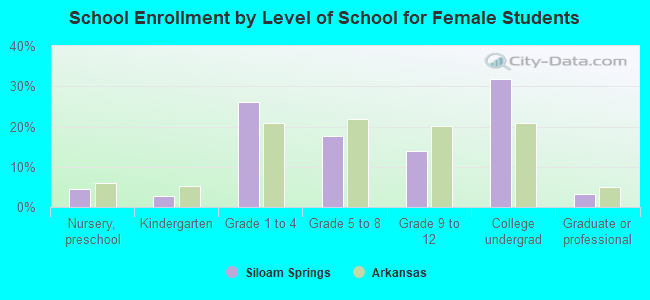
Private vs. public school enrollment:
| Here: | 5.7% |
| Arkansas: | 10.5% |
| Here: | 2.5% |
| Arkansas: | 8.7% |
| Here: | 68.7% |
| Arkansas: | 19.4% |