Seabrook, NH (New Hampshire) Houses and Residents
| Seabrook: | $429,310 |
| New Hampshire: | $384,700 |
Total population: 8,693 (Urban population: 7,828, Rural population: 106 (all nonfarm))
Houses: 4,066 (3,425 occupied: 2,155 owner occupied, 1,270 renter occupied)
| % of renters here: | 37% |
| State: | 28% |
Housing density: 459 houses/condos per square mile
Median price asked for vacant for-sale houses and condos in 2022 in this county: $227,726.
Median contract rent in 2022: $1,402 (lower quartile is $1,160, upper quartile is $1,738)
Median rent asked for vacant for-rent units in 2022: $1,442
Median gross rent in Seabrook, NH in 2022: $1,503
Housing units in Seabrook with a mortgage: 767 (62 second mortgage, 102 home equity loan, 0 both second mortgage and home equity loan)
Houses without a mortgage: 374
Compare current foreclosures near Seabrook, NH:
| Photo | Address | Area | Beds / Baths | Price | Details |
|---|---|---|---|---|---|

|
#1
Railroad Ave Apt 408
Seabrook, NH 03874
|
- sq. feet
|
- baths - beds |
show details | |

|
#2
Halls Way
Seabrook, NH 03874
|
- sq. feet
|
- baths - beds |
show details | |

|
#3
New Zealand Rd Apt 24
Seabrook, NH 03874
|
- sq. feet
|
- baths - beds |
show details | |

|
#4
Cedar St # A
Haverhill, MA 01830
|
1,134 sq. feet
|
2 baths 2 beds |
$209,300
|
show details |

|
#5
Brentwood Rd
Exeter, NH 03833
|
2,756 sq. feet
|
2 baths 3 beds |
$419,900
|
show details |

|
#6
Main St
Fremont, NH 03044
|
1,470 sq. feet
|
2 baths 4 beds |
$306,800
|
show details |

|
#7
Moores Ln
Seabrook, NH 03874
|
- sq. feet
|
- baths - beds |
show details | |

|
#8
Golden Hill Ave
Haverhill, MA 01830
|
2,016 sq. feet
|
1 baths 2 beds |
show details | |

|
#9
Lawrence Rd Apt 22
Rowley, MA 01969
|
720 sq. feet
|
1 baths 1 beds |
show details | |

|
#10
Boush St
Kittery, ME 03904
|
1,448 sq. feet
|
2 baths 4 beds |
show details |
| Photo | Address | Area | Beds / Baths | Price | Details |
|---|---|---|---|---|---|

|
#11
Silver St
Haverhill, MA 01832
|
2,248 sq. feet
|
1 baths 2 beds |
show details | |

|
#12
Main St # 2
Haverhill, MA 01830
|
772 sq. feet
|
1 baths 1 beds |
show details | |

|
#13
Acorn St
Haverhill, MA 01832
|
896 sq. feet
|
2 baths 2 beds |
show details | |

|
#14
Mount Vernon St
Haverhill, MA 01830
|
4,046 sq. feet
|
4 baths 6 beds |
show details | |

|
#15
Mill River Ln
Rowley, MA 01969
|
2,705 sq. feet
|
2 baths 4 beds |
show details | |

|
#16
Steeplechase Ct
Haverhill, MA 01832
|
1,442 sq. feet
|
2 baths 2 beds |
show details | |

|
#17
Sanborn Rd
East Kingston, NH 03827
|
3,002 sq. feet
|
2 baths 3 beds |
show details | |

|
#18
Brook Meadow Ln
Georgetown, MA 01833
|
2,147 sq. feet
|
3 baths 3 beds |
show details | |

|
#19
Millyard Unit 204
Amesbury, MA 01913
|
715 sq. feet
|
1 baths 1 beds |
show details | |

|
#20
S Lincoln St
Haverhill, MA 01835
|
2,700 sq. feet
|
2 baths 8 beds |
show details |
| Photo | Address | Area | Beds / Baths | Price | Details |
|---|---|---|---|---|---|

|
#21
W Parish Ln
Boxford, MA 01921
|
2,840 sq. feet
|
3 baths 3 beds |
show details | |

|
#22
N End Blvd
Salisbury, MA 01952
|
2,816 sq. feet
|
4 baths 10 beds |
show details | |

|
#23
Brown Ave # 2-52
Amesbury, MA 01913
|
638 sq. feet
|
1 baths 1 beds |
show details | |

|
#24
Lincoln Ave
Salisbury, MA 01952
|
1,120 sq. feet
|
1 baths 2 beds |
show details | |

|
#25
Water St
Haverhill, MA 01830
|
1,516 sq. feet
|
3 baths 3 beds |
show details | |

|
#26
Ccc Rd
Salisbury, MA 01952
|
2,016 sq. feet
|
3 baths 3 beds |
show details | |

|
#27
Laurel Hollow Rd
Boxford, MA 01921
|
5,207 sq. feet
|
5 baths 4 beds |
show details | |

|
#28
Elm St
Amesbury, MA 01913
|
1,608 sq. feet
|
2 baths 4 beds |
show details | |

|
#29
Main St
Plaistow, NH 03865
|
1,177 sq. feet
|
1 baths 3 beds |
show details | |

|
#30
Pike St
Salisbury, MA 01952
|
1,808 sq. feet
|
1 baths 3 beds |
show details |
| Photo | Address | Area | Beds / Baths | Price | Details |
|---|---|---|---|---|---|

|
#31
Rosemary Ln
Eliot, ME 03903
|
1,173 sq. feet
|
1 baths 4 beds |
show details | |

|
#32
Merrill Ave
Haverhill, MA 01830
|
2,416 sq. feet
|
2 baths 4 beds |
show details | |

|
#33
S Warren St
Haverhill, MA 01835
|
1,356 sq. feet
|
1 baths 3 beds |
show details | |

|
#34
S Webster St
Haverhill, MA 01835
|
978 sq. feet
|
1 baths 2 beds |
show details | |

|
#35
Merrill Ave
Haverhill, MA 01830
|
1,150 sq. feet
|
1 baths 3 beds |
show details | |

|
#36
Lawrence Rd Un 22
Rowley, MA 01969
|
720 sq. feet
|
1 baths 1 beds |
show details | |

|
#37
Boardman St
Haverhill, MA 01830
|
1,092 sq. feet
|
2 baths 3 beds |
show details | |

|
#38
Bailey Ln
Georgetown, MA 01833
|
2,743 sq. feet
|
2 baths 4 beds |
show details | |

|
#39
Cedar St
Haverhill, MA 01830
|
2,162 sq. feet
|
2 baths 3 beds |
show details | |

|
#40
Primrose St
Haverhill, MA 01830
|
2,680 sq. feet
|
2 baths 4 beds |
show details |
| Photo | Address | Area | Beds / Baths | Price | Details |
|---|---|---|---|---|---|

|
#41
Webster St
Haverhill, MA 01830
|
1,887 sq. feet
|
2 baths 3 beds |
show details | |

|
#42
15th Ave
Haverhill, MA 01830
|
1,320 sq. feet
|
1 baths 3 beds |
show details | |

|
#43
Came Ave
Haverhill, MA 01830
|
1,890 sq. feet
|
1 baths 3 beds |
show details | |

|
#44
Kenoza Ave Apt 1
Haverhill, MA 01830
|
750 sq. feet
|
1 baths 2 beds |
show details | |

|
#45
Bunker Hill Rd
Ipswich, MA 01938
|
2,896 sq. feet
|
2 baths 3 beds |
show details | |

|
#46
Mile Ln
Ipswich, MA 01938
|
2,240 sq. feet
|
2 baths 3 beds |
show details | |

|
#47
Regent Ave
Haverhill, MA 01835
|
1,232 sq. feet
|
1 baths 3 beds |
show details | |

|
#48
Hazen Ave
Haverhill, MA 01830
|
2,594 sq. feet
|
2 baths 7 beds |
show details | |

|
#49
Sheridan St
Haverhill, MA 01830
|
1,365 sq. feet
|
1 baths 4 beds |
show details | |

|
Check over 1 million property listings on Foreclosure.com!
|
browse all offers | |||
Latest news about housing in Seabrook, NH collected exclusively by city-data.com from local newspapers, TV, and radio stations

 | Whole House Well Water Filtration (Arsenic) (17 replies) |
| Around 95 up to Portsmouth - Looking to buy a house in good school district 475k (11 replies) |
| Free State Project (37 replies) |
| Moving to southeast NH, looking for suggestions (22 replies) |
| Well NH, its been nice but (85 replies) |
| First visit to NH (28 replies) |

Household type by relationship:
Households: 292,725- In family households: 247,693 (57,848 male householders, 21,984 female householders)
64,858 spouses, 85,601 children (80,134 natural, 2,077 adopted, 3,390 stepchildren), 3,954 grandchildren, 1,562 brothers or sisters, 2,352 parents, foster children, 1,664 other relatives, 5,842 non-relatives
- In nonfamily households: 45,032 (17,024 male householders (12,402 living alone)), 18,177 female householders (14,574 living alone)), 9,831 nonrelatives
- In group quarters: 2,498 (1,438 institutionalized population)
57,723 married couples with children.
11,266 single-parent households (3,032 men, 8,234 women).
94.5% of residents of Seabrook speak English at home.
1.1% of residents speak Spanish at home (91% speak English very well, 9% speak English well).
4.1% of residents speak other Indo-European language at home (85% speak English very well, 8% speak English well, 7% speak English not well).
0.1% of residents speak Asian or Pacific Island language at home (100% speak English well).
0.2% of residents speak other language at home (100% speak English very well).
Foreign born population: 301 (3.3%)
(64.5% of them are naturalized citizens)
| Here: | 5.4 |
| State: | 6.4 |
| Here: | 3.8 |
| State: | 4.0 |

- Bedrooms in owner-occupied houses and condos in Seabrook, New Hampshire
- 8no bedroom
- 721 bedroom
- 8502 bedrooms
- 8513 bedrooms
- 2564 bedrooms
- 1185+ bedrooms

- Bedrooms in renter-occupied apartments in Seabrook, New Hampshire
- 21no bedroom
- 2011 bedroom
- 8042 bedrooms
- 2383 bedrooms
- 64 bedrooms
- 05+ bedrooms

- Cars and other vehicles available in Seabrook in owner-occupied houses/condos
- 121no vehicle
- 6461 vehicle
- 9352 vehicles
- 3853 vehicles
- 524 vehicles
- 165+ vehicles

- Cars and other vehicles available in Seabrook in renter-occupied apartments
- 89no vehicle
- 5991 vehicle
- 5082 vehicles
- 573 vehicles
- 74 vehicles
- 105+ vehicles

- Rooms in owner-occupied houses in Seabrook, New Hampshire
- 81 room
- 02 rooms
- 573 rooms
- 5014 rooms
- 5855 rooms
- 3606 rooms
- 2907 rooms
- 1408 rooms
- 2149+ rooms

- Rooms in renter-occupied apartments in Seabrook, New Hampshire
- 101 room
- 222 rooms
- 1653 rooms
- 7154 rooms
- 1645 rooms
- 1716 rooms
- 177 rooms
- 68 rooms
- 09+ rooms


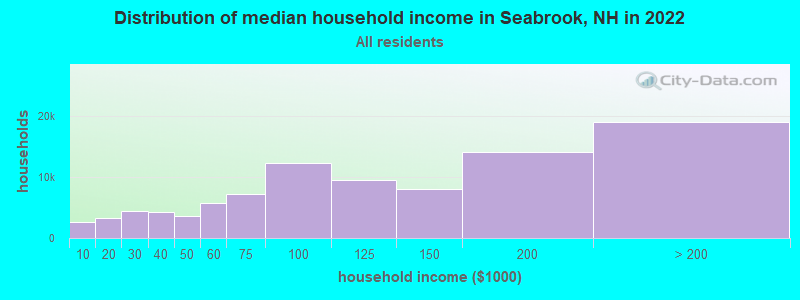
Seabrook, NH household income distribution

- 2,616Less than $10,000
- 3,217$10,000 to $19,999
- 4,486$20,000 to $29,999
- 4,220$30,000 to $39,999
- 3,593$40,000 to $49,999
- 5,777$50,000 to $59,999
- 7,239$60,000 to $74,999
- 12,196$75,000 to $99,999
- 9,418$100,000 to $124,999
- 8,006$125,000 to $149,999
- 14,096$150,000 to $199,999
- 18,986$200,000 or more
Percentage of workers working in this county: 66.5%
Number of people working at home: 1,044 (20.6% of all workers)
Travel time to work (commute)
- Less than 5 minutes: 268
- 5 to 9 minutes: 729
- 10 to 14 minutes: 645
- 15 to 19 minutes: 607
- 20 to 24 minutes: 452
- 25 to 29 minutes: 183
- 30 to 34 minutes: 551
- 35 to 39 minutes: 150
- 40 to 44 minutes: 90
- 45 to 59 minutes: 238
- 60 to 89 minutes: 180
- 90 or more minutes: 117
Means of transportation to work:
- Drove a car alone: 3,520 (81.3%)
- Carpooled: 429 (9.9%)
- Bus or trolley bus: 20 (0.5%)
- Streetcar or trolley car: 24 (0.6%)
- Railroad: 29 (0.7%)
- Taxi: 5 (0.1%)
- Walked: 145 (3.3%)
- Other means: 38 (0.9%)
- Worked at home: 120 (2.8%)


- Year of entry for the foreign-born population in Seabrook, New Hampshire
- 461995 to March 2000
- 101990 to 1994
- 121985 to 1989
- 151980 to 1984
- 271975 to 1979
- 01970 to 1974
- 01965 to 1969
- 74Before 1965
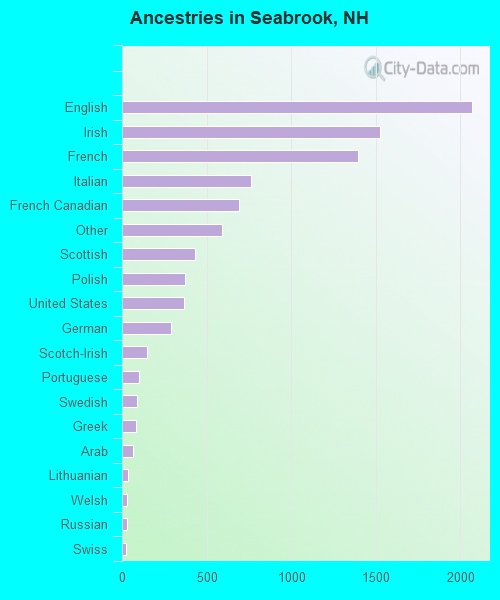
First ancestries reported:
- English: 2,068 (22.5%)
- Irish: 1,529 (16.6%)
- French: 1,399 (15.2%)
- Italian: 766 (8.3%)
- French Canadian: 692 (7.5%)
- Other: 589 (6.4%)
- Scottish: 431 (4.7%)
- Polish: 372 (4.0%)
- United States: 368 (4.0%)
- German: 291 (3.2%)
- Scotch-Irish: 150 (1.6%)
- Portuguese: 101 (1.1%)
- Swedish: 87 (0.9%)
- Greek: 84 (0.9%)
- Arab: 63 (0.7%)
- Lithuanian: 36 (0.4%)
- Welsh: 32 (0.3%)
- Russian: 27 (0.3%)
- Swiss: 26 (0.3%)
- Dutch: 16 (0.2%)
- Hungarian: 15 (0.2%)
- Danish: 14 (0.2%)
- Ukrainian: 14 (0.2%)
- Czech: 7 (0.08%)
- Norwegian: 7 (0.08%)
- West Indian: 6 (0.07%)
Most common places of birth for foreign-born residents (%):
| Seabrook: | 37.0% (68) |
| New Hampshire: | 22.9% (12,397) |
| Seabrook: | 15.2% (28) |
| New Hampshire: | 4.9% (2,670) |
| Seabrook: | 7.6% (14) |
| New Hampshire: | 8.1% (4,396) |
| Seabrook: | 6.5% (12) |
| New Hampshire: | 1.5% (835) |
| Seabrook: | 5.4% (10) |
| New Hampshire: | 2.7% (1,440) |
| Seabrook: | 4.9% (9) |
| New Hampshire: | 2.9% (1,582) |
| Seabrook: | 4.9% (9) |
| New Hampshire: | 2.0% (1,103) |
| Seabrook: | 4.3% (8) |
| New Hampshire: | 0.9% (471) |
| Seabrook: | 3.8% (7) |
| New Hampshire: | 0.5% (250) |
| Seabrook: | 3.8% (7) |
| New Hampshire: | 0.3% (188) |
| Seabrook: | 3.3% (6) |
| New Hampshire: | 0.5% (290) |
| Seabrook: | 3.3% (6) |
| New Hampshire: | 0.5% (266) |
Place of birth for U.S.-born residents:
- This state: 1,798
- Other state: 5,907
- Northeast: 5,544
- Midwest: 161
- South: 101
- West: 101
59% of Seabrook residents lived in the same house 5 years ago.
Out of people who lived in different houses, 41% lived in this county.
Out of people who lived in different counties, 11% lived in New Hampshire.
Education attainment for males 25 years and older:
- No schooling: 0
- Nursery to 4th grade: 0
- 5th and 6th grade: 22
- 7th and 8th grade: 134
- 9th grade: 124
- 10th grade: 137
- 11th grade: 99
- 12th grade, no diploma: 116
- High school graduate (or equivalency): 1,101
- Less than 1 year of college: 234
- Some college more than 1 year, no degree: 302
- Associate degree: 203
- Bachelor's degree: 333
- Master's degree: 43
- Professional school degree: 22
- Doctorate degree: 7

Education attainment for females 25 years and older:
- No schooling: 0
- Nursery to 4th grade: 0
- 5th and 6th grade: 0
- 7th and 8th grade: 174
- 9th grade: 77
- 10th grade: 106
- 11th grade: 111
- 12th grade, no diploma: 161
- High school graduate (or equivalency): 1,063
- Less than 1 year of college: 248
- Some college more than 1 year, no degree: 301
- Associate degree: 239
- Bachelor's degree: 315
- Master's degree: 129
- Professional school degree: 8
- Doctorate degree: 0


Housing units in structures:
- One, detached: 1,617
- One, attached: 142
- Two: 333
- 3 or 4: 91
- 5 to 9: 115
- 10 to 19: 140
- 20 to 49: 299
- 50 or more: 280
- Mobile homes: 1,038
- Boats, RVs, vans, etc.: 11
Median worth of mobile homes: $211,893
Housing units lacking complete kitchen facilities: 0.4%


- 55.0%Fuel oil, kerosene, etc.
- 35.7%Utility gas
- 4.5%Bottled, tank, or LP gas
- 4.1%Electricity
- 0.6%Wood
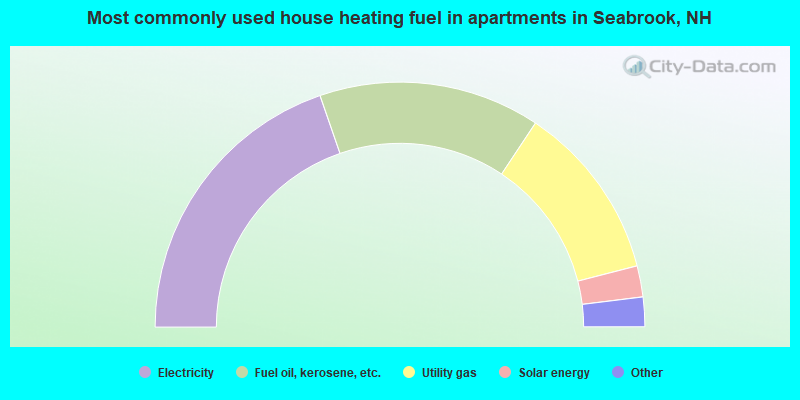
- 39.4%Electricity
- 29.2%Fuel oil, kerosene, etc.
- 23.3%Utility gas
- 4.1%Solar energy
- 1.7%Bottled, tank, or LP gas
- 1.4%Other fuel
- 0.8%Wood
Private vs. public school enrollment:
| Here: | 7.9% |
| New Hampshire: | 8.9% |
| Here: | 7.9% |
| New Hampshire: | 10.7% |
| Here: | 40.8% |
| New Hampshire: | 36.4% |


