Sartell, MN (Minnesota) Houses and Residents
| Sartell: | $290,932 |
| Minnesota: | $314,600 |
Mean price in 2022:
Detached houses: $354,119
Here: $354,119 State: $374,552 Townhouses or other attached units: $219,507
Here: $219,507 State: $312,049 Mobile homes: $34,348
Here: $34,348 State: $94,605
Total population: 16,523 (Urban population: 9,399, Rural population: 58 (all nonfarm))
Houses: 7,752 (7,599 occupied: 4,446 owner occupied, 3,283 renter occupied)
| % of renters here: | 42% |
| State: | 28% |
Housing density: 1,314 houses/condos per square mile
Median price asked for vacant for-sale houses and condos in 2022 in this county: $304,448.
Median contract rent in 2022: $1,114 (lower quartile is $834, upper quartile is $1,440)
Median gross rent in Sartell, MN in 2022: $1,122
Housing units in Sartell with a mortgage: 3,222 (264 second mortgage, 12 home equity loan, 210 both second mortgage and home equity loan)
Houses without a mortgage: 63
Median household income for houses/condos with a mortgage: $118,482
Median household income for apartments without a mortgage: $65,022
Median monthly housing costs: $1,372
Compare current foreclosures in Sartell, MN:
| Photo | Address | Area | Beds / Baths | Price | Details |
|---|---|---|---|---|---|

|
#1
4th Ave N
Sartell, MN 56377
|
1,435 sq. feet
|
1 baths 2 beds |
show details | |

|
#2
4th St N
Sartell, MN 56377
|
1,616 sq. feet
|
2 baths 4 beds |
show details | |

|
#3
County Road 1
Sartell, MN 56377
|
1,615 sq. feet
|
1 baths 2 beds |
show details | |

|
#4
4th Ave E
Sartell, MN 56377
|
904 sq. feet
|
1 baths 2 beds |
show details | |

|
#5
4th Ave N
Sartell, MN 56377
|
1,405 sq. feet
|
2 baths 3 beds |
show details | |

|
#6
7th Ave N
Sartell, MN 56377
|
1,382 sq. feet
|
2 baths 3 beds |
show details | |

|
#7
5th Ave S
Sartell, MN 56377
|
1,421 sq. feet
|
2 baths 3 beds |
show details | |

|
#8
386th St
Sartell, MN 56377
|
1,920 sq. feet
|
2 baths 4 beds |
show details | |

|
#9
5th Ave N
Sartell, MN 56377
|
1,872 sq. feet
|
2 baths 2 beds |
show details | |

|
#10
20th Ave N
Sartell, MN 56377
|
2,083 sq. feet
|
2 baths 4 beds |
show details |
| Photo | Address | Area | Beds / Baths | Price | Details |
|---|---|---|---|---|---|

|
#11
Glacier Ave
Sartell, MN 56377
|
1,403 sq. feet
|
2 baths 4 beds |
show details | |

|
#12
4th St N
Sartell, MN 56377
|
1,778 sq. feet
|
2 baths 4 beds |
show details | |

|
#13
20th Ave N
Sartell, MN 56377
|
2,052 sq. feet
|
3 baths 4 beds |
show details | |

|
#14
4th Ave N
Sartell, MN 56377
|
1,768 sq. feet
|
2 baths 4 beds |
show details | |

|
#15
Riverside Ave N
Sartell, MN 56377
|
- sq. feet
|
- baths - beds |
show details | |

|
#16
Krutchen Court South
Sartell, MN 56377
|
- sq. feet
|
- baths - beds |
show details | |

|
#17
7th Ave S Apt 112
Sartell, MN 56377
|
- sq. feet
|
- baths - beds |
show details | |

|
#18
10th Ave N Apt 105
Sartell, MN 56377
|
- sq. feet
|
- baths - beds |
show details | |

|
#19
Mockingbird Loop
Sartell, MN 56377
|
- sq. feet
|
- baths - beds |
show details | |

|
#20
Waterford Ave N
Sartell, MN 56377
|
- sq. feet
|
- baths - beds |
show details |
| Photo | Address | Area | Beds / Baths | Price | Details |
|---|---|---|---|---|---|

|
#21
Hi Vue Dr
Sartell, MN 56377
|
- sq. feet
|
- baths - beds |
show details | |

|
#22
7th Ave S
Sartell, MN 56377
|
- sq. feet
|
- baths - beds |
show details | |

|
#23
Sunburst Ave
Sartell, MN 56377
|
- sq. feet
|
- baths - beds |
show details | |

|
#24
7th St N Apt 68
Sartell, MN 56377
|
- sq. feet
|
- baths - beds |
show details | |

|
#25
Sunset Ave
Sartell, MN 56377
|
- sq. feet
|
- baths - beds |
show details | |

|
#26
7th Ave S Apt 201
Sartell, MN 56377
|
- sq. feet
|
- baths - beds |
show details | |

|
#27
7th St N Apt 32
Sartell, MN 56377
|
- sq. feet
|
- baths - beds |
show details | |

|
#28
Victory Ave
Sartell, MN 56377
|
- sq. feet
|
- baths - beds |
show details | |

|
#29
7th St N Apt 35
Sartell, MN 56377
|
- sq. feet
|
- baths - beds |
show details | |

|
#30
7th St N Apt 24
Sartell, MN 56377
|
- sq. feet
|
- baths - beds |
show details |
| Photo | Address | Area | Beds / Baths | Price | Details |
|---|---|---|---|---|---|

|
#31
3rd St S Apt 202
Sartell, MN 56377
|
- sq. feet
|
- baths - beds |
show details | |

|
#32
22nd St S Apt 202
Sartell, MN 56377
|
- sq. feet
|
- baths - beds |
show details | |

|
Check over 1 million property listings on Foreclosure.com!
|
browse all offers | |||

Latest news about housing in Sartell, MN collected exclusively by city-data.com from local newspapers, TV, and radio stations

 | Houses For Rent? (4 replies) |
| How are the house rentals and foreclosures in Saint Cloud? (5 replies) |
| Suggestions for places to live that aren't St. Cloud needed (29 replies) |
| Where to live(St Cloud area)? (5 replies) |
| St. Cloud area, looking to rent, maybe rent-to-buy (10 replies) |
| considering move to St. Cloud/ Sartell (33 replies) |

Median year apartment built: 2004
Household type by relationship:
Households: 19,599- Male householders: 3,500 (671 living alone), Female householders: 4,088 (1,614 living alone)
3,552 spouses (3,552 opposite-sex spouses), 906 unmarried partners, (855 opposite-sex unmarried partners), 6,576 children (6,313 natural, 46 adopted, 216 stepchildren), 32 grandchildren, 30 brothers or sisters, 36 parents, 0 foster children, 20 other relatives, 633 non-relatives
- In group quarters: 223
Size of family households: 1,761 2-persons, 915 3-persons, 925 4-persons, 654 5-persons, 69 6-persons, 17 7-or-more-persons.
Size of nonfamily households: 2,438 1-person, 743 2-persons, 18 3-persons, 49 4-persons, 69 6-persons.
3,655 married couples with children.
1,630 single-parent households (488 men, 1,142 women).
94.2% of residents of Sartell speak English at home.
0.7% of residents speak Spanish at home (80% speak English very well, 20% speak English not well).
1.0% of residents speak other Indo-European language at home (100% speak English very well).
1.9% of residents speak Asian or Pacific Island language at home (61% speak English very well, 26% speak English well, 12% speak English not well).
2.0% of residents speak other language at home (84% speak English very well, 7% speak English well, 9% speak English not well).
Foreign born population: 1,092 (5.6%)
(63.2% of them are naturalized citizens)
| Here: | 7.5 |
| State: | 7.1 |
| Here: | 3.6 |
| State: | 3.8 |
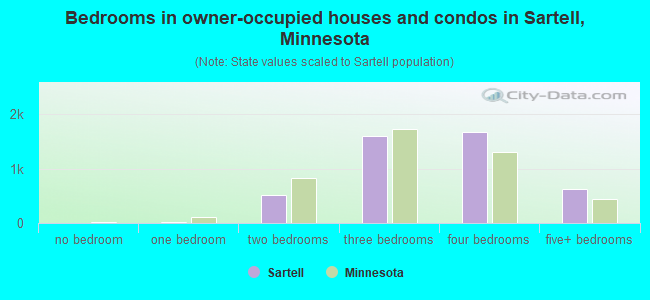
- Bedrooms in owner-occupied houses and condos in Sartell, Minnesota
- 0no bedroom
- 151 bedroom
- 5202 bedrooms
- 1,5993 bedrooms
- 1,6804 bedrooms
- 6325+ bedrooms
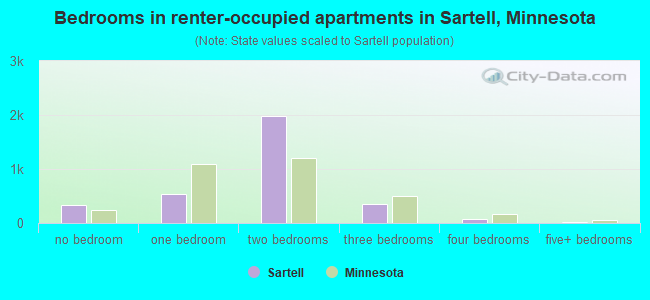
- Bedrooms in renter-occupied apartments in Sartell, Minnesota
- 339no bedroom
- 5361 bedroom
- 1,9892 bedrooms
- 3433 bedrooms
- 674 bedrooms
- 105+ bedrooms
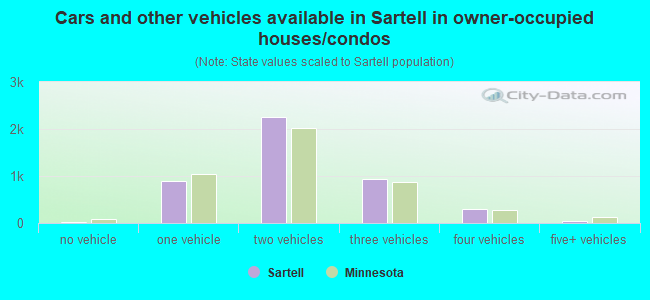
- Cars and other vehicles available in Sartell in owner-occupied houses/condos
- 29no vehicle
- 8891 vehicle
- 2,2612 vehicles
- 9453 vehicles
- 2924 vehicles
- 325+ vehicles
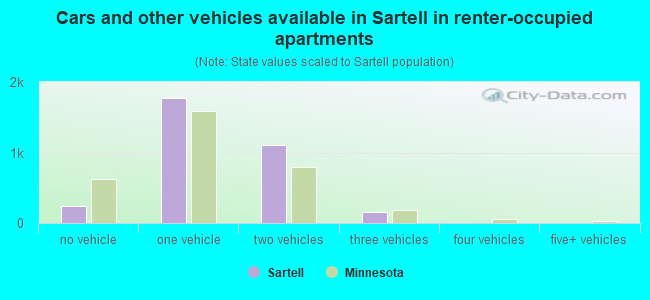
- Cars and other vehicles available in Sartell in renter-occupied apartments
- 241no vehicle
- 1,7731 vehicle
- 1,1112 vehicles
- 1593 vehicles
- 04 vehicles
- 05+ vehicles
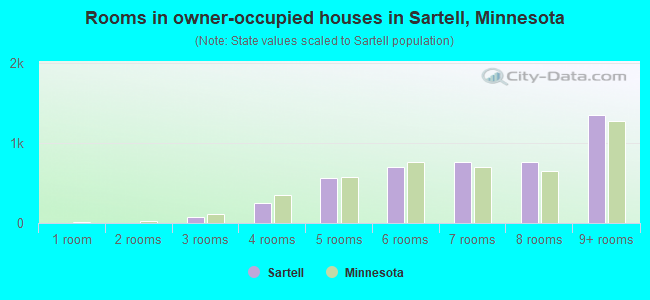
- Rooms in owner-occupied houses in Sartell, Minnesota
- 01 room
- 02 rooms
- 723 rooms
- 2524 rooms
- 5575 rooms
- 7006 rooms
- 7557 rooms
- 7628 rooms
- 1,3479+ rooms
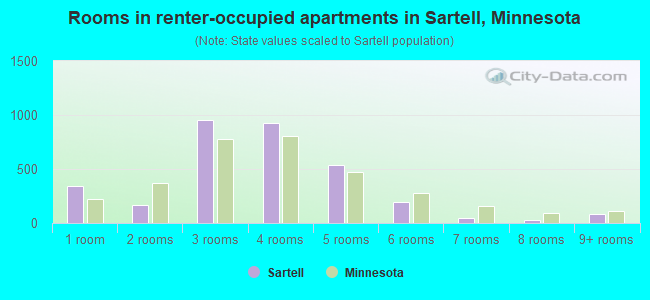
- Rooms in renter-occupied apartments in Sartell, Minnesota
- 3391 room
- 1682 rooms
- 9543 rooms
- 9294 rooms
- 5405 rooms
- 1936 rooms
- 497 rooms
- 328 rooms
- 809+ rooms
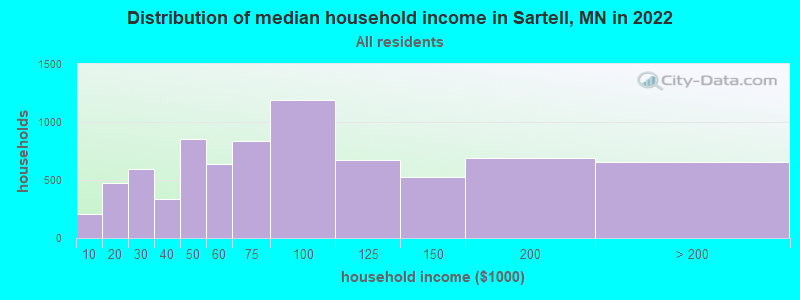
Sartell, MN household income distribution

- 211Less than $10,000
- 477$10,000 to $19,999
- 596$20,000 to $29,999
- 336$30,000 to $39,999
- 850$40,000 to $49,999
- 642$50,000 to $59,999
- 834$60,000 to $74,999
- 1,188$75,000 to $99,999
- 674$100,000 to $124,999
- 524$125,000 to $149,999
- 692$150,000 to $199,999
- 656$200,000 or more
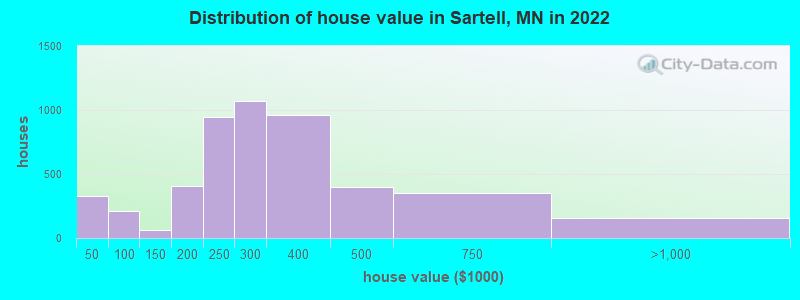
Home value of owner - occupied houses in 2022 in Sartell, MN
-
- 28Less than $10,000
- 15$10,000 to $14,999
- 135$15,000 to $19,999
- 25$20,000 to $24,999
- 20$25,000 to $29,999
- 10$35,000 to $39,999
- 92$40,000 to $49,999
- 16$50,000 to $59,999
- 49$60,000 to $69,999
- 27$70,000 to $79,999
- 22$90,000 to $99,999
- 20$100,000 to $124,999
- 39$125,000 to $149,999
- 227$150,000 to $174,999
- 178$175,000 to $199,999
- 942$200,000 to $249,999
- 1,069$250,000 to $299,999
- 960$300,000 to $399,999
- 401$400,000 to $499,999
- 347$500,000 to $749,999
- 150$750,000 to $999,999
- 2$1,000,000 to $1,499,999
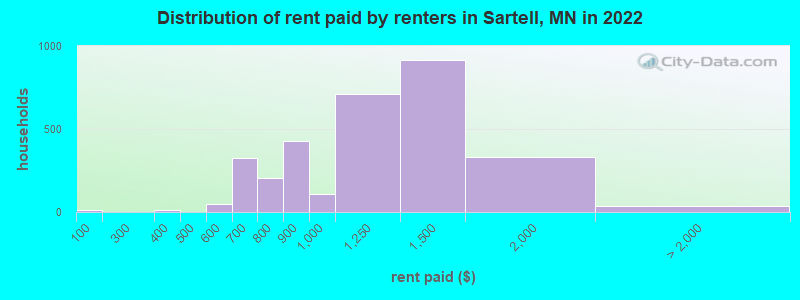
Rent paid by renters in 2022 in Sartell, MN
-
- 11Less than $100
- 10$300 to $349
- 34$500 to $549
- 13$550 to $599
- 225$600 to $649
- 99$650 to $699
- 164$700 to $749
- 37$750 to $799
- 425$800 to $899
- 108$900 to $999
- 710$1,000 to $1,249
- 917$1,250 to $1,499
- 330$1,500 to $1,999
- 8$2,000 to $2,499
- 26No cash rent
Percentage of workers working in this county: 72.5%
Number of people working at home: 1,179 (11.6% of all workers)
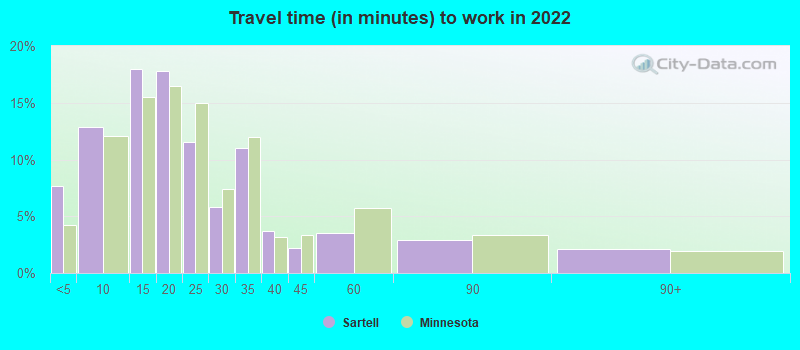
Travel time to work (commute)
- Less than 5 minutes: 289
- 5 to 9 minutes: 891
- 10 to 14 minutes: 2,254
- 15 to 19 minutes: 2,011
- 20 to 24 minutes: 1,476
- 25 to 29 minutes: 489
- 30 to 34 minutes: 291
- 35 to 39 minutes: 224
- 40 to 44 minutes: 106
- 45 to 59 minutes: 408
- 60 to 89 minutes: 176
- 90 or more minutes: 568
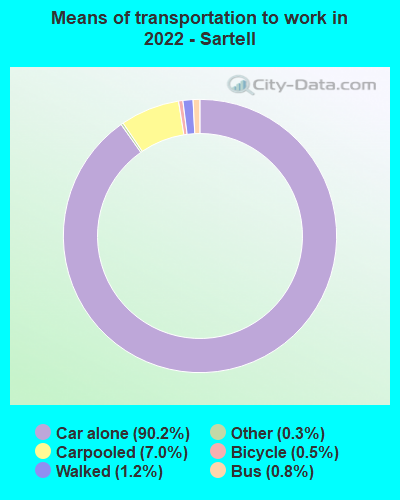
Means of transportation to work:
- Drove a car alone: 4,289 (74.8%)
- Carpooled: 272 (4.7%)
- Bus: 36 (0.6%)
- Taxi: 17 (0.3%)
- Bicycle: 30 (0.5%)
- Walked: 59 (1.0%)
- Worked at home: 1,179 (20.6%)
- Unemployment by race in 2022
- Unemployment rate for White non-Hispanic residents
- 2.6%Males
- 1.6%Females
- Unemployment rate for Black residents
- 5.3%Males
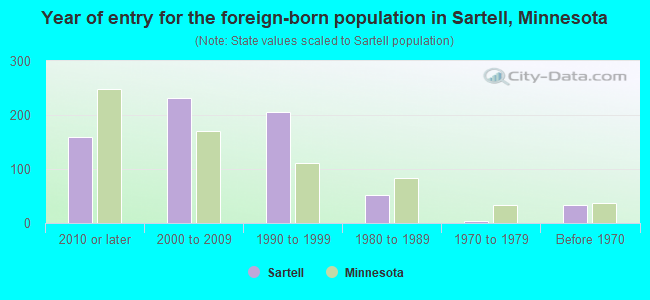
- Year of entry for the foreign-born population in Sartell, Minnesota
- 1592010 or later
- 2322000 to 2009
- 2051990 to 1999
- 511980 to 1989
- 41970 to 1979
- 33Before 1970
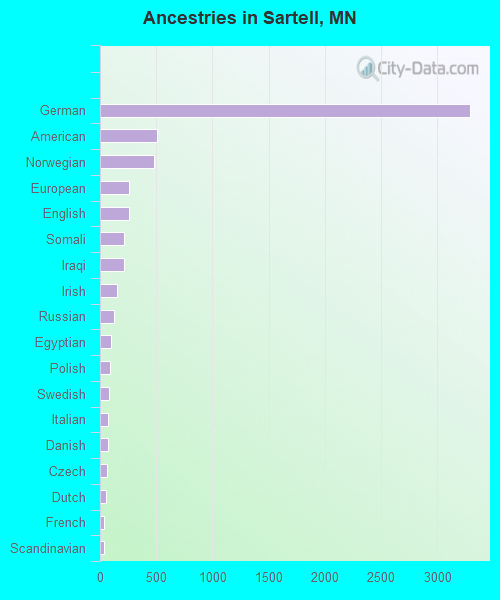
First ancestries reported:
- German: 3,297 (48.1%)
- American: 511 (7.4%)
- Norwegian: 483 (7.0%)
- European: 262 (3.8%)
- English: 257 (3.7%)
- Somali: 213 (3.1%)
- Iraqi: 211 (3.1%)
- Irish: 148 (2.2%)
- Russian: 123 (1.8%)
- Egyptian: 95 (1.4%)
- Polish: 88 (1.3%)
- Swedish: 77 (1.1%)
- Italian: 75 (1.1%)
- Danish: 71 (1.0%)
- Czech: 58 (0.8%)
- Dutch: 55 (0.8%)
- French: 40 (0.6%)
- Scandinavian: 35 (0.5%)
- Finnish: 28 (0.4%)
- Iranian: 23 (0.3%)
- Lithuanian: 21 (0.3%)
- Eastern European: 20 (0.3%)
- Hungarian: 20 (0.3%)
- French Canadian: 17 (0.2%)
- African: 16 (0.2%)
- Maltese: 15 (0.2%)
- Austrian: 10 (0.1%)
- Latvian: 9 (0.1%)
- Northern European: 8 (0.1%)
- Slovene: 8 (0.1%)
- Ukrainian: 5 (0.07%)
Most common places of birth for foreign-born residents (%):
| Sartell: | 14.5% (120) |
| Minnesota: | 3.3% (15,701) |
| Sartell: | 13.5% (111) |
| Minnesota: | 0.5% (2,283) |
| Sartell: | 11.8% (97) |
| Minnesota: | 3.6% (17,119) |
| Sartell: | 11.8% (97) |
| Minnesota: | 8.0% (38,461) |
| Sartell: | 7.9% (65) |
| Minnesota: | 0.6% (2,929) |
| Sartell: | 5.6% (46) |
| Minnesota: | 3.8% (18,442) |
| Sartell: | 5.2% (43) |
| Minnesota: | 0.5% (2,357) |
| Sartell: | 4.8% (40) |
| Minnesota: | 2.0% (9,850) |
| Sartell: | 4.5% (37) |
| Minnesota: | 6.7% (32,141) |
| Sartell: | 3.6% (30) |
| Minnesota: | 12.1% (58,312) |
| Sartell: | 3.2% (26) |
| Minnesota: | 0.4% (2,035) |
| Sartell: | 2.8% (23) |
| Minnesota: | 0.1% (522) |
| Sartell: | 2.7% (22) |
| Minnesota: | 1.3% (6,329) |
| Sartell: | 2.3% (19) |
| Minnesota: | 0.5% (2,345) |
| Sartell: | 2.1% (17) |
| Minnesota: | 2.4% (11,675) |
| Sartell: | 1.9% (16) |
| Minnesota: | 0.1% (300) |
| Sartell: | 1.8% (15) |
| Minnesota: | 0.0% (63) |
| Sartell: | 1.7% (14) |
| Minnesota: | 0.2% (914) |
| Sartell: | 1.7% (14) |
| Minnesota: | 1.4% (6,670) |
Place of birth for U.S.-born residents:
- This state: 15,363
- Other state: 2,866
- Northeast: 175
- Midwest: 2,173
- South: 186
- West: 397
87.1% of Sartell residents lived in the same house 1 years ago.
Out of people who lived in different houses, 36.5% lived in this county.
Out of people who lived in different counties, 94.3% lived in Minnesota.
| Sartell: | 87.1% |
| State average: | 87.4% |
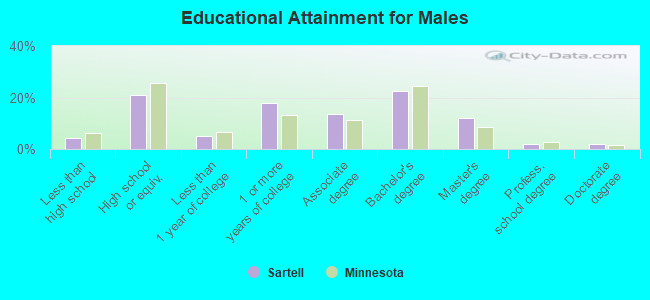
Education attainment for males 25 years and older:
- No schooling: 55
- Nursery to 4th grade: 1
- 5th and 6th grade: 0
- 7th and 8th grade: 52
- 9th grade: 63
- 10th grade: 30
- 11th grade: 21
- 12th grade, no diploma: 0
- High school graduate (or equivalency): 1,114
- Less than 1 year of college: 273
- Some college more than 1 year, no degree: 947
- Associate degree: 733
- Bachelor's degree: 1,208
- Master's degree: 649
- Professional school degree: 101
- Doctorate degree: 104
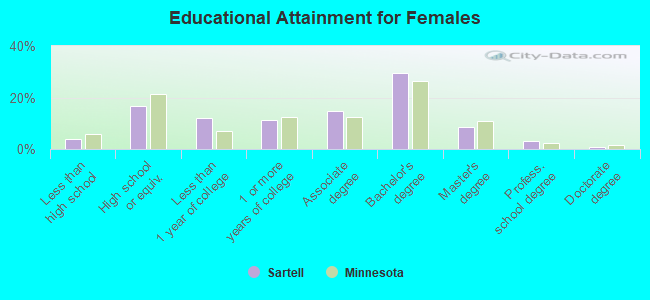
Education attainment for females 25 years and older:
- No schooling: 54
- Nursery to 4th grade: 0
- 5th and 6th grade: 0
- 7th and 8th grade: 22
- 9th grade: 10
- 10th grade: 69
- 11th grade: 85
- 12th grade, no diploma: 0
- High school graduate (or equivalency): 1,053
- Less than 1 year of college: 745
- Some college more than 1 year, no degree: 696
- Associate degree: 932
- Bachelor's degree: 1,840
- Master's degree: 531
- Professional school degree: 190
- Doctorate degree: 37


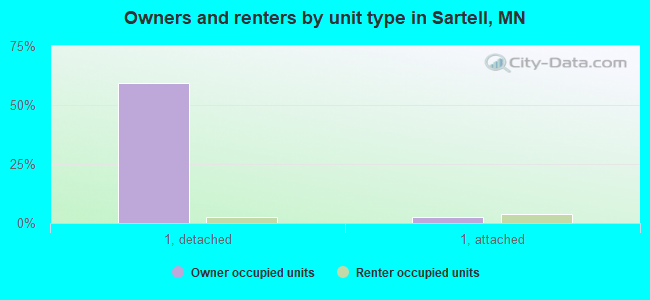
Housing units in structures:
- One, detached: 4,380
- One, attached: 513
- Two: 6
- 3 or 4: 83
- 5 to 9: 18
- 10 to 19: 304
- 20 to 49: 839
- 50 or more: 1,386
- Mobile homes: 221
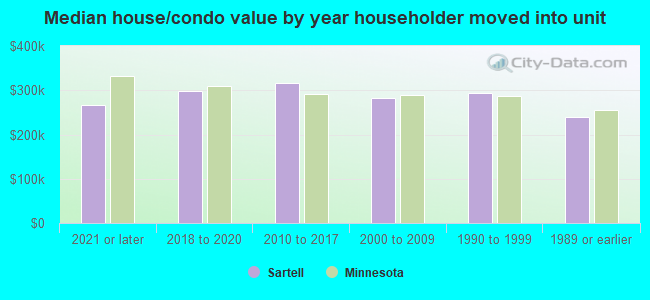
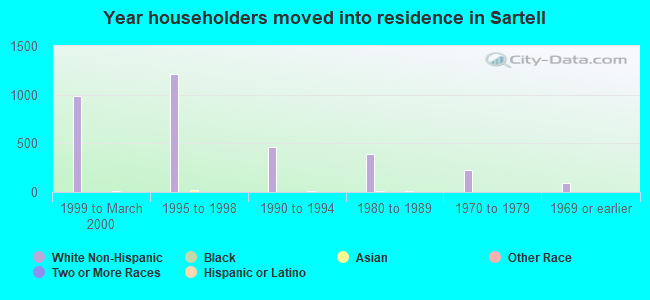
House/condo owner moved in on average 7 years ago
Renter moved in on average 3 years ago
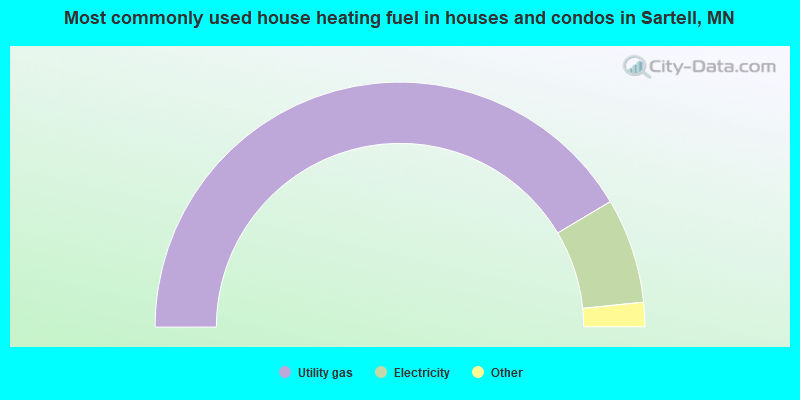
- 82.9%Utility gas
- 13.9%Electricity
- 1.3%Bottled, tank, or LP gas
- 1.3%Fuel oil, kerosene, etc.
- 0.5%Wood
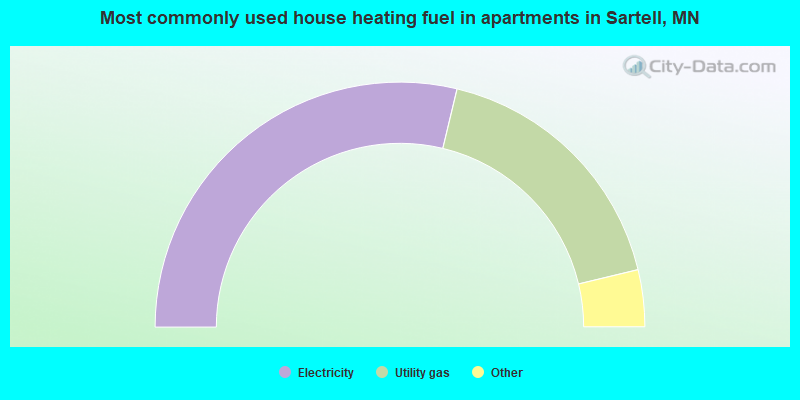
- 57.5%Electricity
- 35.0%Utility gas
- 2.9%Bottled, tank, or LP gas
- 2.5%Other fuel
- 1.5%No fuel used
- 0.6%Fuel oil, kerosene, etc.
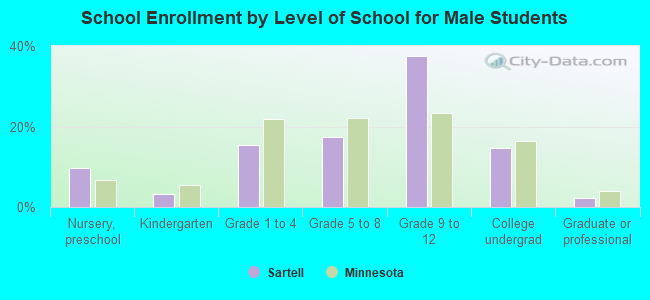
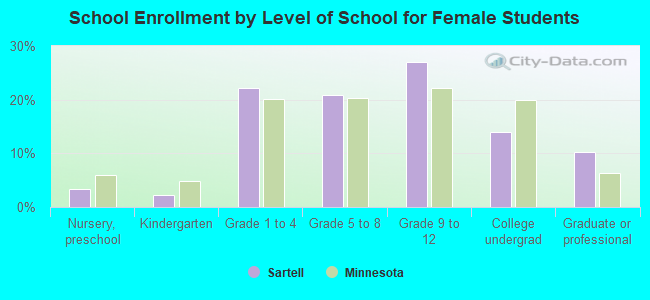
Private vs. public school enrollment:
| Here: | 4.5% |
| Minnesota: | 12.9% |
| Here: | 17.1% |
| Minnesota: | 8.6% |
| Here: | 16.1% |
| Minnesota: | 26.2% |