Saline, MI (Michigan) Houses and Residents
| Saline: | $327,630 |
| Michigan: | $224,400 |
Mean price in 2022:
Detached houses: $376,409
Here: $376,409 State: $280,038 Townhouses or other attached units: $222,660
Here: $222,660 State: $239,520 In 5-or-more-unit structures: $164,109
Here: $164,109 State: $192,733 Mobile homes: $30,871
Here: $30,871 State: $72,868
Total population: 9,158 (Urban population: 8,035, Rural population: 0)
Houses: 4,009 (3,788 occupied: 2,702 owner occupied, 1,091 renter occupied)
| % of renters here: | 29% |
| State: | 27% |
Housing density: 866 houses/condos per square mile
Median price asked for vacant for-sale houses and condos in 2022 in this county: $89,989.
Median contract rent in 2022: $918 (lower quartile is $674, upper quartile is $1,216)
Median rent asked for vacant for-rent units in 2022: $1,183
Median gross rent in Saline, MI in 2022: $1,067
Housing units in Saline with a mortgage: 1,848 (268 second mortgage, 0 home equity loan, 259 both second mortgage and home equity loan)
Houses without a mortgage: 21
Median household income for houses/condos with a mortgage: $102,536
Median household income for apartments without a mortgage: $90,715
Median monthly housing costs: $1,441
Compare current foreclosures near Saline, MI:
| Photo | Address | Area | Beds / Baths | Price | Details |
|---|---|---|---|---|---|

|
#1
W Michigan Ave
Saline, MI 48176
|
- sq. feet
|
- baths - beds |
show details | |

|
#2
Valley Dr
Ypsilanti, MI 48197
|
1,300 sq. feet
|
1 baths 3 beds |
$325,000
|
show details |

|
#3
E Michigan Ave # 2
Saline, MI 48176
|
- sq. feet
|
- baths - beds |
show details | |

|
#4
Dell Rd
Saline, MI 48176
|
- sq. feet
|
- baths - beds |
show details | |

|
#5
Sheffield
Saline, MI 48176
|
- sq. feet
|
- baths - beds |
show details | |

|
#6
Rosemont Ave
Saline, MI 48176
|
- sq. feet
|
- baths - beds |
show details | |

|
#7
E Michigan Ave
Saline, MI 48176
|
- sq. feet
|
- baths - beds |
show details | |

|
#8
Londonderry Dr
Saline, MI 48176
|
- sq. feet
|
- baths - beds |
show details | |

|
#9
W Chicago Blvd
Tecumseh, MI 49286
|
2,427 sq. feet
|
2 baths 4 beds |
show details | |

|
#10
Quirk Rd
Belleville, MI 48111
|
1,412 sq. feet
|
1 baths 2 beds |
show details |
| Photo | Address | Area | Beds / Baths | Price | Details |
|---|---|---|---|---|---|

|
#11
Montague St
Belleville, MI 48111
|
1,232 sq. feet
|
1 baths 3 beds |
show details | |

|
#12
Earhart Rd
Ann Arbor, MI 48105
|
3,802 sq. feet
|
2 baths 4 beds |
show details | |

|
#13
Edison Ave
Belleville, MI 48111
|
822 sq. feet
|
1 baths 2 beds |
show details | |

|
#14
Crestwood Ave
Ypsilanti, MI 48198
|
967 sq. feet
|
1 baths 3 beds |
show details | |

|
#15
Woodgrove Dr
Belleville, MI 48111
|
2,582 sq. feet
|
2 baths 4 beds |
show details | |

|
#16
Litchfield St
Clinton, MI 49236
|
1,312 sq. feet
|
2 baths 4 beds |
show details | |

|
#17
2nd St
Ypsilanti, MI 48197
|
1,648 sq. feet
|
2 baths 6 beds |
show details | |

|
#18
Elizabeth Ave
Canton, MI 48188
|
1,669 sq. feet
|
2 baths 2 beds |
show details | |

|
#19
W Michigan Ave
Ypsilanti, MI 48197
|
1,075 sq. feet
|
1 baths 3 beds |
show details | |

|
#20
Woodbrook Rd
Ann Arbor, MI 48103
|
2,185 sq. feet
|
3 baths 4 beds |
show details |
| Photo | Address | Area | Beds / Baths | Price | Details |
|---|---|---|---|---|---|

|
#21
Leonard Ave
Whitmore Lake, MI 48189
|
960 sq. feet
|
1 baths 3 beds |
show details | |

|
#22
Spafford St
Tecumseh, MI 49286
|
1,104 sq. feet
|
1 baths 3 beds |
show details | |

|
#23
Rolling Meadow Ln
Ypsilanti, MI 48197
|
2,188 sq. feet
|
2 baths 4 beds |
show details | |

|
#24
Tyler Rd
Belleville, MI 48111
|
1,732 sq. feet
|
2 baths 3 beds |
show details | |

|
#25
Riggs Rd
Belleville, MI 48111
|
1,280 sq. feet
|
2 baths 3 beds |
show details | |

|
#26
E Monroe St
Dundee, MI 48131
|
1,236 sq. feet
|
1 baths 3 beds |
show details | |

|
#27
Rosefield Dr
Ann Arbor, MI 48108
|
2,223 sq. feet
|
3 baths 4 beds |
show details | |

|
#28
Turnberry Ln
Ann Arbor, MI 48108
|
1,910 sq. feet
|
1 baths 4 beds |
show details | |

|
#29
Manchester Rd
Ann Arbor, MI 48104
|
1,632 sq. feet
|
2 baths 3 beds |
show details | |

|
#30
Colebrook Dr
Clinton, MI 49236
|
1,734 sq. feet
|
2 baths 4 beds |
show details |
| Photo | Address | Area | Beds / Baths | Price | Details |
|---|---|---|---|---|---|

|
#31
Hoagland Hwy
Britton, MI 49229
|
814 sq. feet
|
1 baths 4 beds |
show details | |

|
#32
Walter Dr
Ann Arbor, MI 48103
|
1,014 sq. feet
|
2 baths 3 beds |
show details | |

|
#33
Centennial Rd
Britton, MI 49229
|
1,576 sq. feet
|
1 baths 3 beds |
show details | |

|
#34
Sunnyside Blvd
Ann Arbor, MI 48103
|
1,348 sq. feet
|
1 baths 4 beds |
show details | |

|
#35
Maplewood Ave
Ann Arbor, MI 48104
|
884 sq. feet
|
1 baths 2 beds |
show details | |

|
#36
Brookside Dr
Belleville, MI 48111
|
2,004 sq. feet
|
2 baths 4 beds |
show details | |

|
#37
Spy Glass Ln
Ypsilanti, MI 48197
|
1,900 sq. feet
|
2 baths 4 beds |
show details | |

|
#38
Prospect St
Ann Arbor, MI 48104
|
1,937 sq. feet
|
3 baths 4 beds |
show details | |

|
#39
N 4th Ave
Ann Arbor, MI 48104
|
3,096 sq. feet
|
2 baths 2 beds |
show details | |

|
#40
Pinecrest Ave
Ann Arbor, MI 48104
|
1,422 sq. feet
|
2 baths 3 beds |
show details |
| Photo | Address | Area | Beds / Baths | Price | Details |
|---|---|---|---|---|---|

|
#41
S 7th St
Ann Arbor, MI 48103
|
1,047 sq. feet
|
2 baths 2 beds |
show details | |

|
#42
Barclay Way
Ann Arbor, MI 48105
|
1,623 sq. feet
|
2 baths 2 beds |
show details | |

|
#43
Taylor Rd
Clinton, MI 49236
|
1,540 sq. feet
|
2 baths 3 beds |
show details | |

|
#44
Colony Rd
Ann Arbor, MI 48104
|
2,172 sq. feet
|
3 baths 4 beds |
show details | |

|
#45
Esch Ave
Ann Arbor, MI 48104
|
1,979 sq. feet
|
2 baths 4 beds |
show details | |

|
#46
Wisner Hwy
Tecumseh, MI 49286
|
1,300 sq. feet
|
1 baths 4 beds |
show details | |

|
#47
Pocklington Rd
Tecumseh, MI 49286
|
1,945 sq. feet
|
1 baths 3 beds |
show details | |

|
#48
Cloverly Ct
Ann Arbor, MI 48108
|
1,679 sq. feet
|
2 baths 2 beds |
show details | |

|
#49
Warren Rd
Plymouth, MI 48170
|
2,599 sq. feet
|
2 baths 4 beds |
show details | |

|
Check over 1 million property listings on Foreclosure.com!
|
browse all offers | |||

Latest news about housing in Saline, MI collected exclusively by city-data.com from local newspapers, TV, and radio stations

 | Apartments near UofM (14 replies) |
| Ann Arbor area condos (2 replies) |
| Looking to rent a house/condo near Ann Arbor (0 replies) |
| Saline Mi Visitor needs to rent a small locker (2 replies) |
| Will COVID lead to housing price dropping ? (16 replies) |
| Rental (apt.'s or house) in Saline, Milan, or Dexter (3 replies) |

Median year apartment built: 1975
Household type by relationship:
Households: 8,879- Male householders: 1,849 (401 living alone), Female householders: 1,848 (669 living alone)
2,028 spouses (1,954 opposite-sex spouses), 121 unmarried partners, (98 opposite-sex unmarried partners), 2,240 children (2,212 natural, 0 adopted, 27 stepchildren), 56 grandchildren, 65 brothers or sisters, 16 parents, 0 foster children, 18 other relatives, 453 non-relatives
- In group quarters: 180
Size of family households: 1,390 2-persons, 383 3-persons, 487 4-persons, 213 5-persons, 31 6-persons.
Size of nonfamily households: 1,071 1-person, 175 2-persons, 11 3-persons, 31 6-persons, 7 7-or-more-persons.
1,394 married couples with children.
241 single-parent households (100 men, 141 women).
93.9% of residents of Saline speak English at home.
0.4% of residents speak Spanish at home (100% speak English very well).
2.9% of residents speak other Indo-European language at home (90% speak English very well, 3% speak English well, 4% speak English not well, 3% don't speak English at all).
2.9% of residents speak Asian or Pacific Island language at home (53% speak English very well, 47% speak English well).
0.1% of residents speak other language at home (100% speak English very well).
Foreign born population: 522 (5.9%)
(77.2% of them are naturalized citizens)
| Here: | 6.7 |
| State: | 6.5 |
| Here: | 4.0 |
| State: | 4.3 |

- Bedrooms in owner-occupied houses and condos in Saline, Michigan
- 31no bedroom
- 1591 bedroom
- 5002 bedrooms
- 1,1143 bedrooms
- 8204 bedrooms
- 775+ bedrooms

- Bedrooms in renter-occupied apartments in Saline, Michigan
- 15no bedroom
- 3971 bedroom
- 4872 bedrooms
- 1333 bedrooms
- 224 bedrooms
- 375+ bedrooms

- Cars and other vehicles available in Saline in owner-occupied houses/condos
- 49no vehicle
- 8571 vehicle
- 1,2682 vehicles
- 3303 vehicles
- 1144 vehicles
- 855+ vehicles

- Cars and other vehicles available in Saline in renter-occupied apartments
- 264no vehicle
- 4911 vehicle
- 2762 vehicles
- 193 vehicles
- 04 vehicles
- 415+ vehicles

- Rooms in owner-occupied houses in Saline, Michigan
- 311 room
- 02 rooms
- 1663 rooms
- 1464 rooms
- 4765 rooms
- 4846 rooms
- 4347 rooms
- 3368 rooms
- 6279+ rooms

- Rooms in renter-occupied apartments in Saline, Michigan
- 151 room
- 1322 rooms
- 1993 rooms
- 4044 rooms
- 1765 rooms
- 766 rooms
- 217 rooms
- 688 rooms
- 09+ rooms


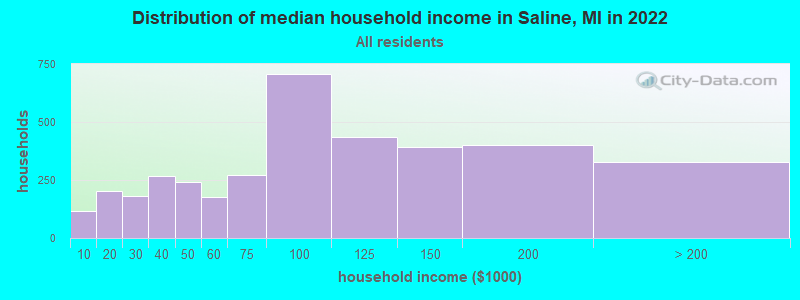
Saline, MI household income distribution

- 118Less than $10,000
- 201$10,000 to $19,999
- 179$20,000 to $29,999
- 267$30,000 to $39,999
- 243$40,000 to $49,999
- 178$50,000 to $59,999
- 271$60,000 to $74,999
- 709$75,000 to $99,999
- 434$100,000 to $124,999
- 392$125,000 to $149,999
- 399$150,000 to $199,999
- 328$200,000 or more
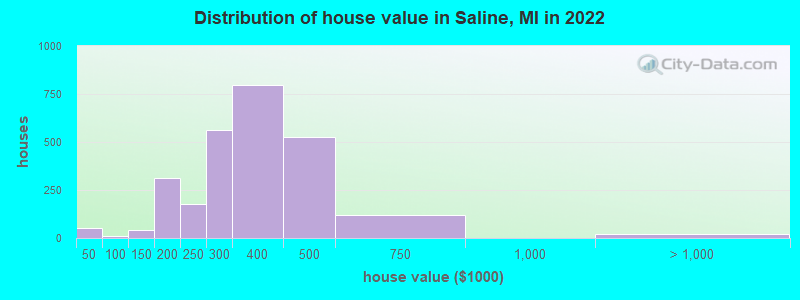
Home value of owner - occupied houses in 2022 in Saline, MI
-
- 43Less than $10,000
- 9$10,000 to $14,999
- 11$80,000 to $89,999
- 41$100,000 to $124,999
- 227$150,000 to $174,999
- 85$175,000 to $199,999
- 178$200,000 to $249,999
- 563$250,000 to $299,999
- 797$300,000 to $399,999
- 525$400,000 to $499,999
- 118$500,000 to $749,999
- 21$2,000,000 or more
Rent paid by renters in 2022 in Saline, MI
-
- 3$300 to $349
- 24$350 to $399
- 14$400 to $449
- 130$500 to $549
- 13$550 to $599
- 21$600 to $649
- 175$650 to $699
- 54$700 to $749
- 154$800 to $899
- 159$900 to $999
- 112$1,000 to $1,249
- 127$1,500 to $1,999
- 14$2,500 to $2,999
- 43$3,500 or more
- 83No cash rent


Percentage of workers working in this county: 86.0%
Number of people working at home: 976 (23.1% of all workers)
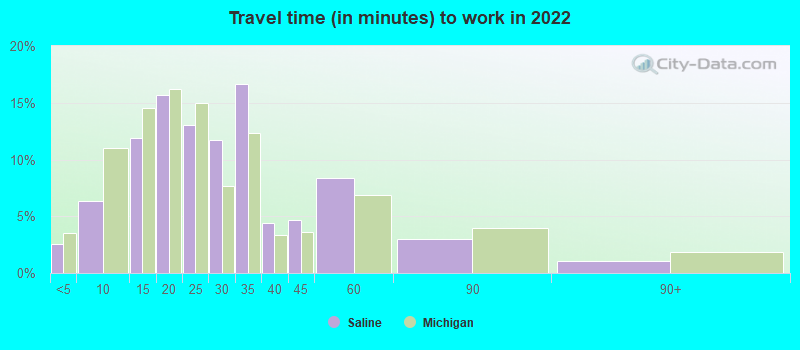
Travel time to work (commute)
- Less than 5 minutes: 116
- 5 to 9 minutes: 238
- 10 to 14 minutes: 280
- 15 to 19 minutes: 291
- 20 to 24 minutes: 571
- 25 to 29 minutes: 532
- 30 to 34 minutes: 543
- 35 to 39 minutes: 32
- 40 to 44 minutes: 102
- 45 to 59 minutes: 260
- 60 to 89 minutes: 133
- 90 or more minutes: 80
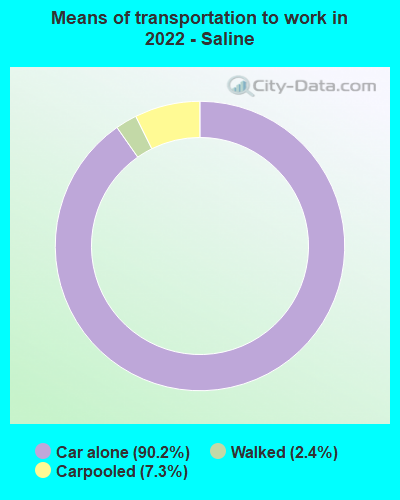
Means of transportation to work:
- Drove a car alone: 5,088 (77.5%)
- Carpooled: 413 (6.3%)
- Bus: 1 (0.0%)
- Walked: 103 (1.6%)
- Worked at home: 976 (14.9%)

- Unemployment by race in 2022
- Unemployment rate for White non-Hispanic residents
- 3.1%Males
- 4.0%Females
- Unemployment rate for Black residents
- 67.7%Males
- Unemployment rate for two or more race residents
- 22.7%Males
- Unemployment rate for Hispanic or Latino residents
- 34.6%Males

- Year of entry for the foreign-born population in Saline, Michigan
- 1842010 or later
- 852000 to 2009
- 631990 to 1999
- 601980 to 1989
- 351970 to 1979
- 70Before 1970
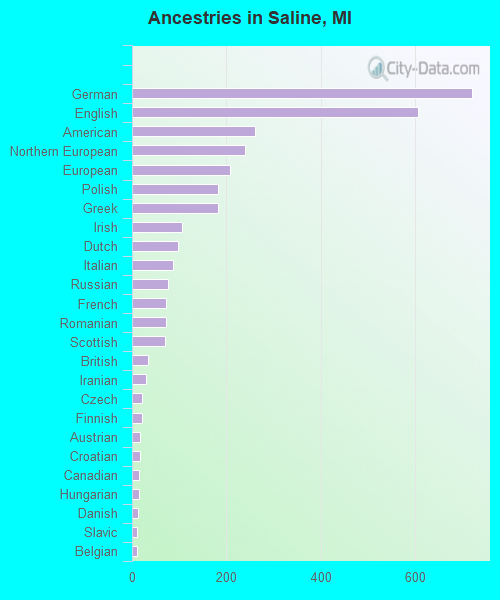
First ancestries reported:
- German: 721 (19.6%)
- English: 606 (16.5%)
- American: 261 (7.1%)
- Northern European: 240 (6.5%)
- European: 207 (5.6%)
- Polish: 183 (5.0%)
- Greek: 182 (4.9%)
- Irish: 106 (2.9%)
- Dutch: 97 (2.6%)
- Italian: 86 (2.3%)
- Russian: 76 (2.1%)
- French: 73 (2.0%)
- Romanian: 72 (2.0%)
- Scottish: 71 (1.9%)
- British: 33 (0.9%)
- Iranian: 29 (0.8%)
- Czech: 21 (0.6%)
- Finnish: 21 (0.6%)
- Austrian: 18 (0.5%)
- Croatian: 16 (0.4%)
- Canadian: 14 (0.4%)
- Hungarian: 14 (0.4%)
- Danish: 13 (0.4%)
- Slavic: 11 (0.3%)
- Belgian: 10 (0.3%)
- Norwegian: 10 (0.3%)
- Brazilian: 8 (0.2%)
- Swedish: 8 (0.2%)
- Scotch-Irish: 6 (0.2%)
- Slovak: 5 (0.1%)
Most common places of birth for foreign-born residents (%):
| Saline: | 14.5% (80) |
| Michigan: | 0.0% (251) |
| Saline: | 12.3% (68) |
| Michigan: | 2.8% (19,112) |
| Saline: | 11.4% (63) |
| Michigan: | 1.8% (12,679) |
| Saline: | 8.2% (45) |
| Michigan: | 0.6% (3,969) |
| Saline: | 6.5% (36) |
| Michigan: | 0.5% (3,681) |
| Saline: | 5.8% (32) |
| Michigan: | 11.1% (77,240) |
| Saline: | 5.4% (30) |
| Michigan: | 0.8% (5,492) |
| Saline: | 4.5% (25) |
| Michigan: | 4.9% (34,295) |
| Saline: | 4.5% (25) |
| Michigan: | 0.6% (4,245) |
| Saline: | 4.2% (23) |
| Michigan: | 1.2% (8,563) |
| Saline: | 3.3% (18) |
| Michigan: | 2.3% (16,126) |
| Saline: | 3.1% (17) |
| Michigan: | 8.1% (55,954) |
| Saline: | 3.1% (17) |
| Michigan: | 5.0% (35,052) |
| Saline: | 2.7% (15) |
| Michigan: | 3.7% (25,634) |
| Saline: | 2.5% (14) |
| Michigan: | 1.6% (10,857) |
| Saline: | 2.5% (14) |
| Michigan: | 1.1% (7,485) |
| Saline: | 2.0% (11) |
| Michigan: | 10.9% (75,965) |
| Saline: | 2.0% (11) |
| Michigan: | 0.3% (1,871) |
Place of birth for U.S.-born residents:
- This state: 5,673
- Other state: 2,601
- Northeast: 452
- Midwest: 1,184
- South: 760
- West: 229
91.7% of Saline residents lived in the same house 1 years ago.
Out of people who lived in different houses, 30.2% lived in this county.
Out of people who lived in different counties, 78.2% lived in Michigan.
| Saline: | 91.7% |
| State average: | 88.4% |
Education attainment for males 25 years and older:
- No schooling: 140
- Nursery to 4th grade: 0
- 5th and 6th grade: 0
- 7th and 8th grade: 0
- 9th grade: 0
- 10th grade: 0
- 11th grade: 1
- 12th grade, no diploma: 18
- High school graduate (or equivalency): 406
- Less than 1 year of college: 226
- Some college more than 1 year, no degree: 263
- Associate degree: 224
- Bachelor's degree: 733
- Master's degree: 854
- Professional school degree: 152
- Doctorate degree: 144

Education attainment for females 25 years and older:
- No schooling: 23
- Nursery to 4th grade: 0
- 5th and 6th grade: 0
- 7th and 8th grade: 4
- 9th grade: 26
- 10th grade: 10
- 11th grade: 0
- 12th grade, no diploma: 4
- High school graduate (or equivalency): 407
- Less than 1 year of college: 96
- Some college more than 1 year, no degree: 490
- Associate degree: 379
- Bachelor's degree: 1,065
- Master's degree: 745
- Professional school degree: 65
- Doctorate degree: 81


Housing units in structures:
- One, detached: 2,659
- One, attached: 302
- Two: 85
- 3 or 4: 132
- 5 to 9: 350
- 10 to 19: 39
- 20 to 49: 124
- 50 or more: 269
- Mobile homes: 44
House/condo owner moved in on average 8 years ago
Renter moved in on average 4 years ago

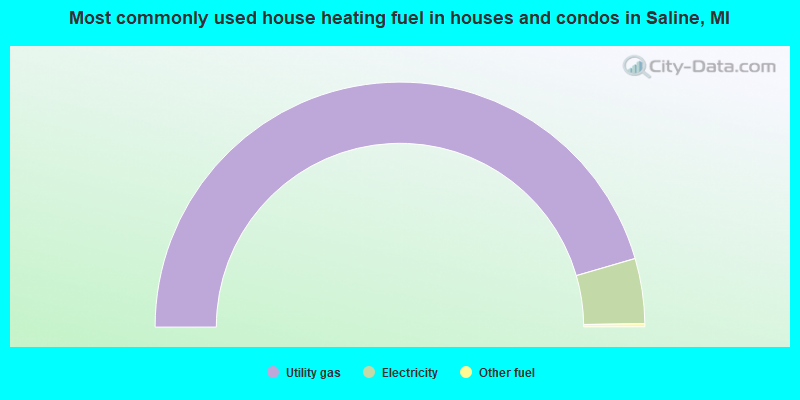
- 91.0%Utility gas
- 8.6%Electricity
- 0.4%Other fuel
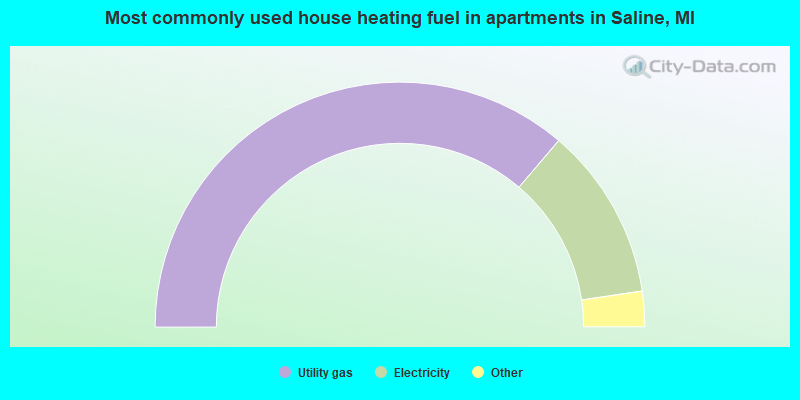
- 72.6%Utility gas
- 22.9%Electricity
- 3.3%Fuel oil, kerosene, etc.
- 1.2%No fuel used
Private vs. public school enrollment:
| Here: | 15.8% |
| Michigan: | 12.4% |
| Here: | 6.0% |
| Michigan: | 9.8% |
| Here: | 0.3% |
| Michigan: | 14.9% |


