Salem, OH (Ohio) Houses and Residents
| Salem: | $126,496 |
| Ohio: | $204,100 |
Total population: 12,087 (Urban population: 12,067 (all inside urban clusters), Rural population: 0)
Houses: 5,894 (5,184 occupied: 2,998 owner occupied, 2,070 renter occupied)
| % of renters here: | 41% |
| State: | 33% |
Housing density: 1,077 houses/condos per square mile
Median price asked for vacant for-sale houses and condos in 2022: $95,001.
Median contract rent in 2022: $570 (lower quartile is $524, upper quartile is $731)
Median rent asked for vacant for-rent units in 2022: $1,687
Median gross rent in Salem, OH in 2022: $767
Housing units in Salem with a mortgage: 1,868 (100 second mortgage, 0 home equity loan, 94 both second mortgage and home equity loan)
Houses without a mortgage: 39
Median household income for houses/condos with a mortgage: $72,574
Median household income for apartments without a mortgage: $38,544
Median monthly housing costs: $770
Compare current foreclosures in Salem, OH:
| Photo | Address | Area | Beds / Baths | Price | Details |
|---|---|---|---|---|---|

|
#1
Academy Ln
Salem, OH 44460
|
2,440 sq. feet
|
2 baths 5 beds |
$189,900
|
show details |

|
#2
N Ellsworth Ave
Salem, OH 44460
|
1,472 sq. feet
|
2 baths 3 beds |
show details | |

|
#3
Orchard Bend Dr
Salem, OH 44460
|
1,726 sq. feet
|
2 baths 3 beds |
show details | |

|
#4
N Ellsworth Ave
Salem, OH 44460
|
1,870 sq. feet
|
2 baths 4 beds |
show details | |

|
#5
Plymouth Pl
Salem, OH 44460
|
1,224 sq. feet
|
2 baths 3 beds |
show details | |

|
#6
S Union Ave
Salem, OH 44460
|
982 sq. feet
|
1 baths 2 beds |
show details | |

|
#7
Aetna St
Salem, OH 44460
|
1,774 sq. feet
|
2 baths 4 beds |
show details | |

|
#8
Lexington Ave
Salem, OH 44460
|
1,206 sq. feet
|
2 baths 2 beds |
show details | |

|
#9
E Pine Lake Rd
Salem, OH 44460
|
1,440 sq. feet
|
2 baths 4 beds |
show details | |

|
#10
W 9th St
Salem, OH 44460
|
768 sq. feet
|
2 baths 3 beds |
show details |
| Photo | Address | Area | Beds / Baths | Price | Details |
|---|---|---|---|---|---|

|
#11
E Euclid Ave
Salem, OH 44460
|
1,577 sq. feet
|
1 baths 3 beds |
show details | |

|
#12
E 3rd St
Salem, OH 44460
|
1,408 sq. feet
|
1 baths 3 beds |
show details | |

|
#13
N Lincoln Ave
Salem, OH 44460
|
2,984 sq. feet
|
3 baths 4 beds |
show details | |

|
#14
Old Coach Ln
Salem, OH 44460
|
1,842 sq. feet
|
2 baths 3 beds |
show details | |

|
#15
W 3rd St
Salem, OH 44460
|
726 sq. feet
|
1 baths 2 beds |
show details | |

|
#16
Fair Ave
Salem, OH 44460
|
576 sq. feet
|
1 baths 2 beds |
show details | |

|
#17
E Pershing St
Salem, OH 44460
|
1,248 sq. feet
|
1 baths 3 beds |
show details | |

|
#18
Arch St
Salem, OH 44460
|
864 sq. feet
|
1 baths 2 beds |
show details | |

|
#19
Elberon Ave
Salem, OH 44460
|
1,064 sq. feet
|
1 baths 3 beds |
show details | |

|
#20
Woodland Ave
Salem, OH 44460
|
1,560 sq. feet
|
1 baths 4 beds |
show details |
| Photo | Address | Area | Beds / Baths | Price | Details |
|---|---|---|---|---|---|

|
#21
Southridge Dr
Salem, OH 44460
|
2,480 sq. feet
|
2 baths 3 beds |
show details | |

|
#22
W 6th St
Salem, OH 44460
|
1,968 sq. feet
|
1 baths 4 beds |
show details | |

|
#23
Brooklyn Ave
Salem, OH 44460
|
1,756 sq. feet
|
1 baths 4 beds |
show details | |

|
#24
Liberty St
Salem, OH 44460
|
1,296 sq. feet
|
1 baths 3 beds |
show details | |

|
#25
Salem Unity Rd
Salem, OH 44460
|
1,232 sq. feet
|
2 baths 3 beds |
show details | |

|
#26
E Pine Lake Rd
Salem, OH 44460
|
1,440 sq. feet
|
2 baths 3 beds |
show details | |

|
#27
E 6th St
Salem, OH 44460
|
2,268 sq. feet
|
1 baths 3 beds |
show details | |

|
#28
Winona Rd # B
Salem, OH 44460
|
1,855 sq. feet
|
2 baths 4 beds |
show details | |

|
#29
Cider Mill Rd
Salem, OH 44460
|
900 sq. feet
|
1 baths 3 beds |
show details | |

|
#30
E 10th St
Salem, OH 44460
|
1,484 sq. feet
|
1 baths 3 beds |
show details |
| Photo | Address | Area | Beds / Baths | Price | Details |
|---|---|---|---|---|---|

|
#31
Elberon Ave
Salem, OH 44460
|
1,064 sq. feet
|
1 baths 3 beds |
show details | |

|
#32
N Ellsworth Ave
Salem, OH 44460
|
1,172 sq. feet
|
1 baths 3 beds |
show details | |

|
#33
N Ellsworth Ave
Salem, OH 44460
|
1,905 sq. feet
|
2 baths 3 beds |
show details | |

|
#34
Jennings Ave
Salem, OH 44460
|
1,352 sq. feet
|
1 baths 3 beds |
show details | |

|
#35
W Pershing St
Salem, OH 44460
|
820 sq. feet
|
1 baths 4 beds |
show details | |

|
#36
Granite St
Salem, OH 44460
|
1,296 sq. feet
|
1 baths 3 beds |
show details | |

|
#37
Southeast Blvd
Salem, OH 44460
|
925 sq. feet
|
1 baths 2 beds |
show details | |

|
#38
Andrew Ave
Salem, OH 44460
|
864 sq. feet
|
1 baths 3 beds |
show details | |

|
#39
Springdale Ave
Salem, OH 44460
|
1,664 sq. feet
|
1 baths 3 beds |
show details | |

|
#40
Winona Rd
Salem, OH 44460
|
1,520 sq. feet
|
5 baths 8 beds |
show details |
| Photo | Address | Area | Beds / Baths | Price | Details |
|---|---|---|---|---|---|

|
#41
W 16th St
Salem, OH 44460
|
768 sq. feet
|
1 baths 2 beds |
show details | |

|
#42
Maple St
Salem, OH 44460
|
1,512 sq. feet
|
1 baths 3 beds |
show details | |

|
#43
W Garfield Rd
Salem, OH 44460
|
1,116 sq. feet
|
1 baths 2 beds |
show details | |

|
#44
Washington St
Salem, OH 44460
|
1,680 sq. feet
|
1 baths 3 beds |
show details | |

|
#45
Oak St
Salem, OH 44460
|
1,448 sq. feet
|
1 baths 3 beds |
show details | |

|
#46
W School St
Salem, OH 44460
|
1,248 sq. feet
|
1 baths 3 beds |
show details | |

|
#47
Newgarden Rd
Salem, OH 44460
|
1,332 sq. feet
|
2 baths 3 beds |
show details | |

|
#48
W Pershing St
Salem, OH 44460
|
1,316 sq. feet
|
1 baths 2 beds |
show details | |

|
#49
Benton Rd
Salem, OH 44460
|
1,560 sq. feet
|
1 baths 4 beds |
show details | |

|
Check over 1 million property listings on Foreclosure.com!
|
browse all offers | |||

Latest news about housing in Salem, OH collected exclusively by city-data.com from local newspapers, TV, and radio stations


Median year apartment built: 1957
Household type by relationship:
Households: 11,719- Male householders: 2,408 (745 living alone), Female householders: 2,714 (1,275 living alone)
1,729 spouses (1,694 opposite-sex spouses), 643 unmarried partners, (643 opposite-sex unmarried partners), 2,819 children (2,690 natural, 89 adopted, 39 stepchildren), 258 grandchildren, 52 brothers or sisters, 197 parents, 0 foster children, 116 other relatives, 458 non-relatives
- In group quarters: 320
Size of family households: 1,082 2-persons, 991 3-persons, 459 4-persons, 196 5-persons, 80 6-persons, 25 7-or-more-persons.
Size of nonfamily households: 1,763 1-person, 332 2-persons, 30 3-persons, 45 4-persons.
938 married couples with children.
863 single-parent households (113 men, 750 women).
98.1% of residents of Salem speak English at home.
0.5% of residents speak Spanish at home (100% speak English very well).
1.3% of residents speak other Indo-European language at home (11% speak English very well, 89% speak English well).
0.1% of residents speak Asian or Pacific Island language at home (100% speak English very well).
Foreign born population: 135 (1.2%)
(52.6% of them are naturalized citizens)
| Here: | 6.5 |
| State: | 6.7 |
| Here: | 5.1 |
| State: | 4.4 |

- Bedrooms in owner-occupied houses and condos in Salem, Ohio
- 19no bedroom
- 271 bedroom
- 5272 bedrooms
- 1,7253 bedrooms
- 6184 bedrooms
- 825+ bedrooms

- Bedrooms in renter-occupied apartments in Salem, Ohio
- 0no bedroom
- 5161 bedroom
- 8922 bedrooms
- 5593 bedrooms
- 494 bedrooms
- 555+ bedrooms

- Cars and other vehicles available in Salem in owner-occupied houses/condos
- 153no vehicle
- 8471 vehicle
- 1,1372 vehicles
- 5343 vehicles
- 1244 vehicles
- 2035+ vehicles

- Cars and other vehicles available in Salem in renter-occupied apartments
- 444no vehicle
- 1,0631 vehicle
- 3852 vehicles
- 1613 vehicles
- 04 vehicles
- 185+ vehicles

- Rooms in owner-occupied houses in Salem, Ohio
- 191 room
- 02 rooms
- 183 rooms
- 1374 rooms
- 6005 rooms
- 7596 rooms
- 6517 rooms
- 3208 rooms
- 4969+ rooms

- Rooms in renter-occupied apartments in Salem, Ohio
- 01 room
- 1572 rooms
- 3283 rooms
- 5464 rooms
- 3605 rooms
- 2406 rooms
- 2807 rooms
- 388 rooms
- 1219+ rooms


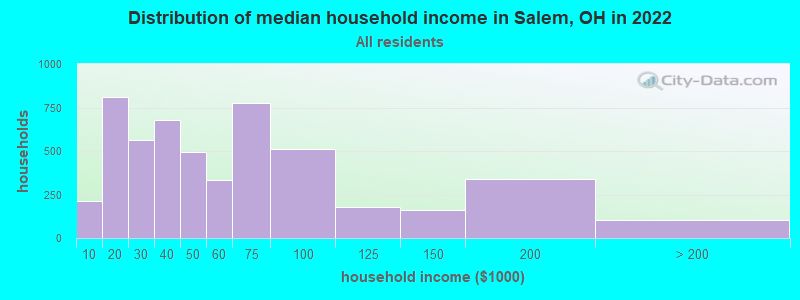
Salem, OH household income distribution

- 212Less than $10,000
- 811$10,000 to $19,999
- 563$20,000 to $29,999
- 678$30,000 to $39,999
- 495$40,000 to $49,999
- 332$50,000 to $59,999
- 774$60,000 to $74,999
- 510$75,000 to $99,999
- 176$100,000 to $124,999
- 161$125,000 to $149,999
- 338$150,000 to $199,999
- 106$200,000 or more
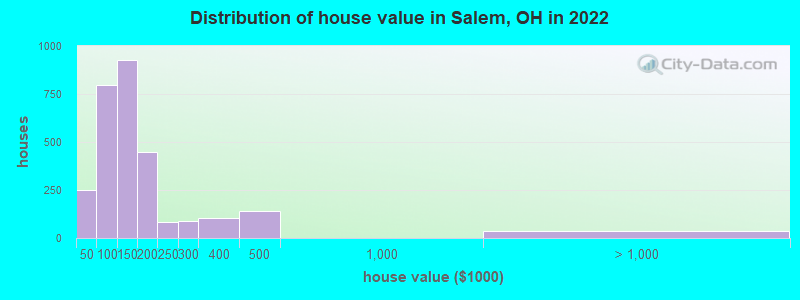
Home value of owner - occupied houses in 2022 in Salem, OH
-
- 56Less than $10,000
- 109$35,000 to $39,999
- 82$40,000 to $49,999
- 89$50,000 to $59,999
- 71$60,000 to $69,999
- 59$70,000 to $79,999
- 372$80,000 to $89,999
- 123$90,000 to $99,999
- 603$100,000 to $124,999
- 324$125,000 to $149,999
- 332$150,000 to $174,999
- 117$175,000 to $199,999
- 82$200,000 to $249,999
- 90$250,000 to $299,999
- 105$300,000 to $399,999
- 141$400,000 to $499,999
- 34$2,000,000 or more
Rent paid by renters in 2022 in Salem, OH
-
- 92$100 to $149
- 17$150 to $199
- 37$200 to $249
- 22$250 to $299
- 10$300 to $349
- 71$350 to $399
- 135$400 to $449
- 237$450 to $499
- 325$500 to $549
- 228$550 to $599
- 273$600 to $649
- 178$650 to $699
- 17$700 to $749
- 92$750 to $799
- 99$800 to $899
- 79$900 to $999
- 138$1,000 to $1,249
- 12$1,500 to $1,999
- 315No cash rent


Percentage of workers working in this county: 73.5%
Number of people working at home: 288 (4.4% of all workers)
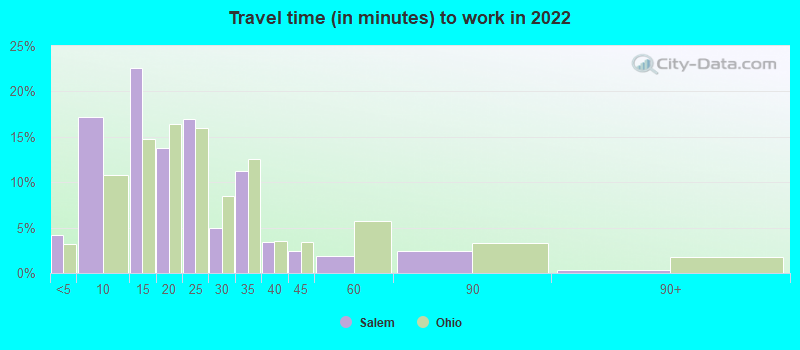
Travel time to work (commute)
- Less than 5 minutes: 256
- 5 to 9 minutes: 1,765
- 10 to 14 minutes: 1,169
- 15 to 19 minutes: 430
- 20 to 24 minutes: 561
- 25 to 29 minutes: 341
- 30 to 34 minutes: 432
- 35 to 39 minutes: 264
- 40 to 44 minutes: 146
- 45 to 59 minutes: 185
- 60 to 89 minutes: 159
- 90 or more minutes: 115
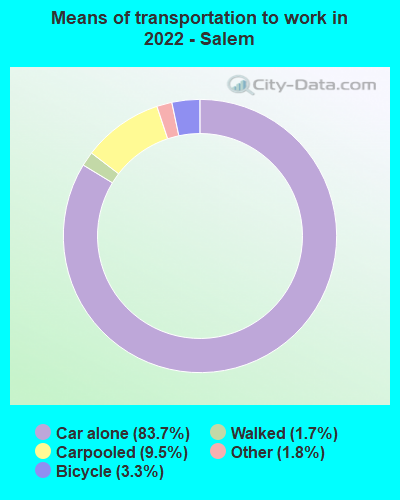
Means of transportation to work:
- Drove a car alone: 7,508 (78.3%)
- Carpooled: 918 (9.6%)
- Bus: 4 (0.0%)
- Taxi: 193 (2.0%)
- Bicycle: 325 (3.4%)
- Walked: 150 (1.6%)
- Worked at home: 288 (3.0%)

- Unemployment by race in 2022
- Unemployment rate for White non-Hispanic residents
- 2.7%Males
- 5.5%Females
- Unemployment rate for Black residents
- 100.0%Females
- Unemployment rate for two or more race residents
- 42.5%Males

- Year of entry for the foreign-born population in Salem, Ohio
- 02010 or later
- 192000 to 2009
- 741990 to 1999
- 231980 to 1989
- 71970 to 1979
- 85Before 1970

First ancestries reported:
- American: 906 (20.9%)
- Irish: 900 (20.8%)
- German: 720 (16.6%)
- Italian: 323 (7.5%)
- English: 295 (6.8%)
- Scottish: 185 (4.3%)
- Polish: 127 (2.9%)
- Scotch-Irish: 50 (1.2%)
- European: 47 (1.1%)
- Belgian: 45 (1.0%)
- Slovak: 42 (1.0%)
- Romanian: 32 (0.7%)
- Croatian: 31 (0.7%)
- French: 25 (0.6%)
- Swiss: 25 (0.6%)
- Hungarian: 23 (0.5%)
- Welsh: 19 (0.4%)
- Greek: 16 (0.4%)
- Norwegian: 12 (0.3%)
- Slovene: 12 (0.3%)
- Eastern European: 10 (0.2%)
- Swedish: 10 (0.2%)
- British: 3 (0.07%)
Most common places of birth for foreign-born residents (%):
| Salem: | 78.4% (149) |
| Ohio: | 0.1% (700) |
| Salem: | 26.3% (50) |
| Ohio: | 0.9% (5,422) |
| Salem: | 25.3% (48) |
| Ohio: | 0.4% (2,094) |
| Salem: | 10.0% (19) |
| Ohio: | 2.6% (14,988) |
Place of birth for U.S.-born residents:
- This state: 9,523
- Other state: 1,989
- Northeast: 751
- Midwest: 198
- South: 872
- West: 107
86.6% of Salem residents lived in the same house 1 years ago.
Out of people who lived in different houses, 38.0% lived in this county.
Out of people who lived in different counties, 91.5% lived in Ohio.
| Salem: | 86.6% |
| State average: | 87.8% |
Education attainment for males 25 years and older:
- No schooling: 36
- Nursery to 4th grade: 22
- 5th and 6th grade: 0
- 7th and 8th grade: 21
- 9th grade: 99
- 10th grade: 35
- 11th grade: 110
- 12th grade, no diploma: 188
- High school graduate (or equivalency): 1,518
- Less than 1 year of college: 188
- Some college more than 1 year, no degree: 273
- Associate degree: 479
- Bachelor's degree: 712
- Master's degree: 114
- Professional school degree: 30
- Doctorate degree: 9

Education attainment for females 25 years and older:
- No schooling: 113
- Nursery to 4th grade: 0
- 5th and 6th grade: 0
- 7th and 8th grade: 107
- 9th grade: 0
- 10th grade: 33
- 11th grade: 301
- 12th grade, no diploma: 90
- High school graduate (or equivalency): 1,900
- Less than 1 year of college: 264
- Some college more than 1 year, no degree: 620
- Associate degree: 431
- Bachelor's degree: 507
- Master's degree: 176
- Professional school degree: 0
- Doctorate degree: 0


Housing units in structures:
- One, detached: 4,021
- One, attached: 346
- Two: 351
- 3 or 4: 766
- 5 to 9: 188
- 10 to 19: 16
- 20 to 49: 109
- 50 or more: 55
- Mobile homes: 34
Housing units lacking complete kitchen facilities in 2022: 6.2%
House/condo owner moved in on average 12 years ago
Renter moved in on average 5 years ago

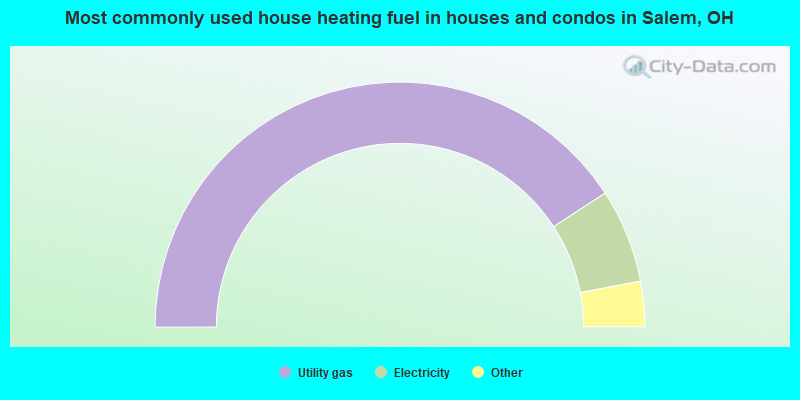
- 81.6%Utility gas
- 12.4%Electricity
- 3.8%Bottled, tank, or LP gas
- 1.6%Fuel oil, kerosene, etc.
- 0.6%Wood
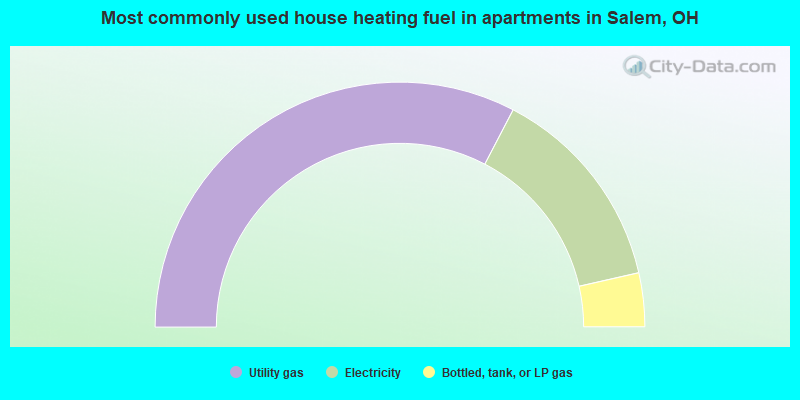
- 65.3%Utility gas
- 27.6%Electricity
- 7.1%Bottled, tank, or LP gas
Private vs. public school enrollment:
| Here: | 4.6% |
| Ohio: | 16.0% |
| Here: | 0.0% |
| Ohio: | 13.1% |
| Here: | 34.3% |
| Ohio: | 22.3% |


