Salem, MA (Massachusetts) Houses and Residents
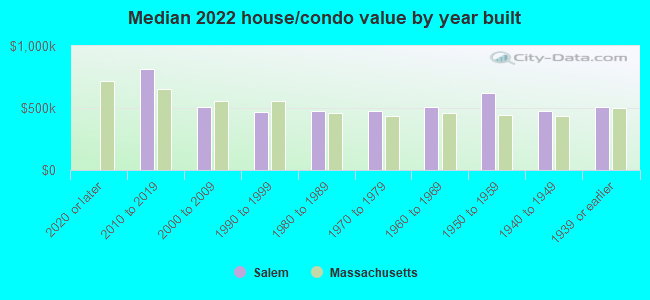
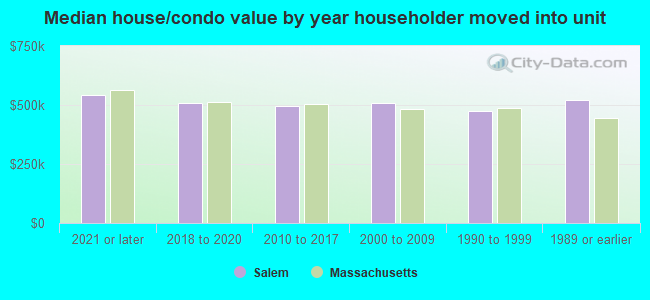
| Salem: | $503,657 |
| Massachusetts: | $534,700 |
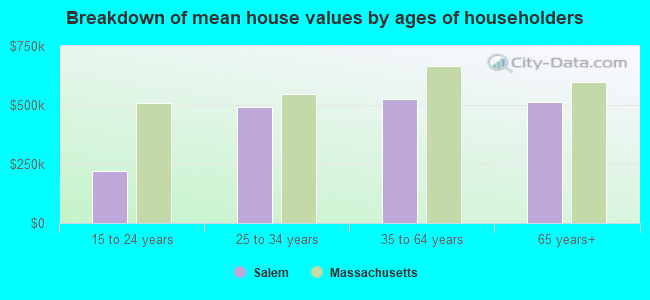
Mean price in 2022:
Detached houses: $578,713
Here: $578,713 State: $651,570 Townhouses or other attached units: $560,505
Here: $560,505 State: $617,749 In 2-unit structures: $566,944
Here: $566,944 State: $594,808 In 3-to-4-unit structures: $505,667
Here: $505,667 State: $601,912 In 5-or-more-unit structures: $428,162
Here: $428,162 State: $555,768 Occupied boats, RVs, vans, etc.: $114,185
Here: $114,185 State: $207,873
Total population: 42,824 (Urban population: 40,407, Rural population: 0)
Houses: 21,293 (20,083 occupied: 10,205 owner occupied, 9,934 renter occupied)
| % of renters here: | 49% |
| State: | 38% |
Housing density: 2,627 houses/condos per square mile
Median price asked for vacant for-sale houses and condos in 2022: $423,989.
Median contract rent in 2022: $1,670 (lower quartile is $1,186, upper quartile is over $2,000)
Median rent asked for vacant for-rent units in 2022: $2,447
Median gross rent in Salem, MA in 2022: $1,799
Housing units in Salem with a mortgage: 7,487 (1,087 second mortgage, 30 home equity loan, 971 both second mortgage and home equity loan)
Houses without a mortgage: 154
Median household income for houses/condos with a mortgage: $130,685
Median household income for apartments without a mortgage: $69,335
Median monthly housing costs: $1,856
Compare current foreclosures in Salem, MA:
| Photo | Address | Area | Beds / Baths | Price | Details |
|---|---|---|---|---|---|

|
#1
Bengal Ln
Salem, MA 01970
|
1,635 sq. feet
|
2 baths 2 beds |
show details | |

|
#2
Cheval Ave
Salem, MA 01970
|
1,767 sq. feet
|
1 baths 3 beds |
show details | |

|
#3
Broad St Apt 12
Salem, MA 01970
|
1,328 sq. feet
|
2 baths 2 beds |
show details | |

|
#4
Scenic Ave
Salem, MA 01970
|
1,554 sq. feet
|
2 baths 3 beds |
show details | |

|
#5
Woodlands Rd
Salem, MA 01970
|
2,112 sq. feet
|
3 baths 3 beds |
show details | |

|
#6
Phillips St
Salem, MA 01970
|
2,075 sq. feet
|
2 baths 2 beds |
show details | |

|
#7
Essex St
Salem, MA 01970
|
3,044 sq. feet
|
2 baths 6 beds |
show details | |

|
#8
Monroe Rd
Salem, MA 01970
|
1,292 sq. feet
|
1 baths 3 beds |
show details | |

|
#9
Pearl St
Salem, MA 01970
|
1,832 sq. feet
|
2 baths 2 beds |
show details | |

|
#10
Essex St # 2
Salem, MA 01970
|
1,258 sq. feet
|
1 baths 2 beds |
show details |
| Photo | Address | Area | Beds / Baths | Price | Details |
|---|---|---|---|---|---|

|
#11
E Collins St
Salem, MA 01970
|
1,512 sq. feet
|
2 baths 4 beds |
show details | |

|
#12
Orchard Ter
Salem, MA 01970
|
1,519 sq. feet
|
2 baths 2 beds |
show details | |

|
#13
Greenway Rd
Salem, MA 01970
|
1,584 sq. feet
|
1 baths 3 beds |
show details | |

|
#14
Ord St
Salem, MA 01970
|
1,365 sq. feet
|
1 baths 2 beds |
show details | |

|
#15
Roslyn St Apt 11
Salem, MA 01970
|
700 sq. feet
|
1 baths 1 beds |
show details | |

|
#16
Lions Ln # 17
Salem, MA 01970
|
1,867 sq. feet
|
2 baths 3 beds |
show details | |

|
#17
Almeda St
Salem, MA 01970
|
2,323 sq. feet
|
2 baths 5 beds |
show details | |

|
#18
Brown St Apt 5
Salem, MA 01970
|
325 sq. feet
|
1 baths 1 beds |
show details | |

|
#19
Cushing St
Salem, MA 01970
|
2,230 sq. feet
|
2 baths 4 beds |
show details | |

|
#20
Leavitt Ct
Salem, MA 01970
|
1,844 sq. feet
|
2 baths 4 beds |
show details |
| Photo | Address | Area | Beds / Baths | Price | Details |
|---|---|---|---|---|---|

|
#21
Boston St # 2
Salem, MA 01970
|
1,683 sq. feet
|
2 baths 2 beds |
show details | |

|
#22
Lions Ln
Salem, MA 01970
|
1,867 sq. feet
|
2 baths 3 beds |
show details | |

|
#23
Loring Ave
Salem, MA 01970
|
3,430 sq. feet
|
1 baths 8 beds |
show details | |

|
#24
Whalers Ln
Salem, MA 01970
|
2,036 sq. feet
|
2 baths 2 beds |
show details | |

|
#25
Crosby St
Salem, MA 01970
|
1,920 sq. feet
|
2 baths 2 beds |
show details | |

|
#26
Jackson St
Salem, MA 01970
|
1,560 sq. feet
|
1 baths - beds |
show details | |

|
#27
Boardman St # 1
Salem, MA 01970
|
- sq. feet
|
- baths - beds |
show details | |

|
#28
Leach St # 2
Salem, MA 01970
|
- sq. feet
|
- baths - beds |
show details | |

|
#29
Moffatt Rd
Salem, MA 01970
|
- sq. feet
|
- baths - beds |
show details | |

|
#30
Hazel St Un 11
Salem, MA 01970
|
- sq. feet
|
- baths - beds |
show details |
| Photo | Address | Area | Beds / Baths | Price | Details |
|---|---|---|---|---|---|

|
#31
Hazel St
Salem, MA 01970
|
- sq. feet
|
- baths - beds |
show details | |

|
#32
Garden Ter
Salem, MA 01970
|
- sq. feet
|
- baths - beds |
show details | |

|
#33
Brd St Un 12
Salem, MA 01970
|
- sq. feet
|
- baths - beds |
show details | |

|
#34
Becket St # 3
Salem, MA 01970
|
- sq. feet
|
- baths - beds |
show details | |

|
#35
Hazel St # 11
Salem, MA 01970
|
- sq. feet
|
- baths - beds |
show details | |

|
#36
Harbor St # 2
Salem, MA 01970
|
- sq. feet
|
- baths - beds |
show details | |

|
#37
Loring Ave Apt 1b
Salem, MA 01970
|
- sq. feet
|
- baths - beds |
show details | |

|
Check over 1 million property listings on Foreclosure.com!
|
browse all offers | |||

Latest news about housing in Salem, MA collected exclusively by city-data.com from local newspapers, TV, and radio stations


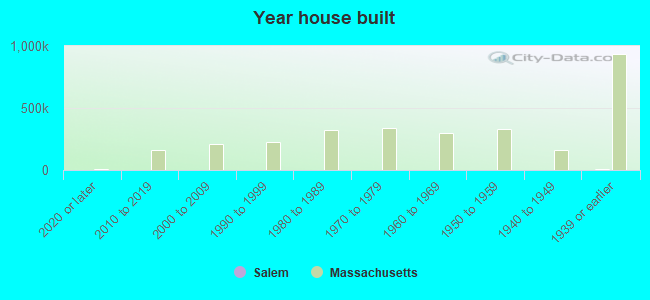
Median year apartment built: 1949
Household type by relationship:
Households: 44,577- Male householders: 7,937 (2,611 living alone), Female householders: 11,965 (4,541 living alone)
7,128 spouses (6,812 opposite-sex spouses), 1,466 unmarried partners, (1,369 opposite-sex unmarried partners), 10,702 children (10,196 natural, 79 adopted, 427 stepchildren), 549 grandchildren, 361 brothers or sisters, 474 parents, 0 foster children, 387 other relatives, 2,190 non-relatives
- In group quarters: 1,413
Size of family households: 5,043 2-persons, 2,410 3-persons, 1,874 4-persons, 447 5-persons, 261 6-persons, 156 7-or-more-persons.
Size of nonfamily households: 7,706 1-person, 1,794 2-persons, 494 3-persons, 7 4-persons, 11 5-persons.
3,831 married couples with children.
2,737 single-parent households (247 men, 2,490 women).
76.5% of residents of Salem speak English at home.
12.9% of residents speak Spanish at home (46% speak English very well, 21% speak English well, 20% speak English not well, 13% don't speak English at all).
6.4% of residents speak other Indo-European language at home (63% speak English very well, 22% speak English well, 14% speak English not well, 1% don't speak English at all).
1.5% of residents speak Asian or Pacific Island language at home (48% speak English very well, 22% speak English well, 25% speak English not well, 4% don't speak English at all).
2.0% of residents speak other language at home (50% speak English very well, 32% speak English well, 16% speak English not well, 1% don't speak English at all).
Foreign born population: 6,958 (15.6%)
(63.9% of them are naturalized citizens)
| Here: | 5.8 |
| State: | 6.5 |
| Here: | 4.0 |
| State: | 4.0 |
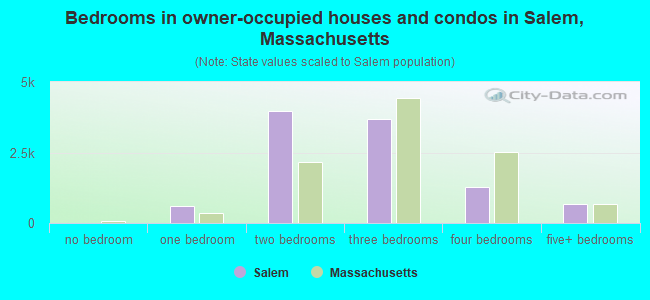
- Bedrooms in owner-occupied houses and condos in Salem, Massachusetts
- 5no bedroom
- 5891 bedroom
- 3,9812 bedrooms
- 3,6793 bedrooms
- 1,2884 bedrooms
- 6625+ bedrooms
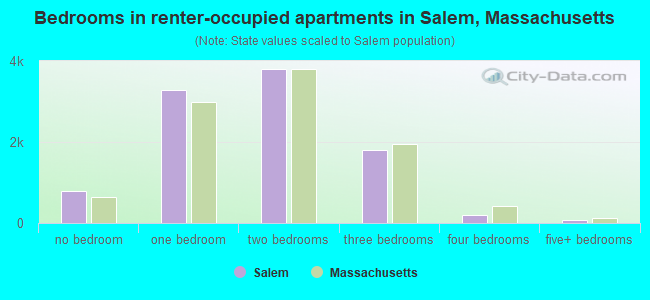
- Bedrooms in renter-occupied apartments in Salem, Massachusetts
- 781no bedroom
- 3,2881 bedroom
- 3,8052 bedrooms
- 1,7973 bedrooms
- 1944 bedrooms
- 705+ bedrooms
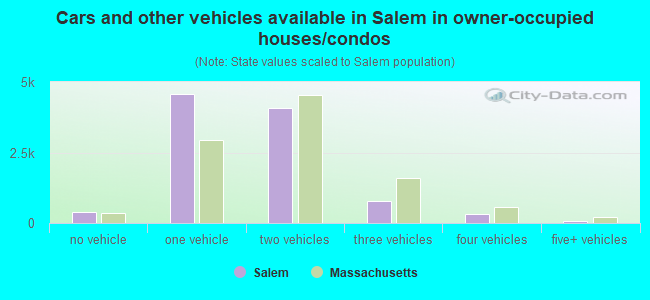
- Cars and other vehicles available in Salem in owner-occupied houses/condos
- 390no vehicle
- 4,5641 vehicle
- 4,0712 vehicles
- 7643 vehicles
- 3354 vehicles
- 815+ vehicles
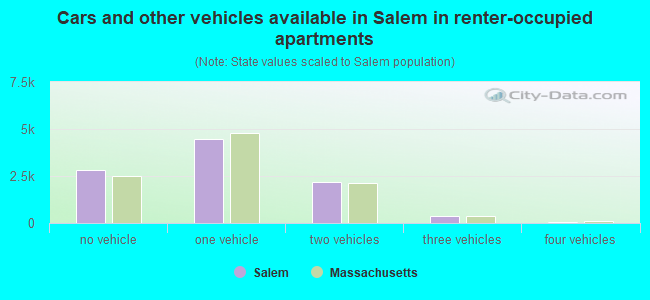
- Cars and other vehicles available in Salem in renter-occupied apartments
- 2,802no vehicle
- 4,4801 vehicle
- 2,1942 vehicles
- 3863 vehicles
- 504 vehicles
- 235+ vehicles
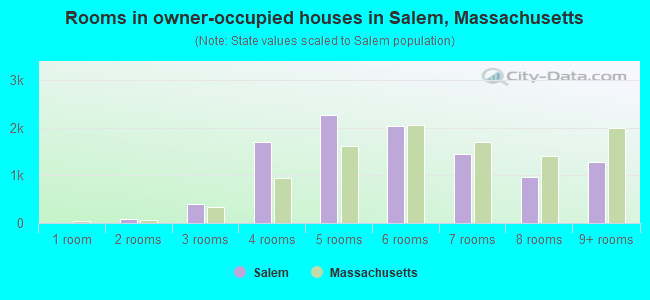
- Rooms in owner-occupied houses in Salem, Massachusetts
- 51 room
- 812 rooms
- 3893 rooms
- 1,6974 rooms
- 2,2715 rooms
- 2,0496 rooms
- 1,4487 rooms
- 9748 rooms
- 1,2919+ rooms
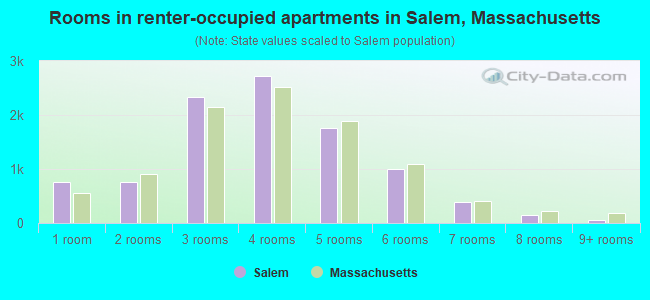
- Rooms in renter-occupied apartments in Salem, Massachusetts
- 7601 room
- 7522 rooms
- 2,3413 rooms
- 2,7234 rooms
- 1,7585 rooms
- 1,0096 rooms
- 3927 rooms
- 1538 rooms
- 479+ rooms
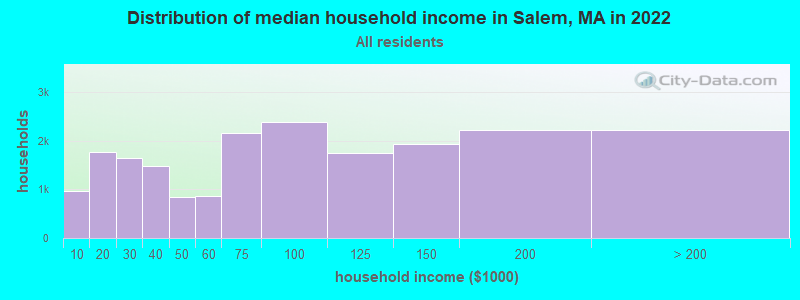
Salem, MA household income distribution

- 974Less than $10,000
- 1,758$10,000 to $19,999
- 1,636$20,000 to $29,999
- 1,470$30,000 to $39,999
- 847$40,000 to $49,999
- 869$50,000 to $59,999
- 2,161$60,000 to $74,999
- 2,384$75,000 to $99,999
- 1,748$100,000 to $124,999
- 1,941$125,000 to $149,999
- 2,218$150,000 to $199,999
- 2,223$200,000 or more
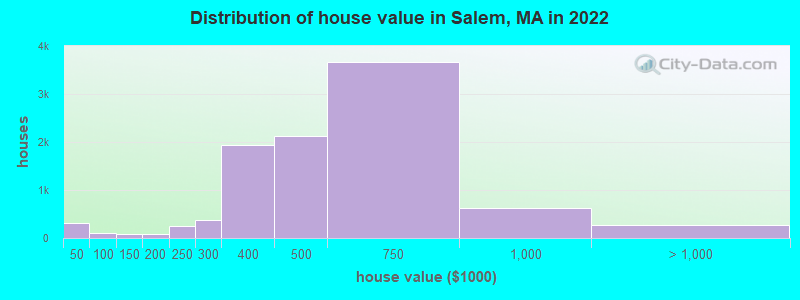
Home value of owner - occupied houses in 2022 in Salem, MA
-
- 282Less than $10,000
- 15$30,000 to $34,999
- 5$35,000 to $39,999
- 9$40,000 to $49,999
- 13$60,000 to $69,999
- 82$80,000 to $89,999
- 68$100,000 to $124,999
- 17$125,000 to $149,999
- 32$150,000 to $174,999
- 46$175,000 to $199,999
- 251$200,000 to $249,999
- 367$250,000 to $299,999
- 1,928$300,000 to $399,999
- 2,135$400,000 to $499,999
- 3,676$500,000 to $749,999
- 621$750,000 to $999,999
- 212$1,000,000 to $1,499,999
- 61$2,000,000 or more
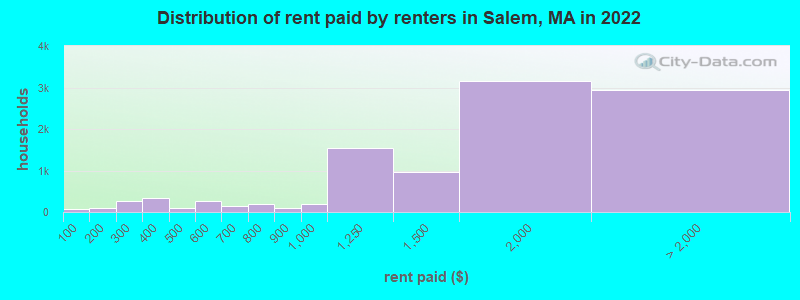
Rent paid by renters in 2022 in Salem, MA
-
- 71Less than $100
- 53$100 to $149
- 50$150 to $199
- 191$200 to $249
- 81$250 to $299
- 317$300 to $349
- 19$350 to $399
- 95$400 to $449
- 265$500 to $549
- 9$550 to $599
- 120$600 to $649
- 33$650 to $699
- 99$700 to $749
- 82$750 to $799
- 108$800 to $899
- 192$900 to $999
- 1,550$1,000 to $1,249
- 975$1,250 to $1,499
- 3,158$1,500 to $1,999
- 1,851$2,000 to $2,499
- 659$2,500 to $2,999
- 221$3,000 to $3,499
- 71$3,500 or more
- 128No cash rent
Percentage of workers working in this county: 72.5%
Number of people working at home: 5,082 (19.9% of all workers)
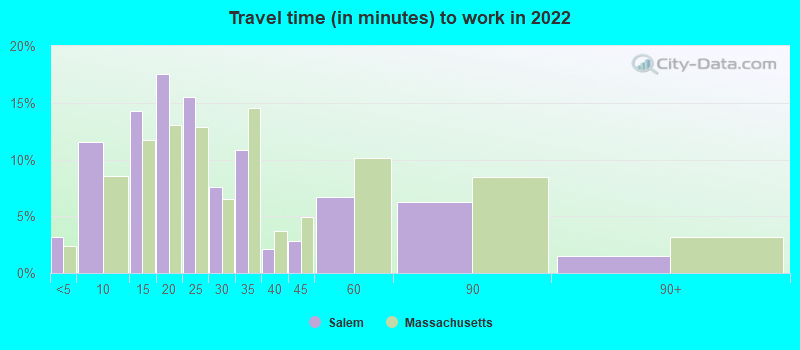
Travel time to work (commute)
- Less than 5 minutes: 422
- 5 to 9 minutes: 2,059
- 10 to 14 minutes: 2,468
- 15 to 19 minutes: 3,542
- 20 to 24 minutes: 2,623
- 25 to 29 minutes: 877
- 30 to 34 minutes: 2,285
- 35 to 39 minutes: 424
- 40 to 44 minutes: 934
- 45 to 59 minutes: 1,601
- 60 to 89 minutes: 2,543
- 90 or more minutes: 703
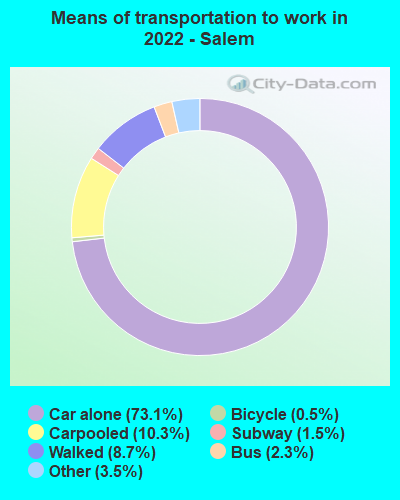
Means of transportation to work:
- Drove a car alone: 12,230 (57.2%)
- Carpooled: 1,310 (6.1%)
- Bus: 319 (1.5%)
- Subway or elevated rail: 11 (0.1%)
- Long-distance train or commuter rail: 239 (1.1%)
- Taxi: 880 (4.1%)
- Bicycle: 121 (0.6%)
- Walked: 1,302 (6.1%)
- Worked at home: 5,082 (23.8%)
- Unemployment by race in 2022
- Unemployment rate for White non-Hispanic residents
- 3.5%Males
- 1.9%Females
- Unemployment rate for Black residents
- 1.5%Males
- 12.2%Females
- Unemployment rate for American Indian and Alaska Native residents
- 100.0%Females
- Unemployment rate for other race residents
- 3.0%Males
- 1.7%Females
- Unemployment rate for two or more race residents
- 0.9%Males
- 1.6%Females
- Unemployment rate for Hispanic or Latino residents
- 2.5%Males
- 8.2%Females
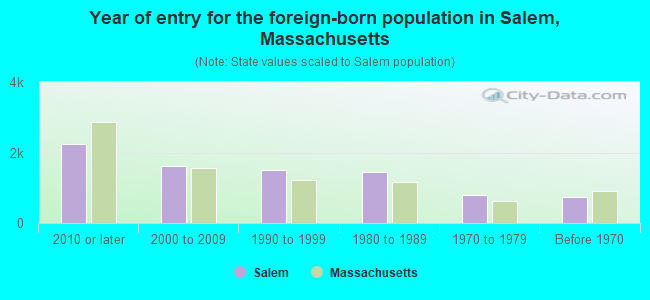
- Year of entry for the foreign-born population in Salem, Massachusetts
- 2,2292010 or later
- 1,6142000 to 2009
- 1,5041990 to 1999
- 1,4561980 to 1989
- 8011970 to 1979
- 740Before 1970
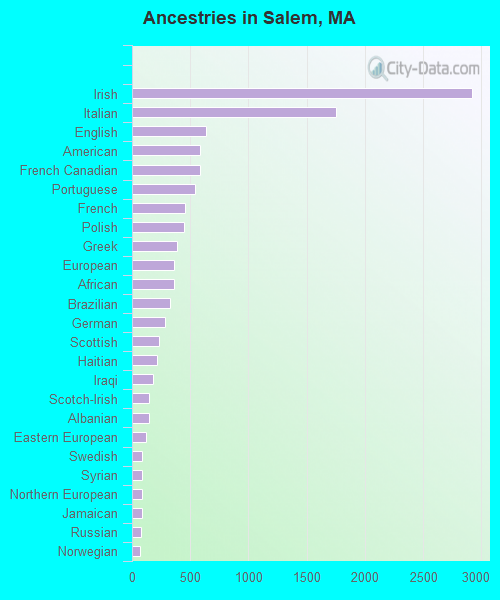
First ancestries reported:
- Irish: 2,920 (14.3%)
- Italian: 1,756 (8.6%)
- English: 638 (3.1%)
- American: 588 (2.9%)
- French Canadian: 587 (2.9%)
- Portuguese: 545 (2.7%)
- French: 451 (2.2%)
- Polish: 443 (2.2%)
- Greek: 389 (1.9%)
- European: 364 (1.8%)
- African: 358 (1.8%)
- Brazilian: 325 (1.6%)
- German: 287 (1.4%)
- Scottish: 235 (1.1%)
- Haitian: 219 (1.1%)
- Iraqi: 177 (0.9%)
- Scotch-Irish: 146 (0.7%)
- Albanian: 143 (0.7%)
- Eastern European: 122 (0.6%)
- Swedish: 90 (0.4%)
- Syrian: 88 (0.4%)
- Northern European: 87 (0.4%)
- Jamaican: 85 (0.4%)
- Russian: 79 (0.4%)
- Norwegian: 69 (0.3%)
- Romanian: 69 (0.3%)
- Ukrainian: 67 (0.3%)
- Finnish: 59 (0.3%)
- Yugoslavian: 59 (0.3%)
- Canadian: 57 (0.3%)
- Cape Verdean: 51 (0.2%)
- Moroccan: 49 (0.2%)
- Turkish: 40 (0.2%)
- Danish: 32 (0.2%)
- Swiss: 32 (0.2%)
- Nigerian: 31 (0.2%)
- Hungarian: 30 (0.1%)
- Armenian: 26 (0.1%)
- Scandinavian: 26 (0.1%)
- Cypriot: 25 (0.1%)
- British: 24 (0.1%)
- Trinidadian and Tobagonian: 23 (0.1%)
- Lebanese: 20 (0.10%)
- Iranian: 18 (0.09%)
- Welsh: 15 (0.07%)
- Dutch: 12 (0.06%)
- Jordanian: 11 (0.05%)
- Czech: 9 (0.04%)
- Czechoslovakian: 8 (0.04%)
- British West Indian: 8 (0.04%)
- Lithuanian: 4 (0.02%)
- Guyanese: 3 (0.01%)
Most common places of birth for foreign-born residents (%):
| Salem: | 38.3% (2,573) |
| Massachusetts: | 8.3% (101,767) |
| Salem: | 10.6% (710) |
| Massachusetts: | 7.6% (92,959) |
| Salem: | 4.4% (296) |
| Massachusetts: | 0.2% (2,679) |
| Salem: | 2.7% (182) |
| Massachusetts: | 1.1% (13,065) |
| Salem: | 2.5% (165) |
| Massachusetts: | 8.4% (103,233) |
| Salem: | 2.3% (153) |
| Massachusetts: | 1.7% (21,468) |
| Salem: | 2.1% (143) |
| Massachusetts: | 2.3% (27,810) |
| Salem: | 2.1% (140) |
| Massachusetts: | 3.7% (45,667) |
| Salem: | 1.8% (123) |
| Massachusetts: | 0.4% (4,735) |
| Salem: | 1.8% (121) |
| Massachusetts: | 4.9% (60,432) |
| Salem: | 1.8% (119) |
| Massachusetts: | 0.4% (4,660) |
| Salem: | 1.7% (116) |
| Massachusetts: | 0.8% (10,043) |
| Salem: | 1.7% (113) |
| Massachusetts: | 3.0% (37,197) |
| Salem: | 1.6% (110) |
| Massachusetts: | 0.9% (10,810) |
Place of birth for U.S.-born residents:
- This state: 27,011
- Other state: 9,266
- Northeast: 5,059
- Midwest: 1,504
- South: 1,748
- West: 942
90.0% of Salem residents lived in the same house 1 years ago.
Out of people who lived in different houses, 33.6% lived in this county.
Out of people who lived in different counties, 65.7% lived in Massachusetts.
| Salem: | 90.0% |
| State average: | 87.7% |
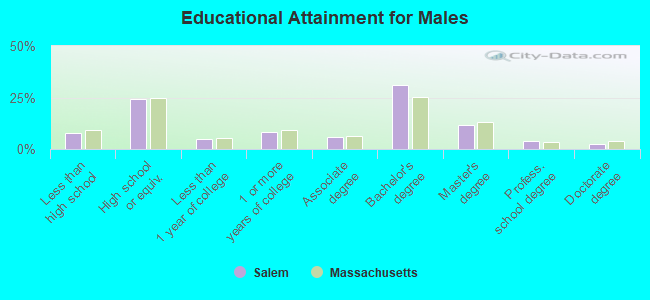
Education attainment for males 25 years and older:
- No schooling: 140
- Nursery to 4th grade: 185
- 5th and 6th grade: 74
- 7th and 8th grade: 124
- 9th grade: 100
- 10th grade: 161
- 11th grade: 103
- 12th grade, no diploma: 215
- High school graduate (or equivalency): 3,493
- Less than 1 year of college: 699
- Some college more than 1 year, no degree: 1,175
- Associate degree: 826
- Bachelor's degree: 4,419
- Master's degree: 1,672
- Professional school degree: 539
- Doctorate degree: 332
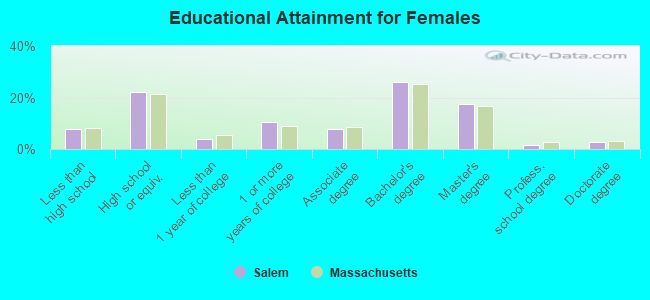
Education attainment for females 25 years and older:
- No schooling: 434
- Nursery to 4th grade: 123
- 5th and 6th grade: 106
- 7th and 8th grade: 181
- 9th grade: 88
- 10th grade: 44
- 11th grade: 158
- 12th grade, no diploma: 247
- High school graduate (or equivalency): 3,987
- Less than 1 year of college: 695
- Some college more than 1 year, no degree: 1,917
- Associate degree: 1,378
- Bachelor's degree: 4,690
- Master's degree: 3,172
- Professional school degree: 298
- Doctorate degree: 506


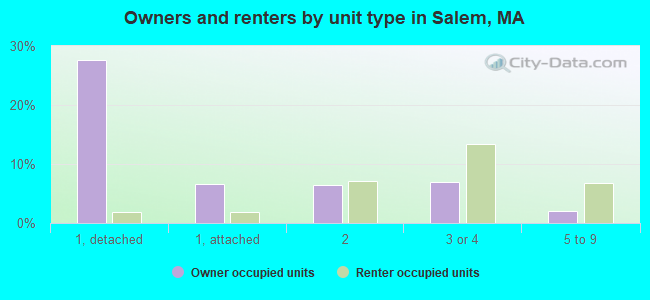
Housing units in structures:
- One, detached: 5,424
- One, attached: 1,479
- Two: 3,605
- 3 or 4: 4,100
- 5 to 9: 2,194
- 10 to 19: 1,036
- 20 to 49: 1,374
- 50 or more: 2,040
- Boats, RVs, vans, etc.: 38
Housing units lacking complete kitchen facilities in 2022: 1.0%
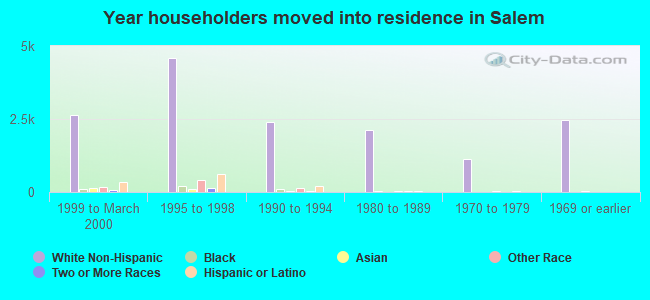
House/condo owner moved in on average 10 years ago
Renter moved in on average 3 years ago
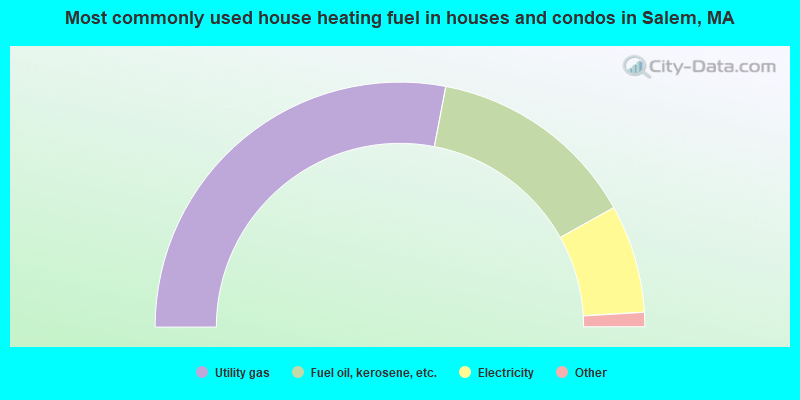
- 56.0%Utility gas
- 27.8%Fuel oil, kerosene, etc.
- 14.3%Electricity
- 1.2%Bottled, tank, or LP gas
- 0.4%Wood
- 0.3%Other fuel
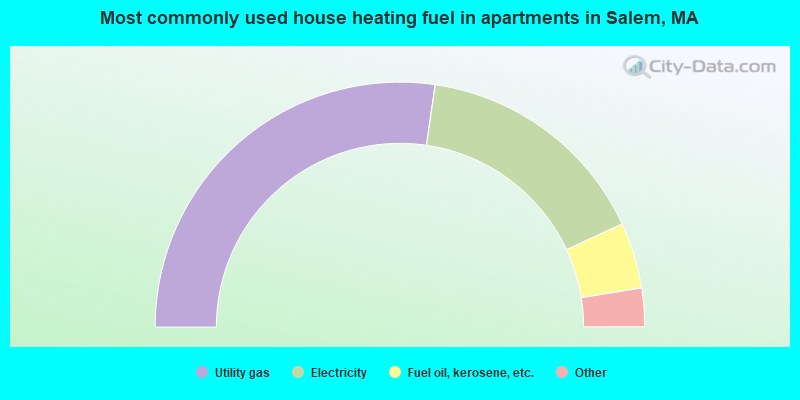
- 54.6%Utility gas
- 31.6%Electricity
- 8.7%Fuel oil, kerosene, etc.
- 2.5%Bottled, tank, or LP gas
- 2.4%No fuel used
- 0.1%Wood
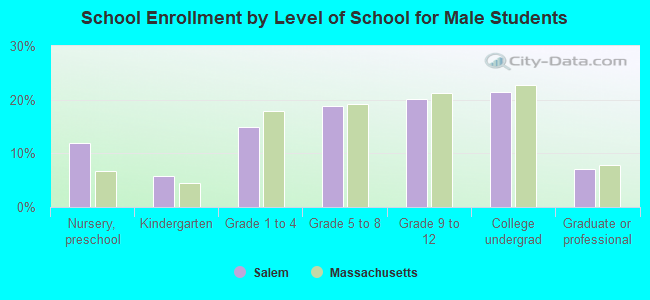
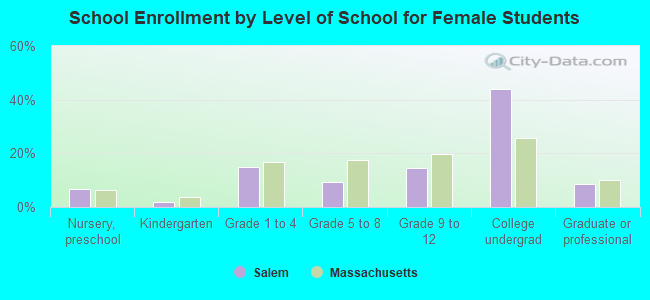
Private vs. public school enrollment:
| Here: | 10.6% |
| Massachusetts: | 10.3% |
| Here: | 23.3% |
| Massachusetts: | 12.3% |
| Here: | 35.6% |
| Massachusetts: | 51.2% |