Rye, NY (New York) Houses and Residents
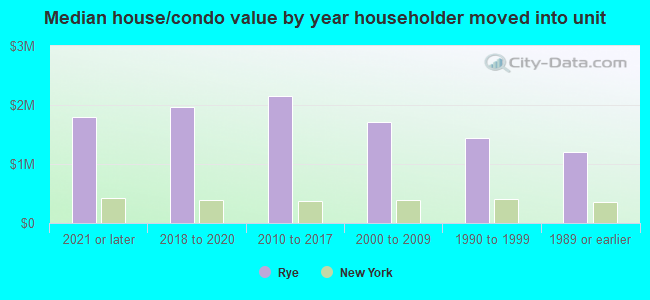
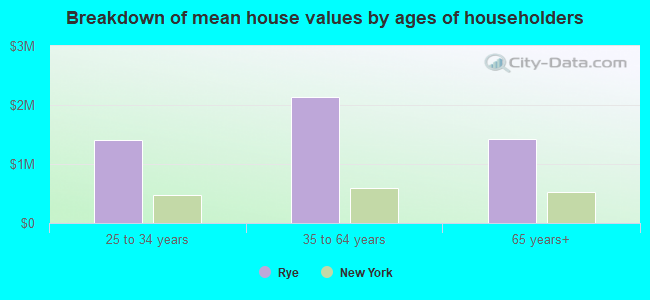
| Rye: | $1,771,287 |
| New York: | $400,400 |
Total population: 16,000 (Urban population: 14,932, Rural population: 23 (all nonfarm))
Houses: 6,302 (5,957 occupied: 4,257 owner occupied, 1,714 renter occupied)
| % of renters here: | 29% |
| State: | 46% |
Housing density: 1,091 houses/condos per square mile
Median price asked for vacant for-sale houses and condos in 2022: $241,430.
Median contract rent in 2022: over $2,000
Median rent asked for vacant for-rent units in 2022: $1,214
Median gross rent in Rye, NY in 2022: over $2,000
Housing units in Rye with a mortgage: 2,721 (504 second mortgage, 0 home equity loan, 486 both second mortgage and home equity loan)
Houses without a mortgage: 196
Median household income for houses/condos with a mortgage: $249,777
Median household income for apartments without a mortgage: $193,216
Median monthly housing costs: $3,578
Compare current foreclosures near Rye, NY:
| Photo | Address | Area | Beds / Baths | Price | Details |
|---|---|---|---|---|---|

|
#1
Milton Rd
Rye, NY 10580
|
3,241 sq. feet
|
3 baths 4 beds |
show details | |

|
#2
Park Dr S
Rye, NY 10580
|
5,288 sq. feet
|
5 baths 6 beds |
show details | |

|
#3
Purchase St
Rye, NY 10580
|
5,477 sq. feet
|
6 baths 4 beds |
show details | |

|
#4
Goldwin St
Rye, NY 10580
|
1,638 sq. feet
|
2 baths 3 beds |
show details | |

|
#5
Green Ave
Rye, NY 10580
|
2,991 sq. feet
|
4 baths 5 beds |
show details | |

|
#6
Midland Ave
Rye, NY 10580
|
1,621 sq. feet
|
1 baths 3 beds |
show details | |

|
#7
Maple Ave
Rye, NY 10580
|
2,736 sq. feet
|
3 baths 7 beds |
show details | |

|
#8
Puritan Rd
Rye, NY 10580
|
5,330 sq. feet
|
4 baths - beds |
show details | |

|
#9
Mount Holly Dr
Rye, NY 10580
|
6,218 sq. feet
|
6 baths - beds |
show details | |

|
#10
Elm Pl
Rye, NY 10580
|
- sq. feet
|
- baths - beds |
show details |
| Photo | Address | Area | Beds / Baths | Price | Details |
|---|---|---|---|---|---|

|
#11
Waters Edge
Rye, NY 10580
|
- sq. feet
|
- baths - beds |
show details | |

|
#12
Waters Edge
Rye, NY 10580
|
- sq. feet
|
- baths - beds |
show details | |

|
#13
Theodore Fremd Ave Apt A6
Rye, NY 10580
|
- sq. feet
|
- baths - beds |
show details | |

|
#14
Redfield St
Rye, NY 10580
|
- sq. feet
|
- baths - beds |
show details | |

|
#15
Edcris Ln
Huntington, NY 11743
|
1,450 sq. feet
|
2 baths 3 beds |
$550,000
|
show details |

|
#16
Swinton Ave
Bronx, NY 10465
|
1,938 sq. feet
|
2 baths 3 beds |
$789,900
|
show details |

|
#17
Riverdale Ave
Port Chester, NY 10573
|
1,616 sq. feet
|
1 baths 3 beds |
$639,900
|
show details |

|
#18
72nd Avenue
Bellerose, NY 11426
|
850 sq. feet
|
1 baths 1 beds |
$259,900
|
show details |

|
#19
Olinville Ave Apt 11c
Bronx, NY 10467
|
1,000 sq. feet
|
2 baths 3 beds |
$385,000
|
show details |

|
#20
Grand Concourse Apt 3c
Bronx, NY 10452
|
700 sq. feet
|
1 baths 1 beds |
$184,500
|
show details |
| Photo | Address | Area | Beds / Baths | Price | Details |
|---|---|---|---|---|---|

|
#21
Dartmouth St
Westbury, NY 11590
|
1,772 sq. feet
|
1 baths 4 beds |
$499,200
|
show details |

|
#22
Sandy Hill Rd
Oyster Bay, NY 11771
|
9,672 sq. feet
|
6 baths 9 beds |
$1,394,900
|
show details |

|
#23
Tulip Ave # Gl2
Floral Park, NY 11001
|
1,200 sq. feet
|
1 baths 2 beds |
$409,900
|
show details |

|
#24
E 221st St
Bronx, NY 10467
|
1,890 sq. feet
|
2 baths 3 beds |
$554,900
|
show details |

|
#25
Sylvan Knoll Rd
Stamford, CT 06902
|
1,100 sq. feet
|
1 baths 2 beds |
$339,900
|
show details |

|
#26
N Broadway
Irvington, NY 10533
|
850 sq. feet
|
1 baths 2 beds |
$315,000
|
show details |

|
#27
Limerick St
Stamford, CT 06902
|
1,382 sq. feet
|
4 baths 5 beds |
$919,900
|
show details |

|
#28
Davenport Ave Apt 1b
New Rochelle, NY 10805
|
750 sq. feet
|
1 baths 1 beds |
$159,900
|
show details |

|
#29
Crane Ave
White Plains, NY 10603
|
2,400 sq. feet
|
2 baths 4 beds |
$654,500
|
show details |

|
#30
Martin Dr
Harrington Park, NJ 07640
|
1,746 sq. feet
|
3 baths 3 beds |
$950,000
|
show details |
| Photo | Address | Area | Beds / Baths | Price | Details |
|---|---|---|---|---|---|

|
#31
Midland Ave Apt 4h
Bronxville, NY 10708
|
900 sq. feet
|
1 baths 1 beds |
$184,000
|
show details |

|
#32
Central Park Ave Apt 9m
Yonkers, NY 10710
|
1,300 sq. feet
|
2 baths 3 beds |
$319,900
|
show details |

|
#33
6th Ave Apt A
Huntington Station, NY 11746
|
3,300 sq. feet
|
4 baths 7 beds |
$999,900
|
show details |

|
#34
W Sidney Ave
Mount Vernon, NY 10550
|
2,800 sq. feet
|
3 baths 8 beds |
$454,900
|
show details |

|
#35
N Broadway Apt A6
Yonkers, NY 10701
|
950 sq. feet
|
2 baths 2 beds |
$219,900
|
show details |

|
#36
Fordham Hill Oval Apt 12d
Bronx, NY 10468
|
850 sq. feet
|
1 baths 1 beds |
$179,900
|
show details |

|
#37
Fordham Hill Oval
Bronx, NY 10468
|
700 sq. feet
|
1 baths 1 beds |
$154,900
|
show details |

|
#38
Fox Island Rd
Port Chester, NY 10573
|
- sq. feet
|
6 baths 6 beds |
$910,000
|
show details |

|
#39
17th Ave 1st Floor
Whitestone, NY 11357
|
610 sq. feet
|
1 baths 1 beds |
$229,900
|
show details |

|
#40
11th Ave
Huntington Station, NY 11746
|
- sq. feet
|
2 baths 4 beds |
$399,000
|
show details |
| Photo | Address | Area | Beds / Baths | Price | Details |
|---|---|---|---|---|---|

|
#41
Raven Ct
Armonk, NY 10504
|
- sq. feet
|
2 baths 3 beds |
$1,560,000
|
show details |

|
#42
Tuttle St
Stamford, CT 06902
|
- sq. feet
|
1 baths 3 beds |
$262,500
|
show details |

|
#43
Talmadge Hill Rd
Darien, CT 06820
|
- sq. feet
|
4 baths 5 beds |
$2,275,250
|
show details |

|
#44
Arlington Ave Apt 11n
Bronx, NY 10471
|
500 sq. feet
|
- baths 1 beds |
$179,900
|
show details |

|
#45
County Center Rd
White Plains, NY 10603
|
- sq. feet
|
2 baths 3 beds |
$540,800
|
show details |

|
#46
Washington Ave
New Rochelle, NY 10801
|
2,445 sq. feet
|
3 baths 8 beds |
show details | |

|
#47
Cutler Rd
Greenwich, CT 06831
|
4,702 sq. feet
|
5 baths 5 beds |
show details | |

|
#48
Twinlawns Ave
Hicksville, NY 11801
|
1,847 sq. feet
|
2 baths 5 beds |
show details | |

|
#49
Hunters Run
Dobbs Ferry, NY 10522
|
1,046 sq. feet
|
1 baths 1 beds |
show details | |

|
Check over 1 million property listings on Foreclosure.com!
|
browse all offers | |||

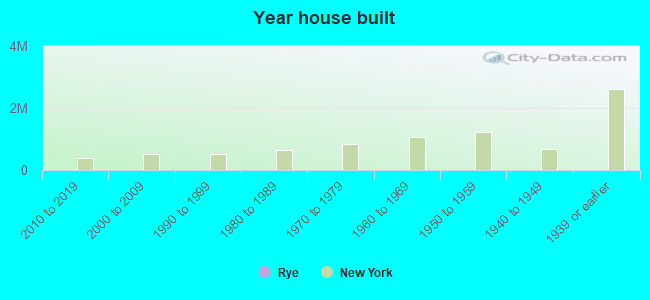
Latest news about housing in Rye, NY collected exclusively by city-data.com from local newspapers, TV, and radio stations


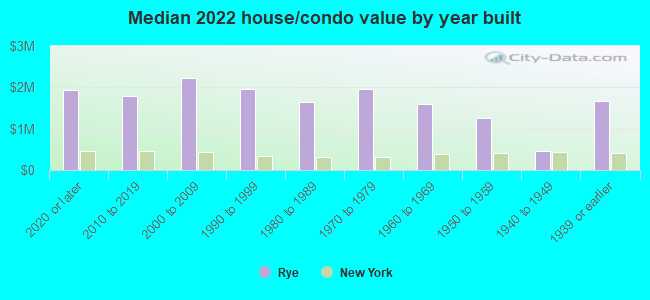
Median year apartment built: 1960
Household type by relationship:
Households: 16,323- Male householders: 2,751 (411 living alone), Female householders: 3,084 (896 living alone)
3,676 spouses (3,626 opposite-sex spouses), 193 unmarried partners, (193 opposite-sex unmarried partners), 6,095 children (5,971 natural, 86 adopted, 37 stepchildren), 58 grandchildren, 0 brothers or sisters, 33 parents, 0 foster children, 89 other relatives, 192 non-relatives
- In group quarters: 147
Size of family households: 1,276 2-persons, 909 3-persons, 1,236 4-persons, 731 5-persons, 126 6-persons, 15 7-or-more-persons.
Size of nonfamily households: 1,421 1-person, 210 2-persons, 5 3-persons, 9 5-persons.
4,059 married couples with children.
445 single-parent households (225 men, 220 women).
78.9% of residents of Rye speak English at home.
6.9% of residents speak Spanish at home (89% speak English very well, 11% speak English well, 1% speak English not well).
8.5% of residents speak other Indo-European language at home (85% speak English very well, 10% speak English well, 4% speak English not well, 1% don't speak English at all).
4.3% of residents speak Asian or Pacific Island language at home (73% speak English very well, 16% speak English well, 11% speak English not well, 1% don't speak English at all).
0.4% of residents speak other language at home (100% speak English very well).
Foreign born population: 3,333 (20.4%)
(60.9% of them are naturalized citizens)
| Here: | 9.7 |
| State: | 6.3 |
| Here: | 3.9 |
| State: | 3.8 |
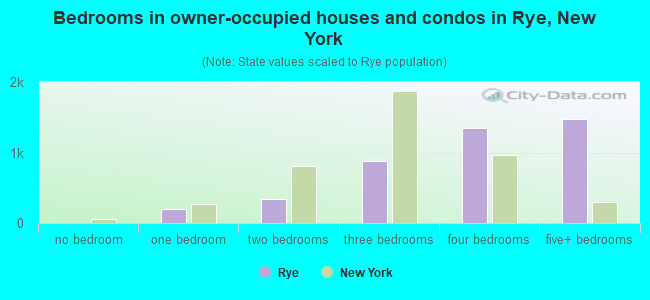
- Bedrooms in owner-occupied houses and condos in Rye, New York
- 0no bedroom
- 2041 bedroom
- 3372 bedrooms
- 8823 bedrooms
- 1,3534 bedrooms
- 1,4825+ bedrooms
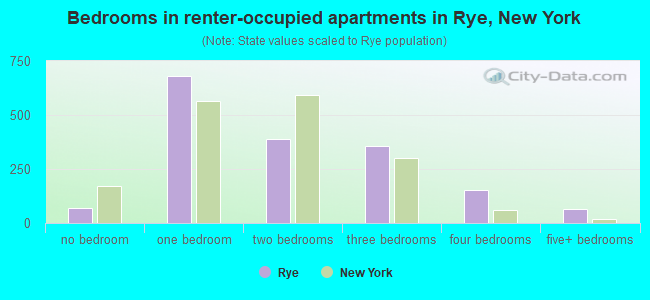
- Bedrooms in renter-occupied apartments in Rye, New York
- 71no bedroom
- 6791 bedroom
- 3882 bedrooms
- 3553 bedrooms
- 1534 bedrooms
- 675+ bedrooms
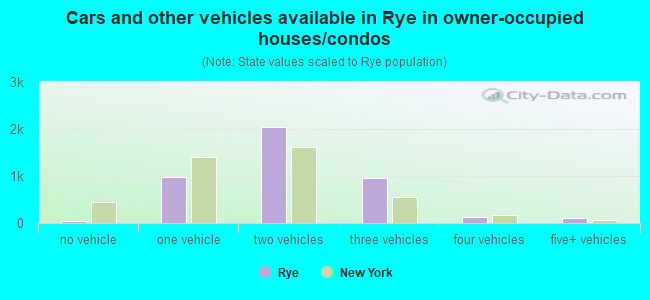
- Cars and other vehicles available in Rye in owner-occupied houses/condos
- 35no vehicle
- 9761 vehicle
- 2,0512 vehicles
- 9663 vehicles
- 1294 vehicles
- 1025+ vehicles
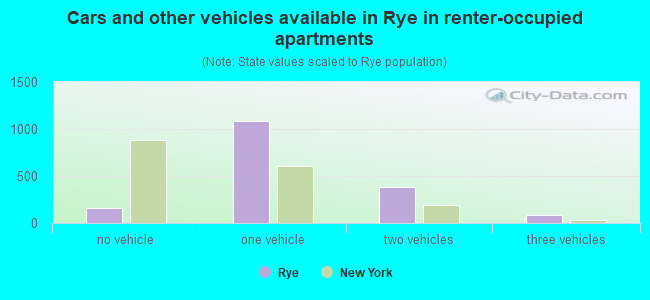
- Cars and other vehicles available in Rye in renter-occupied apartments
- 161no vehicle
- 1,0831 vehicle
- 3812 vehicles
- 803 vehicles
- 94 vehicles
- 05+ vehicles
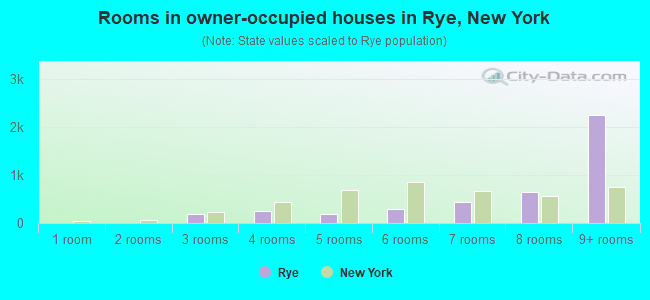
- Rooms in owner-occupied houses in Rye, New York
- 01 room
- 02 rooms
- 1813 rooms
- 2584 rooms
- 1915 rooms
- 2856 rooms
- 4457 rooms
- 6508 rooms
- 2,2489+ rooms
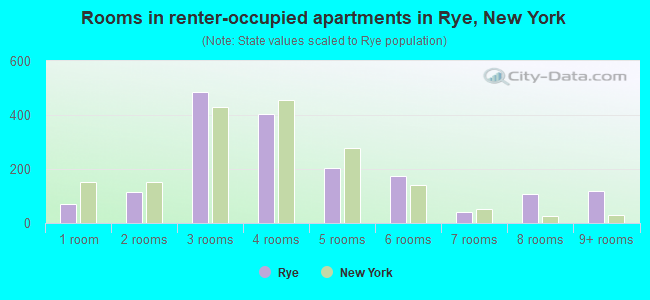
- Rooms in renter-occupied apartments in Rye, New York
- 711 room
- 1142 rooms
- 4873 rooms
- 4024 rooms
- 2025 rooms
- 1746 rooms
- 397 rooms
- 1098 rooms
- 1189+ rooms
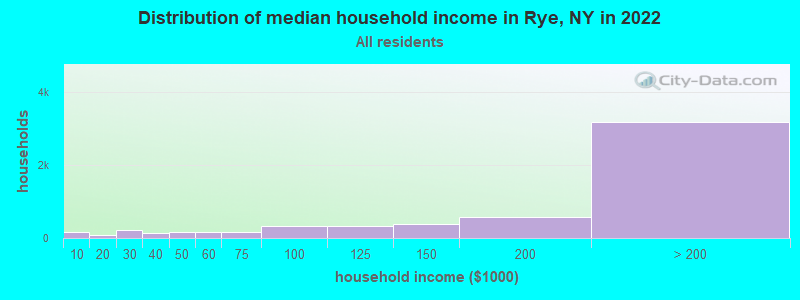
Rye, NY household income distribution

- 163Less than $10,000
- 79$10,000 to $19,999
- 208$20,000 to $29,999
- 135$30,000 to $39,999
- 152$40,000 to $49,999
- 169$50,000 to $59,999
- 177$60,000 to $74,999
- 323$75,000 to $99,999
- 316$100,000 to $124,999
- 389$125,000 to $149,999
- 575$150,000 to $199,999
- 3,173$200,000 or more
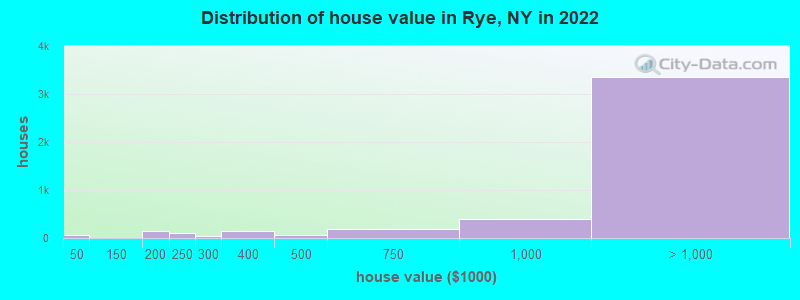
Home value of owner - occupied houses in 2022 in Rye, NY
-
- 52Less than $10,000
- 3$30,000 to $34,999
- 98$150,000 to $174,999
- 37$175,000 to $199,999
- 97$200,000 to $249,999
- 48$250,000 to $299,999
- 145$300,000 to $399,999
- 60$400,000 to $499,999
- 182$500,000 to $749,999
- 396$750,000 to $999,999
- 674$1,000,000 to $1,499,999
- 950$1,500,000 to $1,999,999
- 1,732$2,000,000 or more
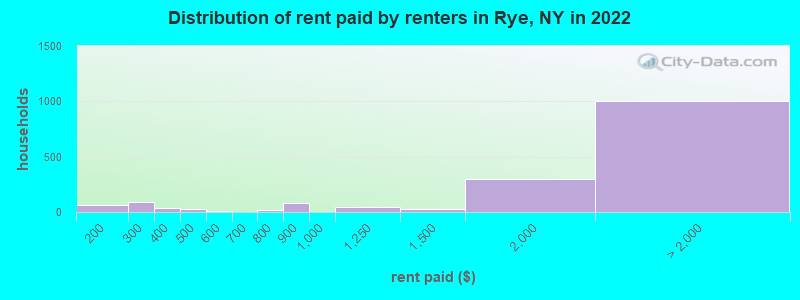
Rent paid by renters in 2022 in Rye, NY
-
- 61$150 to $199
- 86$200 to $249
- 33$300 to $349
- 23$450 to $499
- 9$550 to $599
- 18$700 to $749
- 77$800 to $899
- 45$1,000 to $1,249
- 28$1,250 to $1,499
- 294$1,500 to $1,999
- 264$2,000 to $2,499
- 216$2,500 to $2,999
- 133$3,000 to $3,499
- 367$3,500 or more
- 20No cash rent
Percentage of workers working in this county: 59.8%
Number of people working at home: 2,211 (29.4% of all workers)
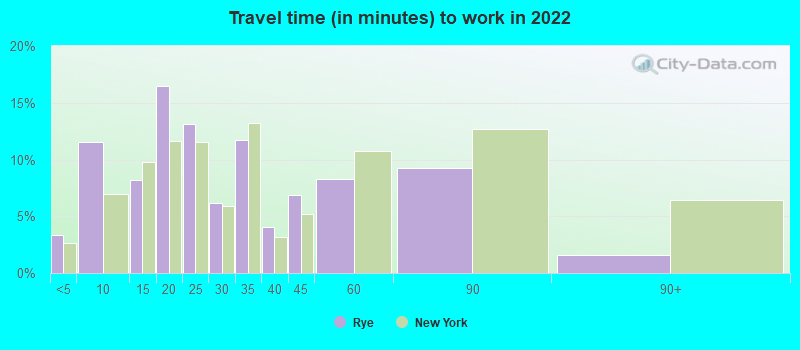
Travel time to work (commute)
- Less than 5 minutes: 149
- 5 to 9 minutes: 606
- 10 to 14 minutes: 303
- 15 to 19 minutes: 742
- 20 to 24 minutes: 381
- 25 to 29 minutes: 322
- 30 to 34 minutes: 201
- 35 to 39 minutes: 161
- 40 to 44 minutes: 167
- 45 to 59 minutes: 546
- 60 to 89 minutes: 1,627
- 90 or more minutes: 249
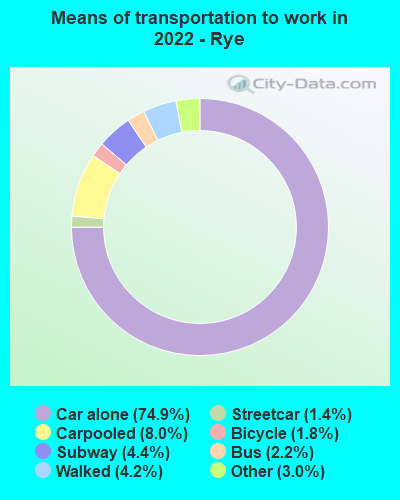
Means of transportation to work:
- Drove a car alone: 6,534 (59.3%)
- Carpooled: 709 (6.4%)
- Bus: 167 (1.5%)
- Subway or elevated rail: 156 (1.4%)
- Long-distance train or commuter rail: 285 (2.6%)
- Taxi: 458 (4.2%)
- Bicycle: 199 (1.8%)
- Walked: 365 (3.3%)
- Worked at home: 2,211 (20.1%)
- Unemployment by race in 2022
- Unemployment rate for White non-Hispanic residents
- 2.2%Males
- 1.6%Females
- Unemployment rate for Black residents
- 26.9%Females
- Unemployment rate for Asian residents
- 6.3%Males
- 4.6%Females
- Unemployment rate for other race residents
- 22.7%Males
- 17.1%Females
- Unemployment rate for two or more race residents
- 8.9%Males
- Unemployment rate for Hispanic or Latino residents
- 30.3%Males
- 9.5%Females
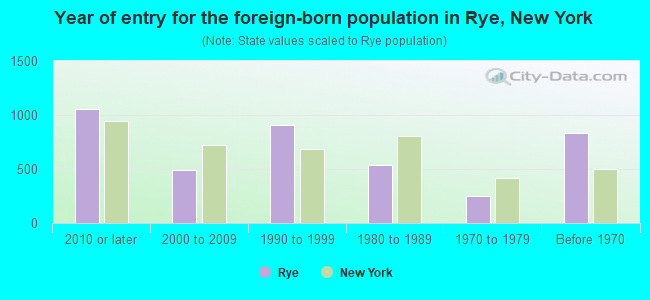
- Year of entry for the foreign-born population in Rye, New York
- 1,0582010 or later
- 4892000 to 2009
- 9111990 to 1999
- 5381980 to 1989
- 2521970 to 1979
- 834Before 1970
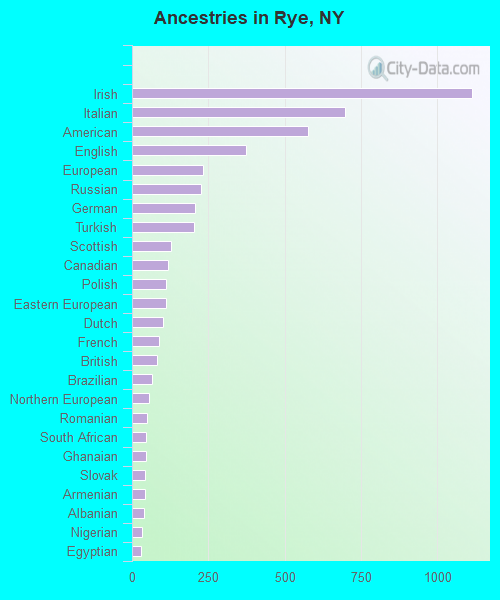
First ancestries reported:
- Irish: 1,113 (15.8%)
- Italian: 697 (9.9%)
- American: 576 (8.2%)
- English: 373 (5.3%)
- European: 233 (3.3%)
- Russian: 227 (3.2%)
- German: 206 (2.9%)
- Turkish: 204 (2.9%)
- Scottish: 129 (1.8%)
- Canadian: 117 (1.7%)
- Polish: 112 (1.6%)
- Eastern European: 112 (1.6%)
- Dutch: 100 (1.4%)
- French: 89 (1.3%)
- British: 82 (1.2%)
- Brazilian: 67 (1.0%)
- Northern European: 55 (0.8%)
- Romanian: 48 (0.7%)
- South African: 47 (0.7%)
- Ghanaian: 45 (0.6%)
- Slovak: 44 (0.6%)
- Armenian: 43 (0.6%)
- Albanian: 38 (0.5%)
- Nigerian: 32 (0.5%)
- Egyptian: 30 (0.4%)
- Serbian: 29 (0.4%)
- Ukrainian: 26 (0.4%)
- Lebanese: 23 (0.3%)
- Swedish: 23 (0.3%)
- Portuguese: 22 (0.3%)
- Finnish: 21 (0.3%)
- Iranian: 21 (0.3%)
- Scotch-Irish: 19 (0.3%)
- Moroccan: 17 (0.2%)
- Austrian: 17 (0.2%)
- French Canadian: 16 (0.2%)
- Belgian: 16 (0.2%)
- Bulgarian: 13 (0.2%)
- Norwegian: 12 (0.2%)
- Czech: 10 (0.1%)
- Swiss: 8 (0.1%)
- Hungarian: 6 (0.09%)
- African: 6 (0.09%)
- Australian: 4 (0.06%)
- Lithuanian: 4 (0.06%)
- Jamaican: 1 (0.01%)
Most common places of birth for foreign-born residents (%):
| Rye: | 9.1% (299) |
| New York: | 0.8% (33,869) |
| Rye: | 8.3% (275) |
| New York: | 0.6% (28,472) |
| Rye: | 8.0% (265) |
| New York: | 1.3% (59,107) |
| Rye: | 5.9% (194) |
| New York: | 9.1% (410,910) |
| Rye: | 3.9% (129) |
| New York: | 0.2% (8,010) |
| Rye: | 3.4% (111) |
| New York: | 1.8% (81,374) |
| Rye: | 3.2% (105) |
| New York: | 4.8% (214,559) |
| Rye: | 2.7% (90) |
| New York: | 1.8% (82,786) |
| Rye: | 2.7% (88) |
| New York: | 0.7% (30,658) |
| Rye: | 2.5% (84) |
| New York: | 11.1% (501,040) |
| Rye: | 2.5% (83) |
| New York: | 0.5% (23,058) |
| Rye: | 2.2% (73) |
| New York: | 0.5% (21,009) |
| Rye: | 2.1% (70) |
| New York: | 1.7% (78,421) |
| Rye: | 2.1% (70) |
| New York: | 1.7% (75,802) |
| Rye: | 2.1% (69) |
| New York: | 0.9% (38,713) |
| Rye: | 2.1% (68) |
| New York: | 0.1% (5,189) |
| Rye: | 1.9% (63) |
| New York: | 0.6% (26,772) |
| Rye: | 1.9% (62) |
| New York: | 2.6% (117,288) |
| Rye: | 1.8% (58) |
| New York: | 0.3% (14,949) |
| Rye: | 1.7% (55) |
| New York: | 0.1% (4,429) |
| Rye: | 1.6% (53) |
| New York: | 0.6% (25,782) |
Place of birth for U.S.-born residents:
- This state: 7,923
- Other state: 4,381
- Northeast: 2,492
- Midwest: 698
- South: 644
- West: 514
90.8% of Rye residents lived in the same house 1 years ago.
Out of people who lived in different houses, 36.4% lived in this county.
Out of people who lived in different counties, 74.2% lived in New York.
| Rye: | 90.8% |
| State average: | 89.6% |
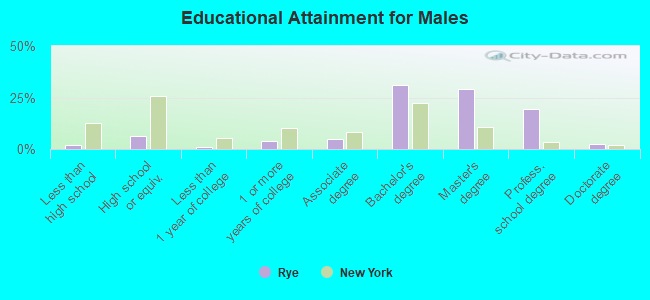
Education attainment for males 25 years and older:
- No schooling: 8
- Nursery to 4th grade: 17
- 5th and 6th grade: 0
- 7th and 8th grade: 4
- 9th grade: 25
- 10th grade: 0
- 11th grade: 9
- 12th grade, no diploma: 28
- High school graduate (or equivalency): 311
- Less than 1 year of college: 49
- Some college more than 1 year, no degree: 196
- Associate degree: 249
- Bachelor's degree: 1,581
- Master's degree: 1,476
- Professional school degree: 973
- Doctorate degree: 132
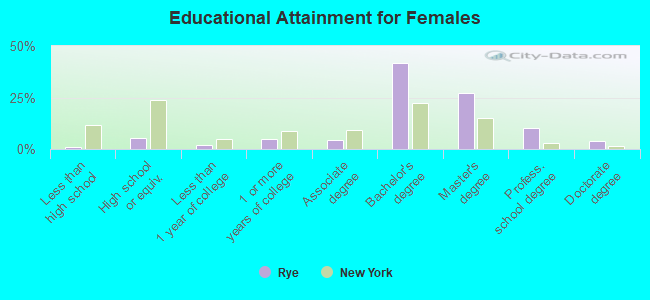
Education attainment for females 25 years and older:
- No schooling: 0
- Nursery to 4th grade: 0
- 5th and 6th grade: 0
- 7th and 8th grade: 3
- 9th grade: 6
- 10th grade: 31
- 11th grade: 14
- 12th grade, no diploma: 0
- High school graduate (or equivalency): 288
- Less than 1 year of college: 110
- Some college more than 1 year, no degree: 271
- Associate degree: 241
- Bachelor's degree: 2,319
- Master's degree: 1,511
- Professional school degree: 556
- Doctorate degree: 203


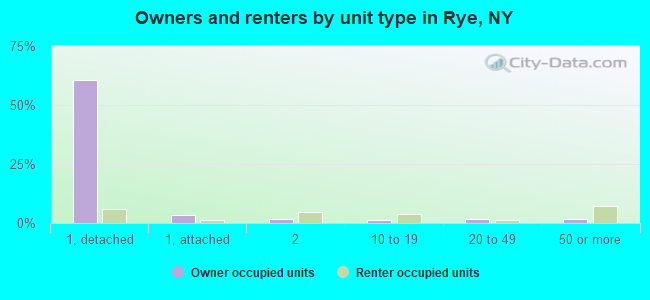
Housing units in structures:
- One, detached: 4,089
- One, attached: 354
- Two: 411
- 3 or 4: 138
- 5 to 9: 220
- 10 to 19: 325
- 20 to 49: 166
- 50 or more: 586
- Mobile homes: 10
Housing units lacking complete kitchen facilities in 2022: 0.3%
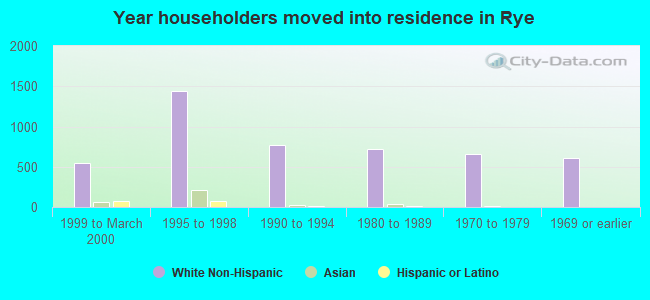
House/condo owner moved in on average 12 years ago
Renter moved in on average 2 years ago
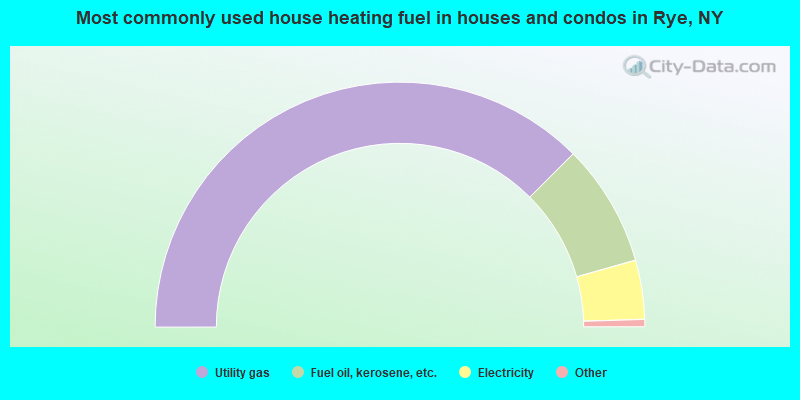
- 75.1%Utility gas
- 16.2%Fuel oil, kerosene, etc.
- 7.8%Electricity
- 0.7%Bottled, tank, or LP gas
- 0.2%Other fuel
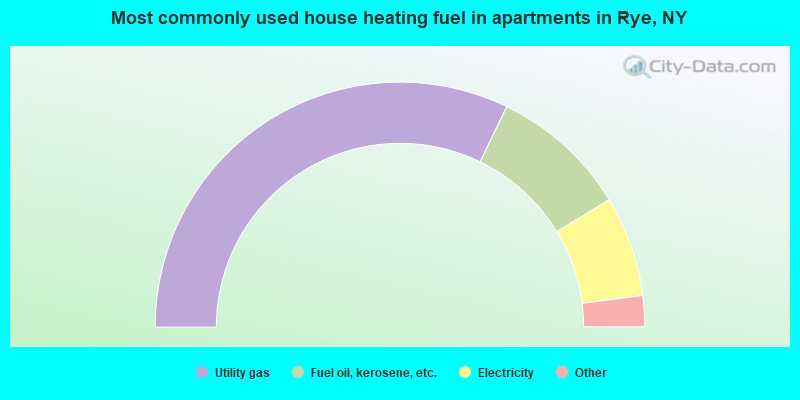
- 64.5%Utility gas
- 18.3%Fuel oil, kerosene, etc.
- 13.3%Electricity
- 2.2%No fuel used
- 1.8%Bottled, tank, or LP gas
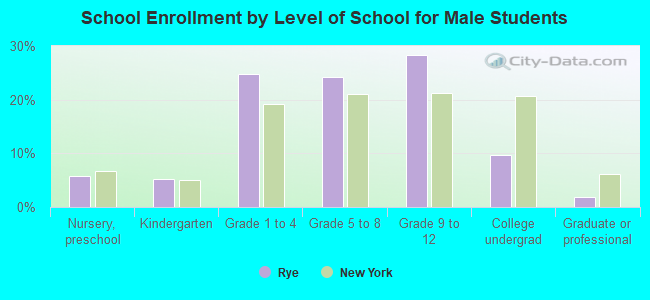
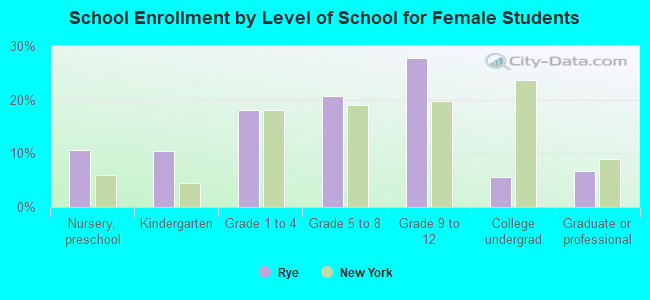
Private vs. public school enrollment:
| Here: | 13.3% |
| New York: | 15.6% |
| Here: | 27.5% |
| New York: | 15.0% |
| Here: | 61.7% |
| New York: | 39.2% |