Roseburg, OR (Oregon) Houses and Residents
| Roseburg: | $332,191 |
| Oregon: | $475,600 |
Total population: 21,903 (Urban population: 20,019 (all inside urban clusters), Rural population: 20 (all nonfarm))
Houses: 10,651 (10,100 occupied: 5,614 owner occupied, 4,559 renter occupied)
| % of renters here: | 45% |
| State: | 37% |
Housing density: 1,155 houses/condos per square mile
Median price asked for vacant for-sale houses and condos in 2022: $785,733.
Median contract rent in 2022: $817 (lower quartile is $700, upper quartile is $1,127)
Median rent asked for vacant for-rent units in 2022: $4,897
Median gross rent in Roseburg, OR in 2022: $926
Housing units in Roseburg with a mortgage: 3,284 (263 second mortgage, 0 home equity loan, 259 both second mortgage and home equity loan)
Houses without a mortgage: 131
Median household income for houses/condos with a mortgage: $89,536
Median household income for apartments without a mortgage: $37,156
Median monthly housing costs: $934
Compare current foreclosures in Roseburg, OR:
| Photo | Address | Area | Beds / Baths | Price | Details |
|---|---|---|---|---|---|

|
#1
NE Todd St
Roseburg, OR 97470
|
784 sq. feet
|
1 baths 2 beds |
$160,500
|
show details |

|
#2
W Ballf St
Roseburg, OR 97471
|
1,143 sq. feet
|
2 baths 3 beds |
show details | |

|
#3
SE Overlook Ave
Roseburg, OR 97470
|
2,385 sq. feet
|
3 baths 5 beds |
show details | |

|
#4
NE Chestnut Ave
Roseburg, OR 97470
|
- sq. feet
|
2 baths 3 beds |
show details | |

|
#5
NE Lincoln St
Roseburg, OR 97470
|
1,532 sq. feet
|
2 baths 3 beds |
show details | |

|
#6
NE Rifle Range St
Roseburg, OR 97470
|
1,566 sq. feet
|
2 baths 3 beds |
show details | |

|
#7
Carnes Rd
Roseburg, OR 97471
|
1,520 sq. feet
|
2 baths 3 beds |
show details | |

|
#8
W Ballf St
Roseburg, OR 97471
|
748 sq. feet
|
2 baths 4 beds |
show details | |

|
#9
Linnell Ave
Roseburg, OR 97471
|
2,382 sq. feet
|
3 baths 5 beds |
show details | |

|
#10
Georginna Dr
Roseburg, OR 97471
|
1,020 sq. feet
|
1 baths 3 beds |
show details |
| Photo | Address | Area | Beds / Baths | Price | Details |
|---|---|---|---|---|---|

|
#11
Del Mar Dr
Roseburg, OR 97471
|
1,012 sq. feet
|
1 baths 3 beds |
show details | |

|
#12
Santiam Ln
Roseburg, OR 97471
|
1,620 sq. feet
|
2 baths 4 beds |
show details | |

|
#13
Roberts Creek Rd
Roseburg, OR 97470
|
1,552 sq. feet
|
2 baths 3 beds |
show details | |

|
#14
NE Nash St
Roseburg, OR 97470
|
2,084 sq. feet
|
2 baths 4 beds |
show details | |

|
#15
Carnes Rd
Roseburg, OR 97471
|
2,000 sq. feet
|
4 baths 4 beds |
show details | |

|
#16
Laurel Dr
Roseburg, OR 97471
|
1,764 sq. feet
|
2 baths 3 beds |
show details | |

|
#17
Winngate Ct
Roseburg, OR 97471
|
1,607 sq. feet
|
2 baths 3 beds |
show details | |

|
#18
SE Mill St
Roseburg, OR 97470
|
1,224 sq. feet
|
1 baths 2 beds |
show details | |

|
#19
SE Cobb St
Roseburg, OR 97470
|
943 sq. feet
|
2 baths 2 beds |
show details | |

|
#20
Ash St
Roseburg, OR 97471
|
1,232 sq. feet
|
2 baths 3 beds |
show details |
| Photo | Address | Area | Beds / Baths | Price | Details |
|---|---|---|---|---|---|

|
#21
NW Lynwood St
Roseburg, OR 97471
|
1,770 sq. feet
|
1 baths 3 beds |
show details | |

|
#22
Mary Ann Ln
Roseburg, OR 97470
|
1,152 sq. feet
|
2 baths 2 beds |
show details | |

|
#23
Mclain Ave
Roseburg, OR 97471
|
2,491 sq. feet
|
2 baths 2 beds |
show details | |

|
#24
NE Newton Creek Rd
Roseburg, OR 97470
|
1,223 sq. feet
|
2 baths 3 beds |
show details | |

|
#25
Zephyr Ct
Roseburg, OR 97471
|
1,176 sq. feet
|
2 baths 3 beds |
show details | |

|
#26
Chandler Dr
Roseburg, OR 97471
|
1,545 sq. feet
|
2 baths 3 beds |
show details | |

|
#27
Beech St
Roseburg, OR 97471
|
1,908 sq. feet
|
2 baths 4 beds |
show details | |

|
#28
SE Parkwood Dr
Roseburg, OR 97470
|
2,158 sq. feet
|
2 baths 3 beds |
show details | |

|
#29
Little Branch Ln
Roseburg, OR 97471
|
992 sq. feet
|
1 baths 2 beds |
show details | |

|
#30
NW Fairmount St
Roseburg, OR 97470
|
1,680 sq. feet
|
2 baths 2 beds |
show details |
| Photo | Address | Area | Beds / Baths | Price | Details |
|---|---|---|---|---|---|

|
#31
NE Ridge Ave
Roseburg, OR 97470
|
2,198 sq. feet
|
1 baths 3 beds |
show details | |

|
#32
Melrose Rd
Roseburg, OR 97471
|
1,104 sq. feet
|
2 baths 3 beds |
show details | |

|
#33
Zephyr Ct
Roseburg, OR 97471
|
1,176 sq. feet
|
2 baths 3 beds |
show details | |

|
#34
NE Garrecht St
Roseburg, OR 97470
|
1,072 sq. feet
|
1 baths 3 beds |
show details | |

|
#35
Wild Iris Ln
Roseburg, OR 97470
|
- sq. feet
|
4 baths 6 beds |
show details | |

|
#36
Landers Ave
Roseburg, OR 97471
|
- sq. feet
|
2 baths 3 beds |
show details | |

|
#37
Adams Loop
Roseburg, OR 97471
|
- sq. feet
|
2 baths 3 beds |
show details | |

|
#38
Carson Ln
Roseburg, OR 97471
|
- sq. feet
|
2 baths - beds |
show details | |

|
#39
NE Jackson St
Roseburg, OR 97470
|
- sq. feet
|
- baths - beds |
show details | |

|
#40
Landers Ave
Roseburg, OR 97471
|
- sq. feet
|
- baths - beds |
show details |
| Photo | Address | Area | Beds / Baths | Price | Details |
|---|---|---|---|---|---|

|
#41
Colonial Rd
Roseburg, OR 97471
|
- sq. feet
|
- baths - beds |
show details | |

|
#42
Linnell Ave
Roseburg, OR 97471
|
- sq. feet
|
- baths - beds |
show details | |

|
#43
NW Wide Ave
Roseburg, OR 97471
|
- sq. feet
|
- baths - beds |
show details | |

|
#44
SE Pine St
Roseburg, OR 97470
|
- sq. feet
|
- baths - beds |
show details | |

|
#45
NW Cecil Ave
Roseburg, OR 97470
|
- sq. feet
|
- baths - beds |
show details | |

|
#46
S Deer Creek Rd
Roseburg, OR 97470
|
- sq. feet
|
- baths - beds |
show details | |

|
#47
Carnes Rd, Ste 8 Pmb 44
Roseburg, OR 97471
|
- sq. feet
|
- baths - beds |
show details | |

|
#48
W Umpqua St Apt 22
Roseburg, OR 97471
|
- sq. feet
|
- baths - beds |
show details | |

|
#49
Ridgecrest Dr
Roseburg, OR 97471
|
- sq. feet
|
- baths - beds |
show details | |

|
Check over 1 million property listings on Foreclosure.com!
|
browse all offers | |||

Latest news about housing in Roseburg, OR collected exclusively by city-data.com from local newspapers, TV, and radio stations

 | Roseburg Oregon, for retirement? (66 replies) |
| The Homeless - something MUST be done (84 replies) |
| housing near roseburg (5 replies) |
| Is Roseburg OR a good place to raise a family, 2020? (19 replies) |
| Apartments in Cottage Grove / Roseburg areas (2 replies) |
| Oregon’s population declines for first time in 30 years, state economist warns of revenue loss (188 replies) |

Median year apartment built: 1967
Household type by relationship:
Households: 23,864- Male householders: 4,810 (1,323 living alone), Female householders: 5,230 (2,108 living alone)
3,502 spouses (3,470 opposite-sex spouses), 997 unmarried partners, (997 opposite-sex unmarried partners), 5,285 children (4,754 natural, 71 adopted, 459 stepchildren), 490 grandchildren, 164 brothers or sisters, 126 parents, 48 foster children, 610 other relatives, 1,513 non-relatives
- In group quarters: 1,084
Size of family households: 2,809 2-persons, 1,270 3-persons, 799 4-persons, 658 5-persons, 205 6-persons, 31 7-or-more-persons.
Size of nonfamily households: 3,169 1-person, 1,122 2-persons, 50 3-persons, 26 5-persons, 11 7-or-more-persons.
2,053 married couples with children.
1,927 single-parent households (553 men, 1,374 women).
95.5% of residents of Roseburg speak English at home.
1.9% of residents speak Spanish at home (88% speak English very well, 4% speak English well, 8% speak English not well).
1.6% of residents speak other Indo-European language at home (79% speak English very well, 18% speak English well, 3% speak English not well).
0.9% of residents speak Asian or Pacific Island language at home (70% speak English very well, 30% speak English well).
0.1% of residents speak other language at home (100% speak English very well).
Foreign born population: 429 (1.8%)
(93.7% of them are naturalized citizens)
| Here: | 6.2 |
| State: | 6.2 |
| Here: | 4.2 |
| State: | 4.0 |

- Bedrooms in owner-occupied houses and condos in Roseburg, Oregon
- 19no bedroom
- 1121 bedroom
- 1,3012 bedrooms
- 3,0443 bedrooms
- 8544 bedrooms
- 2835+ bedrooms

- Bedrooms in renter-occupied apartments in Roseburg, Oregon
- 388no bedroom
- 7901 bedroom
- 2,1602 bedrooms
- 8263 bedrooms
- 3314 bedrooms
- 645+ bedrooms

- Cars and other vehicles available in Roseburg in owner-occupied houses/condos
- 266no vehicle
- 1,5071 vehicle
- 2,3712 vehicles
- 8013 vehicles
- 5044 vehicles
- 1665+ vehicles

- Cars and other vehicles available in Roseburg in renter-occupied apartments
- 783no vehicle
- 1,8181 vehicle
- 1,5102 vehicles
- 3493 vehicles
- 1004 vehicles
- 05+ vehicles

- Rooms in owner-occupied houses in Roseburg, Oregon
- 191 room
- 742 rooms
- 1183 rooms
- 4074 rooms
- 1,7205 rooms
- 9156 rooms
- 8457 rooms
- 7108 rooms
- 8069+ rooms

- Rooms in renter-occupied apartments in Roseburg, Oregon
- 3881 room
- 3672 rooms
- 4173 rooms
- 1,4444 rooms
- 9225 rooms
- 6336 rooms
- 2437 rooms
- 528 rooms
- 939+ rooms


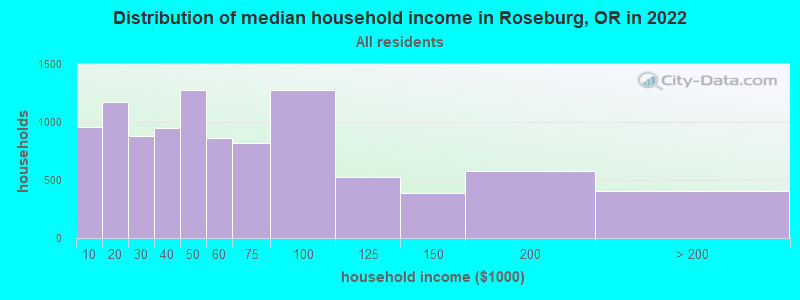
Roseburg, OR household income distribution

- 955Less than $10,000
- 1,174$10,000 to $19,999
- 882$20,000 to $29,999
- 944$30,000 to $39,999
- 1,277$40,000 to $49,999
- 859$50,000 to $59,999
- 818$60,000 to $74,999
- 1,276$75,000 to $99,999
- 525$100,000 to $124,999
- 386$125,000 to $149,999
- 576$150,000 to $199,999
- 402$200,000 or more
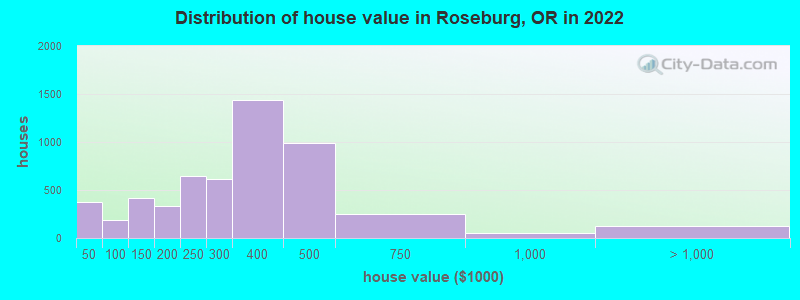
Home value of owner - occupied houses in 2022 in Roseburg, OR
-
- 220Less than $10,000
- 18$10,000 to $14,999
- 20$20,000 to $24,999
- 78$30,000 to $34,999
- 19$35,000 to $39,999
- 17$40,000 to $49,999
- 31$50,000 to $59,999
- 56$70,000 to $79,999
- 36$80,000 to $89,999
- 46$90,000 to $99,999
- 277$100,000 to $124,999
- 135$125,000 to $149,999
- 217$150,000 to $174,999
- 115$175,000 to $199,999
- 644$200,000 to $249,999
- 613$250,000 to $299,999
- 1,436$300,000 to $399,999
- 986$400,000 to $499,999
- 254$500,000 to $749,999
- 48$750,000 to $999,999
- 128$2,000,000 or more
Rent paid by renters in 2022 in Roseburg, OR
-
- 26$100 to $149
- 42$150 to $199
- 24$200 to $249
- 47$250 to $299
- 50$300 to $349
- 141$350 to $399
- 61$400 to $449
- 20$450 to $499
- 221$500 to $549
- 83$550 to $599
- 86$600 to $649
- 487$650 to $699
- 512$700 to $749
- 92$750 to $799
- 453$800 to $899
- 387$900 to $999
- 848$1,000 to $1,249
- 349$1,250 to $1,499
- 312$1,500 to $1,999
- 12$2,000 to $2,499
- 65$2,500 to $2,999
- 29$3,500 or more
- 400No cash rent

Percentage of workers working in this county: 96.3%
Number of people working at home: 972 (10.5% of all workers)
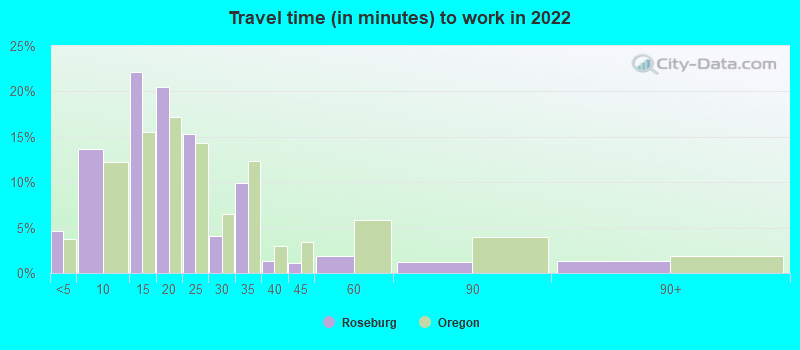
Travel time to work (commute)
- Less than 5 minutes: 683
- 5 to 9 minutes: 1,732
- 10 to 14 minutes: 2,256
- 15 to 19 minutes: 1,509
- 20 to 24 minutes: 919
- 25 to 29 minutes: 80
- 30 to 34 minutes: 261
- 35 to 39 minutes: 9
- 40 to 44 minutes: 44
- 45 to 59 minutes: 94
- 60 to 89 minutes: 86
- 90 or more minutes: 44
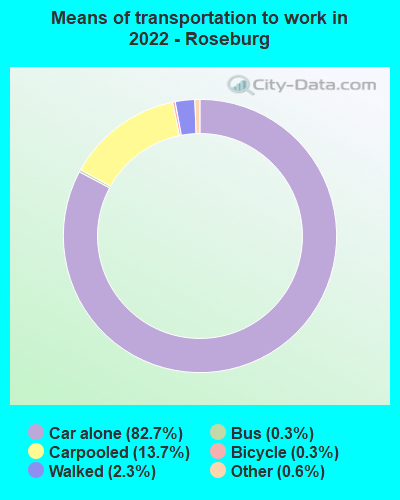
Means of transportation to work:
- Drove a car alone: 14,567 (76.1%)
- Carpooled: 2,459 (12.9%)
- Bus: 39 (0.2%)
- Taxi: 112 (0.6%)
- Bicycle: 44 (0.2%)
- Walked: 460 (2.4%)
- Worked at home: 972 (5.1%)
- Unemployment by race in 2022
- Unemployment rate for White non-Hispanic residents
- 8.1%Males
- 2.9%Females
- Unemployment rate for two or more race residents
- 1.6%Males

- Year of entry for the foreign-born population in Roseburg, Oregon
- 602010 or later
- 1102000 to 2009
- 1891990 to 1999
- 1101980 to 1989
- 211970 to 1979
- 176Before 1970
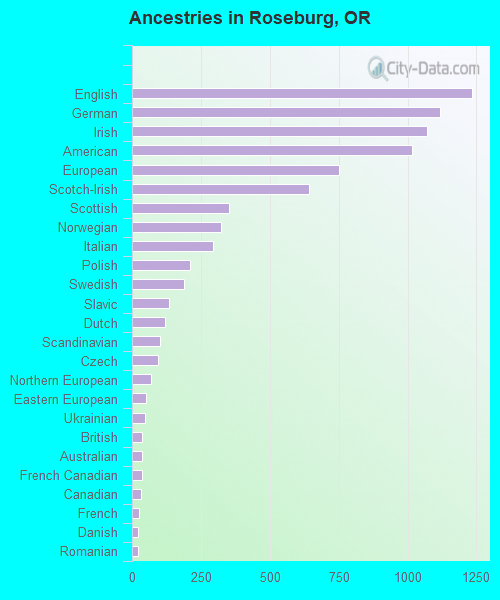
First ancestries reported:
- English: 1,234 (12.8%)
- German: 1,117 (11.5%)
- Irish: 1,069 (11.0%)
- American: 1,017 (10.5%)
- European: 752 (7.8%)
- Scotch-Irish: 641 (6.6%)
- Scottish: 351 (3.6%)
- Norwegian: 322 (3.3%)
- Italian: 294 (3.0%)
- Polish: 209 (2.2%)
- Swedish: 188 (1.9%)
- Slavic: 136 (1.4%)
- Dutch: 119 (1.2%)
- Scandinavian: 100 (1.0%)
- Czech: 95 (1.0%)
- Northern European: 68 (0.7%)
- Eastern European: 50 (0.5%)
- Ukrainian: 47 (0.5%)
- British: 38 (0.4%)
- Australian: 35 (0.4%)
- French Canadian: 35 (0.4%)
- Canadian: 31 (0.3%)
- French: 25 (0.3%)
- Danish: 23 (0.2%)
- Romanian: 22 (0.2%)
- Egyptian: 19 (0.2%)
- Belgian: 18 (0.2%)
- Finnish: 9 (0.09%)
- Greek: 9 (0.09%)
- Portuguese: 9 (0.09%)
- Russian: 2 (0.02%)
- Welsh: 2 (0.02%)
Most common places of birth for foreign-born residents (%):
| Roseburg: | 17.7% (103) |
| Oregon: | 3.5% (14,530) |
| Roseburg: | 16.0% (93) |
| Oregon: | 3.7% (15,229) |
| Roseburg: | 10.3% (60) |
| Oregon: | 1.9% (8,005) |
| Roseburg: | 7.7% (45) |
| Oregon: | 0.2% (839) |
| Roseburg: | 6.2% (36) |
| Oregon: | 2.8% (11,450) |
| Roseburg: | 6.0% (35) |
| Oregon: | 4.7% (19,604) |
| Roseburg: | 5.7% (33) |
| Oregon: | 1.0% (4,043) |
| Roseburg: | 5.2% (30) |
| Oregon: | 0.1% (306) |
| Roseburg: | 4.8% (28) |
| Oregon: | 33.9% (140,109) |
| Roseburg: | 4.5% (26) |
| Oregon: | 0.3% (1,378) |
| Roseburg: | 3.1% (18) |
| Oregon: | 0.2% (811) |
| Roseburg: | 2.8% (16) |
| Oregon: | 0.4% (1,477) |
| Roseburg: | 2.4% (14) |
| Oregon: | 0.5% (2,096) |
| Roseburg: | 2.4% (14) |
| Oregon: | 0.4% (1,568) |
| Roseburg: | 1.9% (11) |
| Oregon: | 0.8% (3,319) |
| Roseburg: | 1.5% (9) |
| Oregon: | 1.7% (7,103) |
Place of birth for U.S.-born residents:
- This state: 11,649
- Other state: 11,538
- Northeast: 308
- Midwest: 2,713
- South: 1,793
- West: 6,863
82.6% of Roseburg residents lived in the same house 1 years ago.
Out of people who lived in different houses, 39.1% lived in this county.
Out of people who lived in different counties, 61.2% lived in Oregon.
| Roseburg: | 82.6% |
| State average: | 85.5% |
Education attainment for males 25 years and older:
- No schooling: 47
- Nursery to 4th grade: 0
- 5th and 6th grade: 1
- 7th and 8th grade: 74
- 9th grade: 80
- 10th grade: 160
- 11th grade: 142
- 12th grade, no diploma: 143
- High school graduate (or equivalency): 2,878
- Less than 1 year of college: 696
- Some college more than 1 year, no degree: 1,436
- Associate degree: 925
- Bachelor's degree: 1,015
- Master's degree: 410
- Professional school degree: 35
- Doctorate degree: 162

Education attainment for females 25 years and older:
- No schooling: 86
- Nursery to 4th grade: 0
- 5th and 6th grade: 15
- 7th and 8th grade: 101
- 9th grade: 12
- 10th grade: 100
- 11th grade: 44
- 12th grade, no diploma: 43
- High school graduate (or equivalency): 2,751
- Less than 1 year of college: 1,147
- Some college more than 1 year, no degree: 1,605
- Associate degree: 829
- Bachelor's degree: 1,248
- Master's degree: 787
- Professional school degree: 20
- Doctorate degree: 116


Housing units in structures:
- One, detached: 6,734
- One, attached: 501
- Two: 276
- 3 or 4: 812
- 5 to 9: 568
- 10 to 19: 226
- 20 to 49: 273
- 50 or more: 418
- Mobile homes: 839
- Boats, RVs, vans, etc.: 1
Median worth of mobile homes: $100,121
Housing units lacking complete kitchen facilities in 2022: 3.5%
House/condo owner moved in on average 9 years ago
Renter moved in on average 2 years ago

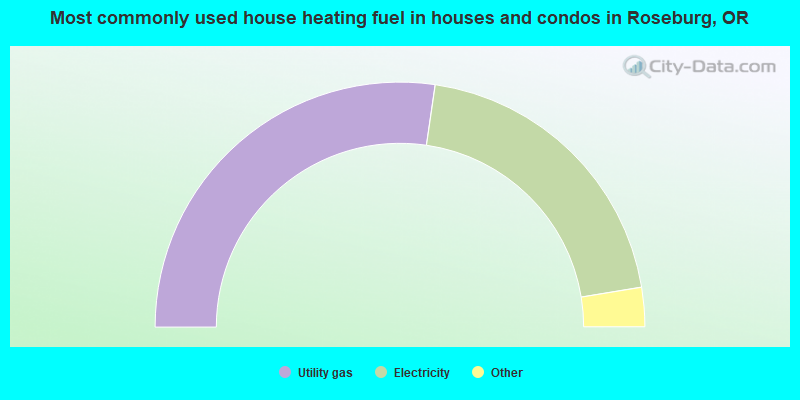
- 54.6%Utility gas
- 40.2%Electricity
- 3.8%Wood
- 1.0%Fuel oil, kerosene, etc.
- 0.4%Bottled, tank, or LP gas
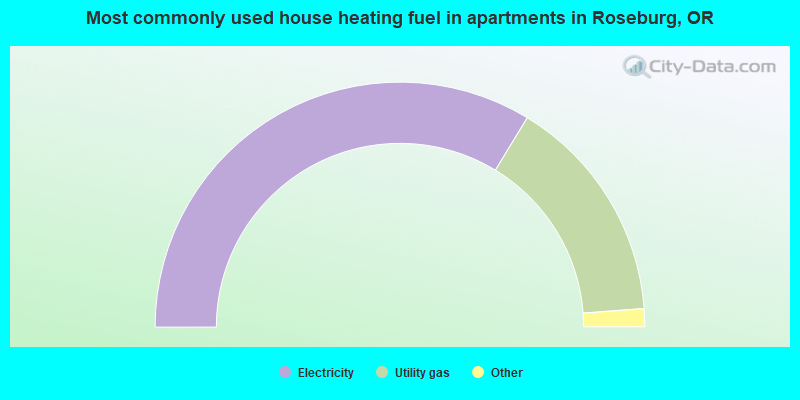
- 67.4%Electricity
- 30.2%Utility gas
- 0.8%No fuel used
- 0.4%Wood
- 0.4%Fuel oil, kerosene, etc.
- 0.3%Bottled, tank, or LP gas
- 0.2%Other fuel
- 0.2%Solar energy
Private vs. public school enrollment:
| Here: | 16.0% |
| Oregon: | 13.7% |
| Here: | 7.3% |
| Oregon: | 8.8% |
| Here: | 11.5% |
| Oregon: | 17.7% |


