Roosevelt, NY (New York) Houses and Residents
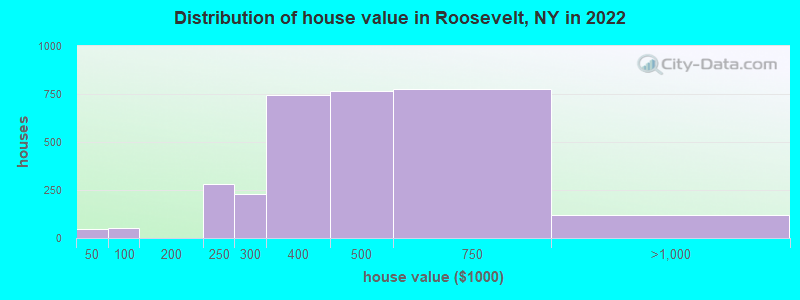
Estimated median house or condo value in 2022: $429,239 (it was $153,400 in 2000 )
Roosevelt:
$429,239New York:
$400,400
Lower value quartile - upper value quartile: $340,734 - $514,775Total population: 16,258 (Urban population: 15,854, Rural population: 0)
Houses: 4,724 (4,546 occupied: 3,460 owner occupied, 1,078 renter occupied )
% of renters here:
24%State:
46%
Housing density: 2,657 houses/condos per square mile
Median price asked for vacant for-sale houses and condos in 2022: $437,418.
Median contract rent in 2022: over $2,000 (lower quartile is $1,590, upper quartile is over $2,000)
Median rent asked for vacant for-rent units in 2022: $4,527
Median gross rent in Roosevelt, NY in 2022: over $2,000
Housing units in Roosevelt with a mortgage: 2,748 (209 second mortgage, 17 home equity loan, 127 both second mortgage and home equity loan )Houses without a mortgage: 37
Median household income for houses/condos with a mortgage: $141,666
Median household income for apartments without a mortgage: $130,886
Median monthly housing costs: $2,480
Data:
Median house or condo value ($)
Median house or condo value ($ change since 2000)
Median house or condo value ($) - White
Median house or condo value ($) - Black or African American
Median house or condo value ($) - Asian
Median house or condo value ($) - Hispanic or Latino
Median house or condo value ($) - American Indian and Alaska Native
Median house or condo value ($) - Multirace
Median house or condo value ($) - Other Race
Median price asked for mobile homes ($)
Household density (households per square mile)
Mean house or condo value by units in structure - 1, detached ($)
Mean house or condo value by units in structure - 1, attached ($)
Mean house or condo value by units in structure - 2 ($)
Mean house or condo value by units in structure by units in structure - 3 or 4 ($)
Mean house or condo value by units in structure - 5 or more ($)
Mean house or condo value by units in structure - Boat, RV, van, etc. ($)
Mean house or condo value by units in structure - Mobile home ($)
Median contract rent ($)
Median contract rent - Lower quartile ($)
Median contract rent - Upper quartile ($)
Median gross rent ($)
Urban houses (%)
Rural houses (%)
Houses occupied (%)
Houses occupied (% change since 2000)
Houses owner occupied (%)
Houses owner occupied (% change since 2000)
Houses renter occupied (%)
Houses renter occupied (% change since 2000)
Vacant housing units - For rent (%)
Vacant housing units - For rent (% change since 2000)
Vacant housing units - For sale only (%)
Vacant housing units - For sale only (% change since 2000)
Vacant housing units - Rented or sold, not occupied (%)
Vacant housing units - Rented or sold, not occupied (% change since 2000)
Vacant housing units - For seasonal, recreational, or occasional use (%)
Vacant housing units - For seasonal, recreational, or occasional use (% change since 2000)
Vacant housing units - For migrant workers (%)
Vacant housing units - For migrant workers (% change since 2000)
Vacant housing units - Other vacant (%)
Vacant housing units - Other vacant (% change since 2000)
Median monthly housing costs ($)
Median household income for houses/condos with a mortgage ($)
Median household income for houses/condos without a mortgage ($)
Median household income ($)
Median household income ($) - White
Median household income ($) - Black or African American
Median household income ($) - Asian
Median household income ($) - Hispanic or Latino
Median household income ($) - American Indian and Alaska Native
Median household income ($) - Multirace
Median household income ($) - Other Race
Mortgage status - with mortgage (%)
Mortgage status - with second mortgage (%)
Mortgage status - with home equity loan (%)
Mortgage status - with both second mortgage and home equity loan (%)
Mortgage status - without a mortgage (%)
Median year house/condo built
Median year apartment built
Household type by relationship - Male householder living alone (%)
Household type by relationship - Male householder not living alone (%)
Household type by relationship - Female householder living alone (%)
Household type by relationship - Female householder not living alone (%)
Household type by relationship - Opposite-Sex spouse (%)
Household type by relationship - Same-Sex spouse (%)
Household type by relationship - Opposite-Sex unmarried partner (%)
Household type by relationship - Same-Sex unmarried partner (%)
Household type by relationship - In group quarters (%)
Size of family households - 2-person household (%)
Size of family households - 3-person household (%)
Size of family households - 4-person household (%)
Size of family households - 5-person household (%)
Size of family households - 6-person household (%)
Size of family households - 7-or-more-person household (%)
Size of nonfamily households - 1-person household (%)
Size of nonfamily households - 2-person household (%)
Size of nonfamily households - 3-person household (%)
Size of nonfamily households - 4-person household (%)
Size of nonfamily households - 5-person household (%)
Size of nonfamily households - 6-person household (%)
Size of nonfamily households - 7-or-moreperson household (%)
Year house built - Built 2010 or later (%)
Year house built - Built 2000 to 2009 (%)
Year house built - Built 1990 to 1999 (%)
Year house built - Built 1980 to 1989 (%)
Year house built - Built 1970 to 1979 (%)
Year house built - Built 1960 to 1969 (%)
Year house built - Built 1950 to 1959 (%)
Year house built - Built 1940 to 1949 (%)
Year house built - Built 1939 or earlier (%)
Median number of rooms in houses and condos
Median number of rooms in apartments
Median number of bedrooms in owner occupied houses
Mean number of bedrooms in owner occupied houses
Median number of bedrooms in renter occupied houses
Mean number of bedrooms in renter occupied houses
Median number of vehichles in owner occupied houses
Mean number of vehichles in owner occupied houses
Median number of vehichles in renter occupied houses
Mean number of vehichles in renter occupied houses
Rooms in owner-occupied houses - 1 room (%)
Rooms in owner-occupied houses - 2 rooms (%)
Rooms in owner-occupied houses - 3 rooms (%)
Rooms in owner-occupied houses - 4 rooms (%)
Rooms in owner-occupied houses - 5 rooms (%)
Rooms in owner-occupied houses - 6 rooms (%)
Rooms in owner-occupied houses - 7 rooms (%)
Rooms in owner-occupied houses - 8 rooms (%)
Rooms in owner-occupied houses - 9+ rooms (%)
Rooms in renter-occupied houses - 1 room (%)
Rooms in renter-occupied houses - 2 rooms (%)
Rooms in renter-occupied houses - 3 rooms (%)
Rooms in renter-occupied houses - 4 rooms (%)
Rooms in renter-occupied houses - 5 rooms (%)
Rooms in renter-occupied houses - 6 rooms (%)
Rooms in renter-occupied houses - 7 rooms (%)
Rooms in renter-occupied houses - 8 rooms (%)
Rooms in renter-occupied houses - 9+ rooms (%)
Bedrooms in owner-occupied houses - no bedrooms (%)
Bedrooms in owner-occupied houses - 1 bedroom (%)
Bedrooms in owner-occupied houses - 2 bedrooms (%)
Bedrooms in owner-occupied houses - 3 bedrooms (%)
Bedrooms in owner-occupied houses - 4 bedrooms (%)
Bedrooms in owner-occupied houses - 5+ bedrooms (%)
Bedrooms in renter-occupied houses - no bedrooms (%)
Bedrooms in renter-occupied houses - 1 bedroom (%)
Bedrooms in renter-occupied houses - 2 bedrooms (%)
Bedrooms in renter-occupied houses - 3 bedrooms (%)
Bedrooms in renter-occupied houses - 4 bedrooms (%)
Bedrooms in renter-occupied houses - 5+ bedrooms (%)
Vehicles available in owner-occupied houses - no vehicle available (%)
Vehicles available in owner-occupied houses - 1 vehicle available(%)
Vehicles available in owner-occupied houses - 2 Vehicles available (%)
Vehicles available in owner-occupied houses - 3 Vehicles available (%)
Vehicles available in owner-occupied houses - 4 Vehicles available (%)
Vehicles available in owner-occupied houses - 5+ Vehicles available (%)
Vehicles available in renter-occupied houses - no vehicle available (%)
Vehicles available in renter-occupied houses - 1 vehicle available (%)
Vehicles available in renter-occupied houses - 2 Vehicles available (%)
Vehicles available in renter-occupied houses - 3 Vehicles available (%)
Vehicles available in renter-occupied houses - 4 Vehicles available (%)
Vehicles available in renter-occupied houses - 5+ Vehicles available (%)
Housing units in structures - 1, detached (%)
Housing units in structures - 1, attached (%)
Housing units in structures - 2 (%)
Housing units in structures - 3 or 4 (%)
Housing units in structures - 5 to 9 (%)
Housing units in structures - 10 to 19 (%)
Housing units in structures - 20 to 49 (%)
Housing units in structures - 50 or more (%)
Housing units in structures - Mobile home (%)
Housing units in structures - Boat, RV, van, etc. (%)
Housing units in structures - Owners - 1, detached (%)
Housing units in structures - Owners - 1, attached (%)
Housing units in structures - Owners - 2 (%)
Housing units in structures - Owners - 3 or 4 (%)
Housing units in structures - Owners - 5 to 9 (%)
Housing units in structures - Owners - 10 to 19 (%)
Housing units in structures - Owners - 20 to 49 (%)
Housing units in structures - Owners - 50 or more (%)
Housing units in structures - Owners - Mobile home (%)
Housing units in structures - Owners - Boat, RV, van, etc. (%)
Housing units in structures - Renters - 1, detached (%)
Housing units in structures - Renters - 1, attached (%)
Housing units in structures - Renters - 2 (%)
Housing units in structures - Renters - 3 or 4 (%)
Housing units in structures - Renters - 5 to 9 (%)
Housing units in structures - Renters - 10 to 19 (%)
Housing units in structures - Renters - 20 to 49 (%)
Housing units in structures - Renters - 50 or more (%)
Housing units in structures - Renters - Mobile home (%)
Housing units in structures - Renters - Boat, RV, van, etc. (%)
House/condo owner moved in on average (years ago)
Renter moved in on average (years ago)
Year householder moved into unit - Moved in 1999 to March 2000 (%)
Year householder moved into unit - Moved in 1999 to March 2000 (%) - White
Year householder moved into unit - Moved in 1999 to March 2000 (%) - Black or African American
Year householder moved into unit - Moved in 1999 to March 2000 (%) - Asian
Year householder moved into unit - Moved in 1999 to March 2000 (%) - Hispanic or Latino
Year householder moved into unit - Moved in 1999 to March 2000 (%) - American Indian and Alaska Native
Year householder moved into unit - Moved in 1999 to March 2000 (%) - Multirace
Year householder moved into unit - Moved in 1999 to March 2000 (%) - Other Race
Year householder moved into unit - Moved in 1995 to 1998 (%)
Year householder moved into unit - Moved in 1995 to 1998 (%) - White
Year householder moved into unit - Moved in 1995 to 1998 (%) - Black or African American
Year householder moved into unit - Moved in 1995 to 1998 (%) - Asian
Year householder moved into unit - Moved in 1995 to 1998 (%) - Hispanic or Latino
Year householder moved into unit - Moved in 1995 to 1998 (%) - American Indian and Alaska Native
Year householder moved into unit - Moved in 1995 to 1998 (%) - Multirace
Year householder moved into unit - Moved in 1995 to 1998 (%) - Other Race
Year householder moved into unit - Moved in 1990 to 1994 (%)
Year householder moved into unit - Moved in 1990 to 1994 (%) - White
Year householder moved into unit - Moved in 1990 to 1994 (%) - Black or African American
Year householder moved into unit - Moved in 1990 to 1994 (%) - Asian
Year householder moved into unit - Moved in 1990 to 1994 (%) - Hispanic or Latino
Year householder moved into unit - Moved in 1990 to 1994 (%) - American Indian and Alaska Native
Year householder moved into unit - Moved in 1990 to 1994 (%) - Multirace
Year householder moved into unit - Moved in 1990 to 1994 (%) - Other Race
Year householder moved into unit - Moved in 1980 to 1989 (%)
Year householder moved into unit - Moved in 1980 to 1989 (%) - White
Year householder moved into unit - Moved in 1980 to 1989 (%) - Black or African American
Year householder moved into unit - Moved in 1980 to 1989 (%) - Asian
Year householder moved into unit - Moved in 1980 to 1989 (%) - Hispanic or Latino
Year householder moved into unit - Moved in 1980 to 1989 (%) - American Indian and Alaska Native
Year householder moved into unit - Moved in 1980 to 1989 (%) - Multirace
Year householder moved into unit - Moved in 1980 to 1989 (%) - Other Race
Year householder moved into unit - Moved in 1970 to 1979 (%)
Year householder moved into unit - Moved in 1970 to 1979 (%) - White
Year householder moved into unit - Moved in 1970 to 1979 (%) - Black or African American
Year householder moved into unit - Moved in 1970 to 1979 (%) - Asian
Year householder moved into unit - Moved in 1970 to 1979 (%) - Hispanic or Latino
Year householder moved into unit - Moved in 1970 to 1979 (%) - American Indian and Alaska Native
Year householder moved into unit - Moved in 1970 to 1979 (%) - Multirace
Year householder moved into unit - Moved in 1970 to 1979 (%) - Other Race
Year householder moved into unit - Moved in 1969 or earlier (%)
Year householder moved into unit - Moved in 1969 or earlier (%) - White
Year householder moved into unit - Moved in 1969 or earlier (%) - Black or African American
Year householder moved into unit - Moved in 1969 or earlier (%) - Asian
Year householder moved into unit - Moved in 1969 or earlier (%) - Hispanic or Latino
Year householder moved into unit - Moved in 1969 or earlier (%) - American Indian and Alaska Native
Year householder moved into unit - Moved in 1969 or earlier (%) - Multirace
Year householder moved into unit - Moved in 1969 or earlier (%) - Other Race
Housing units lacking complete plumbing facilities (%)
Housing units lacking complete kitchen facilities (%)
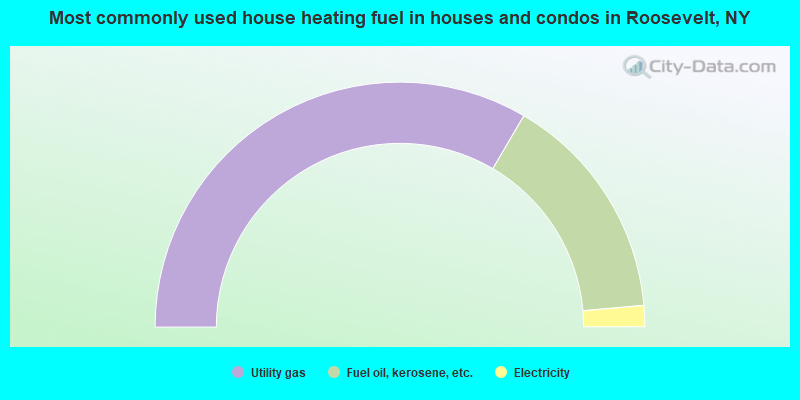
House heating fuel used in houses and condos - Utility gas (%)
House heating fuel used in houses and condos - Bottled, tank, or LP gas (%)
House heating fuel used in houses and condos - Electricity (%)
House heating fuel used in houses and condos - Fuel oil, kerosene, etc. (%)
House heating fuel used in houses and condos - Coal or coke (%)
House heating fuel used in houses and condos - Wood (%)
House heating fuel used in houses and condos - Solar energy (%)
House heating fuel used in houses and condos - Other fuel (%)
House heating fuel used in houses and condos - No fuel used (%)
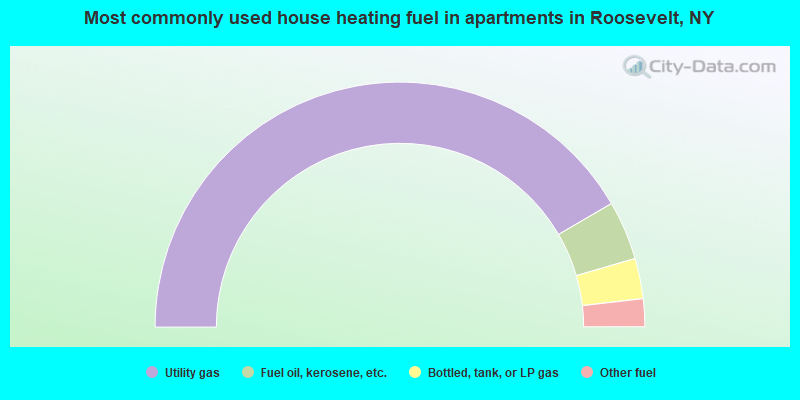
House heating fuel used in apartments - Utility gas (%)
House heating fuel used in apartments - Bottled, tank, or LP gas (%)
House heating fuel used in apartments - Electricity (%)
House heating fuel used in apartments - Fuel oil, kerosene, etc. (%)
House heating fuel used in apartments - Coal or coke (%)
House heating fuel used in apartments - Wood (%)
House heating fuel used in apartments - Solar energy (%)
House heating fuel used in apartments - Other fuel (%)
House heating fuel used in apartments - No fuel used (%)
Latest news about housing in Roosevelt, NY collected exclusively by city-data.com from local newspapers, TV, and radio stations
Median year house/condo built: 1957Median year apartment built: 1939Household type by relationship:
Households: 19,157
Male householders: 2,148 (109 living alone ), Female householders: 2,358 (294 living alone )2,036 spouses (2,027 opposite-sex spouses ), 359 unmarried partners , (347 opposite-sex unmarried partners ), 6,853 children (6,252 natural , 187 adopted , 413 stepchildren ), 1,790 grandchildren , 543 brothers or sisters , 384 parents , 0 foster children , 1,314 other relatives , 1,219 non-relatives In group quarters: 148
Size of family households: 660 2-persons , 538 3-persons , 1,186 4-persons , 556 5-persons , 305 6-persons , 717 7-or-more-persons .
Size of nonfamily households: 421 1-person , 88 2-persons , 23 4-persons , 6 6-persons , 42 7-or-more-persons .
1,575 married couples with children. single-parent households (257 men , 697 women ).
57.1% of residents of Roosevelt speak English at home. of residents speak Spanish at home (38% speak English very well , 22% speak English well , 30% speak English not well , 10% don't speak English at all ).of residents speak other Indo-European language at home (62% speak English very well , 35% speak English well , 3% speak English not well ).of residents speak other language at home (100% speak English very well ).
Foreign born population: 7,080 (37.0%)of them are naturalized citizens )
Median number of rooms in houses and condos:
Median number of rooms in apartments
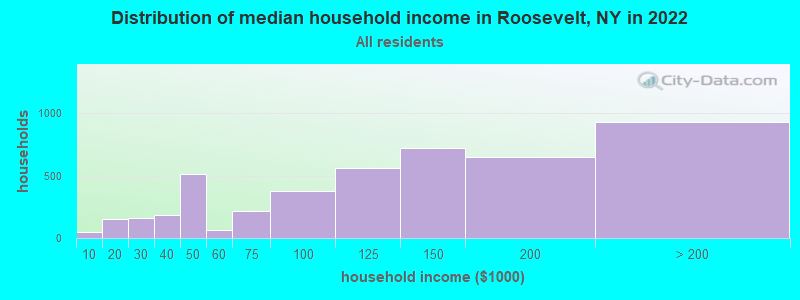
Roosevelt, NY household income distribution 52 Less than $10,000156 $10,000 to $19,999161 $20,000 to $29,999187 $30,000 to $39,999515 $40,000 to $49,99963 $50,000 to $59,999214 $60,000 to $74,999373 $75,000 to $99,999558 $100,000 to $124,999718 $125,000 to $149,999646 $150,000 to $199,999930 $200,000 or more
Home value of owner - occupied houses in 2022 in Roosevelt, NY 47 $40,000 to $49,9994 $90,000 to $99,999281 $200,000 to $249,999227 $250,000 to $299,999746 $300,000 to $399,999765 $400,000 to $499,999775 $500,000 to $749,999107 $750,000 to $999,99913 $2,000,000 or moreRent paid by renters in 2022 in Roosevelt, NY 93 $1,000 to $1,24969 $1,250 to $1,499279 $1,500 to $1,999309 $2,000 to $2,499113 $2,500 to $2,99960 $3,000 to $3,49925 $3,500 or more90 No cash rent
Percentage of workers working in this county: 62.8%Number of people working at home: 788 (7.8% of all workers )
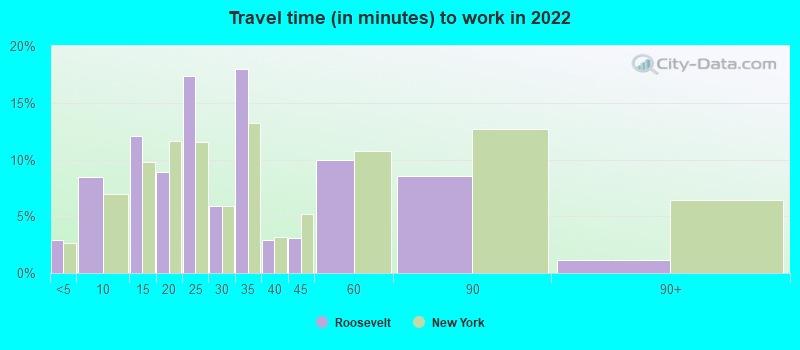
Travel time to work (commute)
Less than 5 minutes: 2905 to 9 minutes: 43410 to 14 minutes: 24815 to 19 minutes: 1,11920 to 24 minutes: 1,31425 to 29 minutes: 87330 to 34 minutes: 1,71235 to 39 minutes: 17140 to 44 minutes: 30945 to 59 minutes: 59060 to 89 minutes: 1,45190 or more minutes: 611
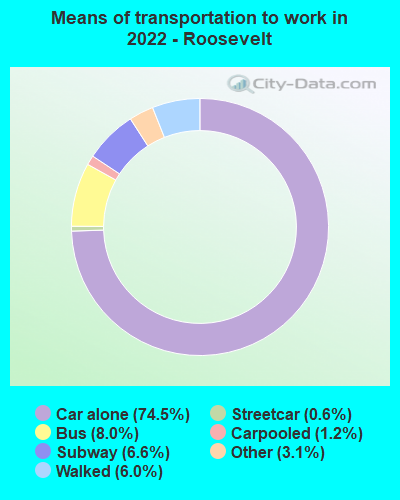
Means of transportation to work:
Drove a car alone: 1,216 (51.6%)Carpooled: 19 (0.8%)Bus : 126 (5.3%)Subway or elevated rail : 8 (0.3%)Long-distance train or commuter rail : 94 (4.0%)Taxi: 72 (3.1%)Walked: 105 (4.5%)Worked at home: 788 (33.4%)
Unemployment by race in 2022
Unemployment rate for Black residents 5.3% Males3.8% FemalesUnemployment rate for Asian residents 23.1% MalesUnemployment rate for other race residents 8.0% MalesUnemployment rate for Hispanic or Latino residents 5.4% Males1.7% Females
Year of entry for the foreign-born population in Roosevelt, New York
1,717 2010 or later 2,138 2000 to 2009 1,297 1990 to 1999 1,401 1980 to 1989 569 1970 to 1979 356 Before 1970
First ancestries reported:
Jamaican: 1,267 (10.5%)
Haitian: 356 (3.0%)
American: 315 (2.6%)
African: 225 (1.9%)
Trinidadian and Tobagonian: 135 (1.1%)
British West Indian: 108 (0.9%)
West Indian: 81 (0.7%)
Guyanese: 73 (0.6%)
Nigerian: 35 (0.3%)
British: 33 (0.3%)
Ghanaian: 29 (0.2%)
Barbadian: 25 (0.2%)
U.S. Virgin Islander: 23 (0.2%)
Eastern European: 18 (0.1%)
Belizean: 8 (0.07%)
Italian: 1 (0.01%) Most common places of birth for foreign-born residents (%): El Salvador Roosevelt:
35.2% (2,407)New York:
2.4% (108,067)
Jamaica Roosevelt:
13.2% (906)New York:
5.0% (227,557)
Haiti Roosevelt:
6.6% (455)New York:
2.8% (126,936)
Dominican Republic Roosevelt:
5.5% (377)New York:
11.1% (501,040)
Trinidad and Tobago Roosevelt:
4.7% (325)New York:
2.0% (91,428)
Ecuador Roosevelt:
4.7% (321)New York:
3.9% (177,448)
Honduras Roosevelt:
4.5% (305)New York:
1.2% (55,571)
Guatemala Roosevelt:
3.9% (266)New York:
1.4% (61,245)
Colombia Roosevelt:
3.8% (260)New York:
2.5% (111,920)
Guyana Roosevelt:
3.2% (222)New York:
3.8% (172,129)
Barbados Roosevelt:
3.2% (217)New York:
0.6% (25,124)
Place of birth for U.S.-born residents:
This state: 10,600Other state: 995Northeast: 101Midwest: 81South: 733West: 78 90.3% of Roosevelt residents lived in the same house 1 years ago.
Out of people who lived in different houses, 37.5% lived in this county.
Out of people who lived in different counties, 92.6% lived in New York.
Roosevelt:
90.3%State average:
89.6%
Education attainment for males 25 years and older:
No schooling: 438Nursery to 4th grade: 2985th and 6th grade: 2297th and 8th grade: 709th grade: 12710th grade: 4411th grade: 7312th grade, no diploma: 228High school graduate (or equivalency): 2,013Less than 1 year of college: 262Some college more than 1 year, no degree: 377Associate degree: 672Bachelor's degree: 712Master's degree: 241Professional school degree: 0Doctorate degree: 53
Education attainment for females 25 years and older:
No schooling: 176Nursery to 4th grade: 805th and 6th grade: 1047th and 8th grade: 779th grade: 16310th grade: 011th grade: 6012th grade, no diploma: 140High school graduate (or equivalency): 1,816Less than 1 year of college: 432Some college more than 1 year, no degree: 714Associate degree: 441Bachelor's degree: 1,341Master's degree: 530Professional school degree: 34Doctorate degree: 78
Housing units in structures:
One, detached: 3,989One, attached: 11Two: 3953 or 4: 2995 to 9: 2250 or more: 6Housing units lacking complete plumbing facilities in 2022: 1.3%Housing units lacking complete kitchen facilities in 2022: 1.0%House/condo owner moved in on average 13 years ago
Renter moved in on average 8 years ago
Private vs. public school enrollment:
Students in private schools in grades 1 to 8 (elementary and middle school): 48 Students in private schools in grades 9 to 12 (high school): 57 Students in private undergraduate colleges: 268