Rogers, AR (Arkansas) Houses and Residents
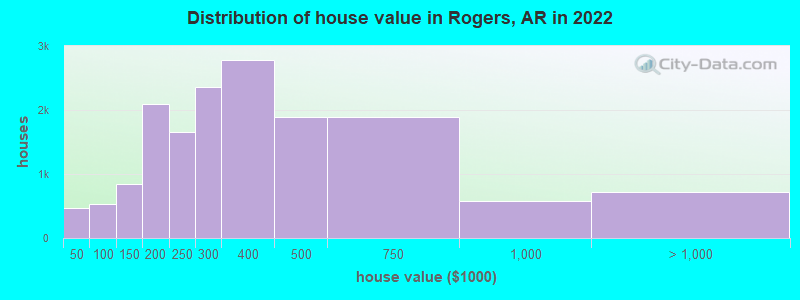
Estimated median house or condo value in 2022: $292,200 (it was $91,100 in 2000 )
Rogers:
$292,200Arkansas:
$179,800
Lower value quartile - upper value quartile: $196,200 - $467,900Mean price in 2022: Detached houses: $303,079 Here:
$303,079State:
$243,881
Townhouses or other attached units: $340,804 Here:
$340,804State:
$244,376
In 2-unit structures: $279,416 Here:
$279,416State:
$229,180
In 3-to-4-unit structures: $536,246 Here:
$536,246State:
$216,658
In 5-or-more-unit structures: $161,743 Here:
$161,743State:
$227,195
Mobile homes: $25,577 Here:
$25,577State:
$79,566
Total population: 61,464 (Urban population: 36,464 (36,120 inside urbanized areas, 344 inside urban clusters ), Rural population: 2,297 (45 farm, 2,252 nonfarm ))
Houses: 28,209 (26,382 occupied: 17,000 owner occupied, 9,382 renter occupied )
% of renters here:
36%State:
34%
Housing density: 841 houses/condos per square mile
Median price asked for vacant for-sale houses and condos in 2022: $582,216.
Median contract rent in 2022: $998 (lower quartile is $805, upper quartile is $1,224)
Median rent asked for vacant for-rent units in 2022: $1,225
Median gross rent in Rogers, AR in 2022: $1,209
Housing units in Rogers with a mortgage: 11,618 (1,218 second mortgage, 0 home equity loan, 683 both second mortgage and home equity loan )Houses without a mortgage: 256
Median household income for houses/condos with a mortgage: $110,466
Median household income for apartments without a mortgage: $64,649
Median monthly housing costs: $1,212
Data:
Median house or condo value ($)
Median house or condo value ($ change since 2000)
Median house or condo value ($) - White
Median house or condo value ($) - Black or African American
Median house or condo value ($) - Asian
Median house or condo value ($) - Hispanic or Latino
Median house or condo value ($) - American Indian and Alaska Native
Median house or condo value ($) - Multirace
Median house or condo value ($) - Other Race
Median price asked for mobile homes ($)
Household density (households per square mile)
Mean house or condo value by units in structure - 1, detached ($)
Mean house or condo value by units in structure - 1, attached ($)
Mean house or condo value by units in structure - 2 ($)
Mean house or condo value by units in structure by units in structure - 3 or 4 ($)
Mean house or condo value by units in structure - 5 or more ($)
Mean house or condo value by units in structure - Boat, RV, van, etc. ($)
Mean house or condo value by units in structure - Mobile home ($)
Median contract rent ($)
Median contract rent - Lower quartile ($)
Median contract rent - Upper quartile ($)
Median gross rent ($)
Urban houses (%)
Rural houses (%)
Houses occupied (%)
Houses occupied (% change since 2000)
Houses owner occupied (%)
Houses owner occupied (% change since 2000)
Houses renter occupied (%)
Houses renter occupied (% change since 2000)
Vacant housing units - For rent (%)
Vacant housing units - For rent (% change since 2000)
Vacant housing units - For sale only (%)
Vacant housing units - For sale only (% change since 2000)
Vacant housing units - Rented or sold, not occupied (%)
Vacant housing units - Rented or sold, not occupied (% change since 2000)
Vacant housing units - For seasonal, recreational, or occasional use (%)
Vacant housing units - For seasonal, recreational, or occasional use (% change since 2000)
Vacant housing units - For migrant workers (%)
Vacant housing units - For migrant workers (% change since 2000)
Vacant housing units - Other vacant (%)
Vacant housing units - Other vacant (% change since 2000)
Median monthly housing costs ($)
Median household income for houses/condos with a mortgage ($)
Median household income for houses/condos without a mortgage ($)
Median household income ($)
Median household income ($) - White
Median household income ($) - Black or African American
Median household income ($) - Asian
Median household income ($) - Hispanic or Latino
Median household income ($) - American Indian and Alaska Native
Median household income ($) - Multirace
Median household income ($) - Other Race
Mortgage status - with mortgage (%)
Mortgage status - with second mortgage (%)
Mortgage status - with home equity loan (%)
Mortgage status - with both second mortgage and home equity loan (%)
Mortgage status - without a mortgage (%)
Median year house/condo built
Median year apartment built
Household type by relationship - Male householder living alone (%)
Household type by relationship - Male householder not living alone (%)
Household type by relationship - Female householder living alone (%)
Household type by relationship - Female householder not living alone (%)
Household type by relationship - Opposite-Sex spouse (%)
Household type by relationship - Same-Sex spouse (%)
Household type by relationship - Opposite-Sex unmarried partner (%)
Household type by relationship - Same-Sex unmarried partner (%)
Household type by relationship - In group quarters (%)
Size of family households - 2-person household (%)
Size of family households - 3-person household (%)
Size of family households - 4-person household (%)
Size of family households - 5-person household (%)
Size of family households - 6-person household (%)
Size of family households - 7-or-more-person household (%)
Size of nonfamily households - 1-person household (%)
Size of nonfamily households - 2-person household (%)
Size of nonfamily households - 3-person household (%)
Size of nonfamily households - 4-person household (%)
Size of nonfamily households - 5-person household (%)
Size of nonfamily households - 6-person household (%)
Size of nonfamily households - 7-or-moreperson household (%)
Year house built - Built 2010 or later (%)
Year house built - Built 2000 to 2009 (%)
Year house built - Built 1990 to 1999 (%)
Year house built - Built 1980 to 1989 (%)
Year house built - Built 1970 to 1979 (%)
Year house built - Built 1960 to 1969 (%)
Year house built - Built 1950 to 1959 (%)
Year house built - Built 1940 to 1949 (%)
Year house built - Built 1939 or earlier (%)
Median number of rooms in houses and condos
Median number of rooms in apartments
Median number of bedrooms in owner occupied houses
Mean number of bedrooms in owner occupied houses
Median number of bedrooms in renter occupied houses
Mean number of bedrooms in renter occupied houses
Median number of vehichles in owner occupied houses
Mean number of vehichles in owner occupied houses
Median number of vehichles in renter occupied houses
Mean number of vehichles in renter occupied houses
Rooms in owner-occupied houses - 1 room (%)
Rooms in owner-occupied houses - 2 rooms (%)
Rooms in owner-occupied houses - 3 rooms (%)
Rooms in owner-occupied houses - 4 rooms (%)
Rooms in owner-occupied houses - 5 rooms (%)
Rooms in owner-occupied houses - 6 rooms (%)
Rooms in owner-occupied houses - 7 rooms (%)
Rooms in owner-occupied houses - 8 rooms (%)
Rooms in owner-occupied houses - 9+ rooms (%)
Rooms in renter-occupied houses - 1 room (%)
Rooms in renter-occupied houses - 2 rooms (%)
Rooms in renter-occupied houses - 3 rooms (%)
Rooms in renter-occupied houses - 4 rooms (%)
Rooms in renter-occupied houses - 5 rooms (%)
Rooms in renter-occupied houses - 6 rooms (%)
Rooms in renter-occupied houses - 7 rooms (%)
Rooms in renter-occupied houses - 8 rooms (%)
Rooms in renter-occupied houses - 9+ rooms (%)
Bedrooms in owner-occupied houses - no bedrooms (%)
Bedrooms in owner-occupied houses - 1 bedroom (%)
Bedrooms in owner-occupied houses - 2 bedrooms (%)
Bedrooms in owner-occupied houses - 3 bedrooms (%)
Bedrooms in owner-occupied houses - 4 bedrooms (%)
Bedrooms in owner-occupied houses - 5+ bedrooms (%)
Bedrooms in renter-occupied houses - no bedrooms (%)
Bedrooms in renter-occupied houses - 1 bedroom (%)
Bedrooms in renter-occupied houses - 2 bedrooms (%)
Bedrooms in renter-occupied houses - 3 bedrooms (%)
Bedrooms in renter-occupied houses - 4 bedrooms (%)
Bedrooms in renter-occupied houses - 5+ bedrooms (%)
Vehicles available in owner-occupied houses - no vehicle available (%)
Vehicles available in owner-occupied houses - 1 vehicle available(%)
Vehicles available in owner-occupied houses - 2 Vehicles available (%)
Vehicles available in owner-occupied houses - 3 Vehicles available (%)
Vehicles available in owner-occupied houses - 4 Vehicles available (%)
Vehicles available in owner-occupied houses - 5+ Vehicles available (%)
Vehicles available in renter-occupied houses - no vehicle available (%)
Vehicles available in renter-occupied houses - 1 vehicle available (%)
Vehicles available in renter-occupied houses - 2 Vehicles available (%)
Vehicles available in renter-occupied houses - 3 Vehicles available (%)
Vehicles available in renter-occupied houses - 4 Vehicles available (%)
Vehicles available in renter-occupied houses - 5+ Vehicles available (%)
Housing units in structures - 1, detached (%)
Housing units in structures - 1, attached (%)
Housing units in structures - 2 (%)
Housing units in structures - 3 or 4 (%)
Housing units in structures - 5 to 9 (%)
Housing units in structures - 10 to 19 (%)
Housing units in structures - 20 to 49 (%)
Housing units in structures - 50 or more (%)
Housing units in structures - Mobile home (%)
Housing units in structures - Boat, RV, van, etc. (%)
Housing units in structures - Owners - 1, detached (%)
Housing units in structures - Owners - 1, attached (%)
Housing units in structures - Owners - 2 (%)
Housing units in structures - Owners - 3 or 4 (%)
Housing units in structures - Owners - 5 to 9 (%)
Housing units in structures - Owners - 10 to 19 (%)
Housing units in structures - Owners - 20 to 49 (%)
Housing units in structures - Owners - 50 or more (%)
Housing units in structures - Owners - Mobile home (%)
Housing units in structures - Owners - Boat, RV, van, etc. (%)
Housing units in structures - Renters - 1, detached (%)
Housing units in structures - Renters - 1, attached (%)
Housing units in structures - Renters - 2 (%)
Housing units in structures - Renters - 3 or 4 (%)
Housing units in structures - Renters - 5 to 9 (%)
Housing units in structures - Renters - 10 to 19 (%)
Housing units in structures - Renters - 20 to 49 (%)
Housing units in structures - Renters - 50 or more (%)
Housing units in structures - Renters - Mobile home (%)
Housing units in structures - Renters - Boat, RV, van, etc. (%)
House/condo owner moved in on average (years ago)
Renter moved in on average (years ago)
Year householder moved into unit - Moved in 1999 to March 2000 (%)
Year householder moved into unit - Moved in 1999 to March 2000 (%) - White
Year householder moved into unit - Moved in 1999 to March 2000 (%) - Black or African American
Year householder moved into unit - Moved in 1999 to March 2000 (%) - Asian
Year householder moved into unit - Moved in 1999 to March 2000 (%) - Hispanic or Latino
Year householder moved into unit - Moved in 1999 to March 2000 (%) - American Indian and Alaska Native
Year householder moved into unit - Moved in 1999 to March 2000 (%) - Multirace
Year householder moved into unit - Moved in 1999 to March 2000 (%) - Other Race
Year householder moved into unit - Moved in 1995 to 1998 (%)
Year householder moved into unit - Moved in 1995 to 1998 (%) - White
Year householder moved into unit - Moved in 1995 to 1998 (%) - Black or African American
Year householder moved into unit - Moved in 1995 to 1998 (%) - Asian
Year householder moved into unit - Moved in 1995 to 1998 (%) - Hispanic or Latino
Year householder moved into unit - Moved in 1995 to 1998 (%) - American Indian and Alaska Native
Year householder moved into unit - Moved in 1995 to 1998 (%) - Multirace
Year householder moved into unit - Moved in 1995 to 1998 (%) - Other Race
Year householder moved into unit - Moved in 1990 to 1994 (%)
Year householder moved into unit - Moved in 1990 to 1994 (%) - White
Year householder moved into unit - Moved in 1990 to 1994 (%) - Black or African American
Year householder moved into unit - Moved in 1990 to 1994 (%) - Asian
Year householder moved into unit - Moved in 1990 to 1994 (%) - Hispanic or Latino
Year householder moved into unit - Moved in 1990 to 1994 (%) - American Indian and Alaska Native
Year householder moved into unit - Moved in 1990 to 1994 (%) - Multirace
Year householder moved into unit - Moved in 1990 to 1994 (%) - Other Race
Year householder moved into unit - Moved in 1980 to 1989 (%)
Year householder moved into unit - Moved in 1980 to 1989 (%) - White
Year householder moved into unit - Moved in 1980 to 1989 (%) - Black or African American
Year householder moved into unit - Moved in 1980 to 1989 (%) - Asian
Year householder moved into unit - Moved in 1980 to 1989 (%) - Hispanic or Latino
Year householder moved into unit - Moved in 1980 to 1989 (%) - American Indian and Alaska Native
Year householder moved into unit - Moved in 1980 to 1989 (%) - Multirace
Year householder moved into unit - Moved in 1980 to 1989 (%) - Other Race
Year householder moved into unit - Moved in 1970 to 1979 (%)
Year householder moved into unit - Moved in 1970 to 1979 (%) - White
Year householder moved into unit - Moved in 1970 to 1979 (%) - Black or African American
Year householder moved into unit - Moved in 1970 to 1979 (%) - Asian
Year householder moved into unit - Moved in 1970 to 1979 (%) - Hispanic or Latino
Year householder moved into unit - Moved in 1970 to 1979 (%) - American Indian and Alaska Native
Year householder moved into unit - Moved in 1970 to 1979 (%) - Multirace
Year householder moved into unit - Moved in 1970 to 1979 (%) - Other Race
Year householder moved into unit - Moved in 1969 or earlier (%)
Year householder moved into unit - Moved in 1969 or earlier (%) - White
Year householder moved into unit - Moved in 1969 or earlier (%) - Black or African American
Year householder moved into unit - Moved in 1969 or earlier (%) - Asian
Year householder moved into unit - Moved in 1969 or earlier (%) - Hispanic or Latino
Year householder moved into unit - Moved in 1969 or earlier (%) - American Indian and Alaska Native
Year householder moved into unit - Moved in 1969 or earlier (%) - Multirace
Year householder moved into unit - Moved in 1969 or earlier (%) - Other Race
Housing units lacking complete plumbing facilities (%)
Housing units lacking complete kitchen facilities (%)
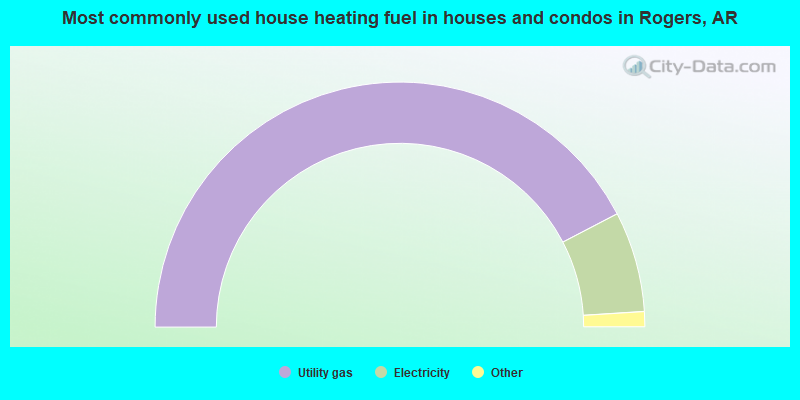
House heating fuel used in houses and condos - Utility gas (%)
House heating fuel used in houses and condos - Bottled, tank, or LP gas (%)
House heating fuel used in houses and condos - Electricity (%)
House heating fuel used in houses and condos - Fuel oil, kerosene, etc. (%)
House heating fuel used in houses and condos - Coal or coke (%)
House heating fuel used in houses and condos - Wood (%)
House heating fuel used in houses and condos - Solar energy (%)
House heating fuel used in houses and condos - Other fuel (%)
House heating fuel used in houses and condos - No fuel used (%)
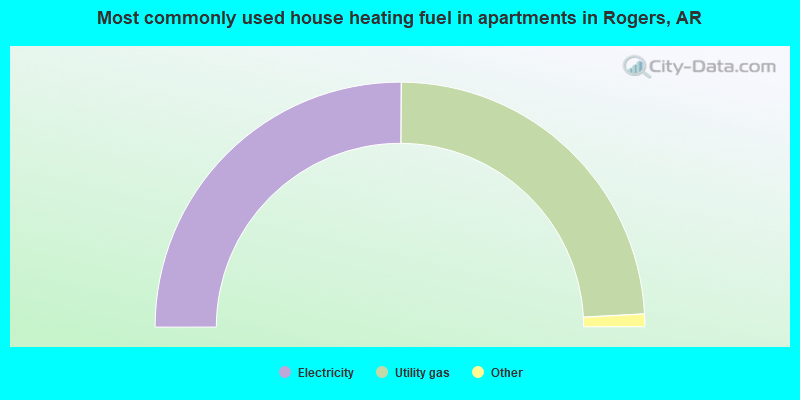
House heating fuel used in apartments - Utility gas (%)
House heating fuel used in apartments - Bottled, tank, or LP gas (%)
House heating fuel used in apartments - Electricity (%)
House heating fuel used in apartments - Fuel oil, kerosene, etc. (%)
House heating fuel used in apartments - Coal or coke (%)
House heating fuel used in apartments - Wood (%)
House heating fuel used in apartments - Solar energy (%)
House heating fuel used in apartments - Other fuel (%)
House heating fuel used in apartments - No fuel used (%)
Latest news about housing in Rogers, AR collected exclusively by city-data.com from local newspapers, TV, and radio stations
Median year house/condo built: 1996Median year apartment built: 2002Household type by relationship:
Households: 72,996
Male householders: 14,700 (2,670 living alone ), Female householders: 11,682 (4,026 living alone )15,156 spouses (14,987 opposite-sex spouses ), 1,113 unmarried partners , (1,113 opposite-sex unmarried partners ), 23,572 children (21,984 natural , 313 adopted , 1,275 stepchildren ), 1,707 grandchildren , 279 brothers or sisters , 1,248 parents , 0 foster children , 1,565 other relatives , 1,284 non-relatives In group quarters: 690
Size of family households: 7,506 2-persons , 4,244 3-persons , 3,733 4-persons , 1,218 5-persons , 1,713 6-persons , 316 7-or-more-persons .
Size of nonfamily households: 6,696 1-person , 684 2-persons , 209 3-persons , 63 4-persons .
13,302 married couples with children. single-parent households (1,352 men , 2,227 women ).
74.8% of residents of Rogers speak English at home. of residents speak Spanish at home (54% speak English very well , 13% speak English well , 17% speak English not well , 16% don't speak English at all ).of residents speak other Indo-European language at home (97% speak English very well , 3% speak English well ).of residents speak Asian or Pacific Island language at home (57% speak English very well , 21% speak English well , 12% speak English not well , 11% don't speak English at all ).of residents speak other language at home (73% speak English very well , 27% speak English well ).
Foreign born population: 10,965 (15.0%)of them are naturalized citizens )
Median number of rooms in houses and condos:
Median number of rooms in apartments
Owner-occupied Renter-occupied
Rooms in owner-occupied houses in Rogers, Arkansas
0 1 room 0 2 rooms 221 3 rooms 1,275 4 rooms 3,316 5 rooms 3,989 6 rooms 3,152 7 rooms 2,352 8 rooms 2,695 9+ rooms
Rooms in renter-occupied apartments in Rogers, Arkansas
452 1 room 368 2 rooms 2,406 3 rooms 3,103 4 rooms 994 5 rooms 598 6 rooms 742 7 rooms 176 8 rooms 543 9+ rooms
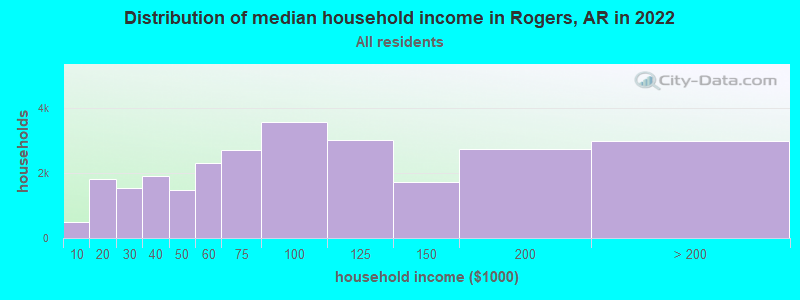
Rogers, AR household income distribution 495 Less than $10,0001,829 $10,000 to $19,9991,556 $20,000 to $29,9991,919 $30,000 to $39,9991,477 $40,000 to $49,9992,316 $50,000 to $59,9992,703 $60,000 to $74,9993,581 $75,000 to $99,9993,030 $100,000 to $124,9991,731 $125,000 to $149,9992,759 $150,000 to $199,9992,986 $200,000 or more
Home value of owner - occupied houses in 2022 in Rogers, AR 10 Less than $10,00054 $10,000 to $14,99950 $15,000 to $19,99986 $20,000 to $24,99941 $25,000 to $29,99955 $30,000 to $34,999114 $35,000 to $39,99950 $40,000 to $49,99968 $50,000 to $59,99966 $60,000 to $69,999132 $70,000 to $79,99971 $80,000 to $89,999147 $90,000 to $99,999316 $100,000 to $124,999530 $125,000 to $149,9991,333 $150,000 to $174,999754 $175,000 to $199,9991,663 $200,000 to $249,9992,362 $250,000 to $299,9992,776 $300,000 to $399,9991,890 $400,000 to $499,9991,897 $500,000 to $749,999576 $750,000 to $999,999348 $1,000,000 to $1,499,999166 $1,500,000 to $1,999,999195 $2,000,000 or moreRent paid by renters in 2022 in Rogers, AR 26 Less than $10013 $100 to $14962 $150 to $199106 $200 to $24981 $250 to $299211 $300 to $349158 $350 to $399350 $400 to $449392 $450 to $499305 $500 to $549302 $550 to $599367 $600 to $649390 $650 to $699494 $700 to $749341 $750 to $7991,403 $800 to $899837 $900 to $9992,495 $1,000 to $1,2491,238 $1,250 to $1,499458 $1,500 to $1,999123 $2,000 to $2,499154 $2,500 to $2,99969 $3,500 or more454 No cash rent
Percentage of workers working in this county: 84.4%Number of people working at home: 4,947 (12.6% of all workers )
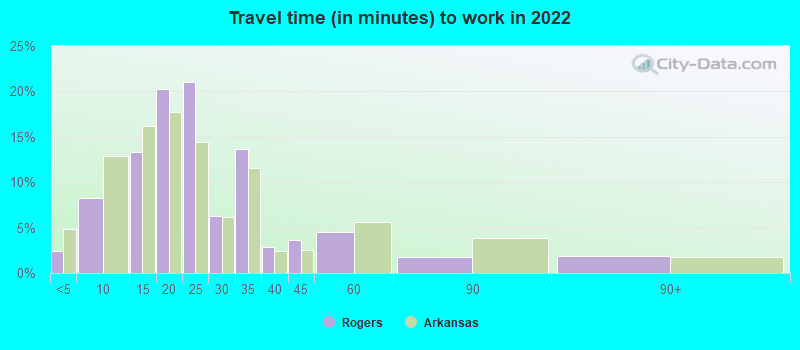
Travel time to work (commute)
Less than 5 minutes: 7915 to 9 minutes: 3,25510 to 14 minutes: 7,11715 to 19 minutes: 6,71320 to 24 minutes: 6,27925 to 29 minutes: 1,96730 to 34 minutes: 3,94635 to 39 minutes: 20640 to 44 minutes: 12745 to 59 minutes: 25160 to 89 minutes: 64290 or more minutes: 588
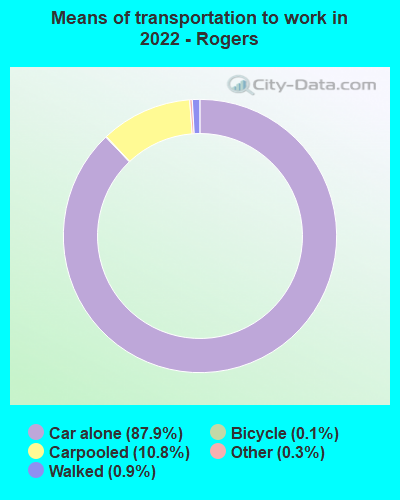
Means of transportation to work:
Drove a car alone: 37,138 (77.3%)Carpooled: 4,371 (9.1%)Bus : 18 (0.0%)Taxi: 121 (0.3%)Bicycle: 52 (0.1%)Walked: 613 (1.3%)Worked at home: 4,947 (10.3%)
Unemployment by race in 2022
Unemployment rate for White non-Hispanic residents 1.1% Males4.6% FemalesUnemployment rate for American Indian and Alaska Native residents 8.0% Males12.7% FemalesUnemployment rate for Asian residents 12.1% MalesUnemployment rate for other race residents 3.9% Males1.0% FemalesUnemployment rate for two or more race residents 1.3% Males2.3% FemalesUnemployment rate for Hispanic or Latino residents 2.0% Males0.8% Females
Year of entry for the foreign-born population in Rogers, Arkansas
3,168 2010 or later 3,800 2000 to 2009 3,966 1990 to 1999 1,590 1980 to 1989 606 1970 to 1979 209 Before 1970
First ancestries reported:
English: 2,908 (8.3%)
American: 2,176 (6.2%)
German: 1,908 (5.5%)
Irish: 1,206 (3.5%)
European: 726 (2.1%)
Scottish: 440 (1.3%)
Italian: 396 (1.1%)
Scotch-Irish: 341 (1.0%)
French: 192 (0.6%)
Dutch: 168 (0.5%)
Norwegian: 138 (0.4%)
British: 131 (0.4%)
Polish: 128 (0.4%)
Scandinavian: 97 (0.3%)
Swedish: 80 (0.2%)
Eastern European: 79 (0.2%)
Czechoslovakian: 78 (0.2%)
Canadian: 62 (0.2%)
New Zealander: 59 (0.2%)
Welsh: 58 (0.2%)
Portuguese: 50 (0.1%)
Hungarian: 45 (0.1%)
Swiss: 45 (0.1%)
Lithuanian: 42 (0.1%)
French Canadian: 41 (0.1%)
Iranian: 40 (0.1%)
Cajun: 33 (0.09%)
Czech: 32 (0.09%)
Belgian: 24 (0.07%)
Austrian: 20 (0.06%)
African: 20 (0.06%)
Albanian: 14 (0.04%)
Nigerian: 12 (0.03%)
Northern European: 12 (0.03%)
Romanian: 11 (0.03%)
Finnish: 10 (0.03%)
Danish: 9 (0.03%)
Greek: 8 (0.02%)
Bulgarian: 8 (0.02%)
Moroccan: 7 (0.02%)
Yugoslavian: 6 (0.02%)
Macedonian: 5 (0.01%)
Bermudan: 5 (0.01%) Most common places of birth for foreign-born residents (%): Mexico Rogers:
52.0% (6,988)Arkansas:
40.2% (61,075)
El Salvador Rogers:
22.9% (3,070)Arkansas:
10.7% (16,210)
Marshall Islands Rogers:
3.7% (501)Arkansas:
4.3% (6,456)
Guatemala Rogers:
3.1% (414)Arkansas:
3.5% (5,376)
India Rogers:
2.3% (315)Arkansas:
6.1% (9,278)
Costa Rica Rogers:
2.3% (303)Arkansas:
0.4% (664)
United Kingdom, excluding England and Scotland Rogers:
1.5% (205)Arkansas:
0.8% (1,283)
Place of birth for U.S.-born residents:
This state: 29,970Other state: 30,552Northeast: 1,632Midwest: 9,534South: 10,980West: 8,406 88.9% of Rogers residents lived in the same house 1 years ago.
Out of people who lived in different houses, 36.0% lived in this county.
Out of people who lived in different counties, 44.3% lived in Arkansas.
Rogers:
88.9%State average:
87.0%
Education attainment for males 25 years and older:
No schooling: 86Nursery to 4th grade: 9125th and 6th grade: 4567th and 8th grade: 809th grade: 74110th grade: 011th grade: 47512th grade, no diploma: 412High school graduate (or equivalency): 6,765Less than 1 year of college: 982Some college more than 1 year, no degree: 3,129Associate degree: 1,399Bachelor's degree: 4,253Master's degree: 2,506Professional school degree: 513Doctorate degree: 436
Education attainment for females 25 years and older:
No schooling: 342Nursery to 4th grade: 6855th and 6th grade: 1,1947th and 8th grade: 5689th grade: 13410th grade: 811th grade: 14212th grade, no diploma: 450High school graduate (or equivalency): 6,364Less than 1 year of college: 1,077Some college more than 1 year, no degree: 3,364Associate degree: 1,806Bachelor's degree: 5,427Master's degree: 2,233Professional school degree: 489Doctorate degree: 250
Housing units in structures:
One, detached: 19,004One, attached: 2,147Two: 7603 or 4: 5885 to 9: 1,51110 to 19: 2,43720 to 49: 58950 or more: 381Mobile homes: 792Housing units lacking complete plumbing facilities in 2022: 1.1%Housing units lacking complete kitchen facilities in 2022: 2.9%House/condo owner moved in on average 8 years ago
Renter moved in on average 2 years ago
Private vs. public school enrollment:
Students in private schools in grades 1 to 8 (elementary and middle school): 908 Students in private schools in grades 9 to 12 (high school): 273 Students in private undergraduate colleges: 446