Rockville, MD (Maryland) Houses and Residents
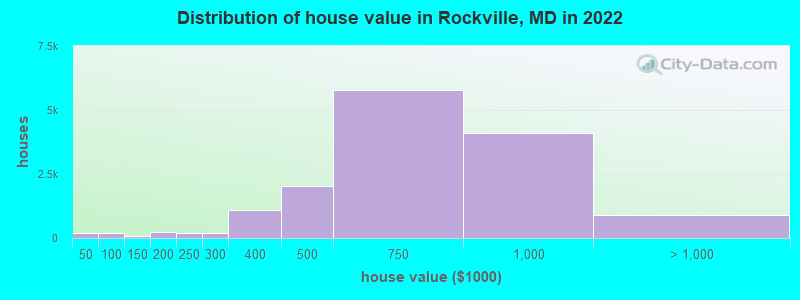
Estimated median house or condo value in 2022: $662,400 (it was $192,800 in 2000 )
Rockville:
$662,400Maryland:
$398,100
Lower value quartile - upper value quartile: $493,400 - $857,200Mean price in 2022: Detached houses: $860,331 Here:
$860,331State:
$526,819
Townhouses or other attached units: $795,155 Here:
$795,155State:
$328,305
In 3-to-4-unit structures: $416,930 Here:
$416,930State:
$295,378
In 5-or-more-unit structures: $554,485 Here:
$554,485State:
$350,378
Total population: 65,937 (Urban population: 47,257, Rural population: 0)
Houses: 27,917 (26,559 occupied: 13,623 owner occupied, 12,936 renter occupied )
% of renters here:
49%State:
32%
Housing density: 2,076 houses/condos per square mile
Median price asked for vacant for-sale houses and condos in 2022: $421,731.
Median contract rent in 2022: $1,954 (lower quartile is $1,620, upper quartile is over $2,000)
Median rent asked for vacant for-rent units in 2022: $1,853
Median gross rent in Rockville, MD in 2022: over $2,000
Housing units in Rockville with a mortgage: 8,997 (809 second mortgage, 0 home equity loan, 603 both second mortgage and home equity loan )Houses without a mortgage: 319
Median household income for houses/condos with a mortgage: $169,942
Median household income for apartments without a mortgage: $127,299
Median monthly housing costs: $2,062
Data:
Median house or condo value ($)
Median house or condo value ($ change since 2000)
Median house or condo value ($) - White
Median house or condo value ($) - Black or African American
Median house or condo value ($) - Asian
Median house or condo value ($) - Hispanic or Latino
Median house or condo value ($) - American Indian and Alaska Native
Median house or condo value ($) - Multirace
Median house or condo value ($) - Other Race
Median price asked for mobile homes ($)
Household density (households per square mile)
Mean house or condo value by units in structure - 1, detached ($)
Mean house or condo value by units in structure - 1, attached ($)
Mean house or condo value by units in structure - 2 ($)
Mean house or condo value by units in structure by units in structure - 3 or 4 ($)
Mean house or condo value by units in structure - 5 or more ($)
Mean house or condo value by units in structure - Boat, RV, van, etc. ($)
Mean house or condo value by units in structure - Mobile home ($)
Median contract rent ($)
Median contract rent - Lower quartile ($)
Median contract rent - Upper quartile ($)
Median gross rent ($)
Urban houses (%)
Rural houses (%)
Houses occupied (%)
Houses occupied (% change since 2000)
Houses owner occupied (%)
Houses owner occupied (% change since 2000)
Houses renter occupied (%)
Houses renter occupied (% change since 2000)
Vacant housing units - For rent (%)
Vacant housing units - For rent (% change since 2000)
Vacant housing units - For sale only (%)
Vacant housing units - For sale only (% change since 2000)
Vacant housing units - Rented or sold, not occupied (%)
Vacant housing units - Rented or sold, not occupied (% change since 2000)
Vacant housing units - For seasonal, recreational, or occasional use (%)
Vacant housing units - For seasonal, recreational, or occasional use (% change since 2000)
Vacant housing units - For migrant workers (%)
Vacant housing units - For migrant workers (% change since 2000)
Vacant housing units - Other vacant (%)
Vacant housing units - Other vacant (% change since 2000)
Median monthly housing costs ($)
Median household income for houses/condos with a mortgage ($)
Median household income for houses/condos without a mortgage ($)
Median household income ($)
Median household income ($) - White
Median household income ($) - Black or African American
Median household income ($) - Asian
Median household income ($) - Hispanic or Latino
Median household income ($) - American Indian and Alaska Native
Median household income ($) - Multirace
Median household income ($) - Other Race
Mortgage status - with mortgage (%)
Mortgage status - with second mortgage (%)
Mortgage status - with home equity loan (%)
Mortgage status - with both second mortgage and home equity loan (%)
Mortgage status - without a mortgage (%)
Median year house/condo built
Median year apartment built
Household type by relationship - Male householder living alone (%)
Household type by relationship - Male householder not living alone (%)
Household type by relationship - Female householder living alone (%)
Household type by relationship - Female householder not living alone (%)
Household type by relationship - Opposite-Sex spouse (%)
Household type by relationship - Same-Sex spouse (%)
Household type by relationship - Opposite-Sex unmarried partner (%)
Household type by relationship - Same-Sex unmarried partner (%)
Household type by relationship - In group quarters (%)
Size of family households - 2-person household (%)
Size of family households - 3-person household (%)
Size of family households - 4-person household (%)
Size of family households - 5-person household (%)
Size of family households - 6-person household (%)
Size of family households - 7-or-more-person household (%)
Size of nonfamily households - 1-person household (%)
Size of nonfamily households - 2-person household (%)
Size of nonfamily households - 3-person household (%)
Size of nonfamily households - 4-person household (%)
Size of nonfamily households - 5-person household (%)
Size of nonfamily households - 6-person household (%)
Size of nonfamily households - 7-or-moreperson household (%)
Year house built - Built 2010 or later (%)
Year house built - Built 2000 to 2009 (%)
Year house built - Built 1990 to 1999 (%)
Year house built - Built 1980 to 1989 (%)
Year house built - Built 1970 to 1979 (%)
Year house built - Built 1960 to 1969 (%)
Year house built - Built 1950 to 1959 (%)
Year house built - Built 1940 to 1949 (%)
Year house built - Built 1939 or earlier (%)
Median number of rooms in houses and condos
Median number of rooms in apartments
Median number of bedrooms in owner occupied houses
Mean number of bedrooms in owner occupied houses
Median number of bedrooms in renter occupied houses
Mean number of bedrooms in renter occupied houses
Median number of vehichles in owner occupied houses
Mean number of vehichles in owner occupied houses
Median number of vehichles in renter occupied houses
Mean number of vehichles in renter occupied houses
Rooms in owner-occupied houses - 1 room (%)
Rooms in owner-occupied houses - 2 rooms (%)
Rooms in owner-occupied houses - 3 rooms (%)
Rooms in owner-occupied houses - 4 rooms (%)
Rooms in owner-occupied houses - 5 rooms (%)
Rooms in owner-occupied houses - 6 rooms (%)
Rooms in owner-occupied houses - 7 rooms (%)
Rooms in owner-occupied houses - 8 rooms (%)
Rooms in owner-occupied houses - 9+ rooms (%)
Rooms in renter-occupied houses - 1 room (%)
Rooms in renter-occupied houses - 2 rooms (%)
Rooms in renter-occupied houses - 3 rooms (%)
Rooms in renter-occupied houses - 4 rooms (%)
Rooms in renter-occupied houses - 5 rooms (%)
Rooms in renter-occupied houses - 6 rooms (%)
Rooms in renter-occupied houses - 7 rooms (%)
Rooms in renter-occupied houses - 8 rooms (%)
Rooms in renter-occupied houses - 9+ rooms (%)
Bedrooms in owner-occupied houses - no bedrooms (%)
Bedrooms in owner-occupied houses - 1 bedroom (%)
Bedrooms in owner-occupied houses - 2 bedrooms (%)
Bedrooms in owner-occupied houses - 3 bedrooms (%)
Bedrooms in owner-occupied houses - 4 bedrooms (%)
Bedrooms in owner-occupied houses - 5+ bedrooms (%)
Bedrooms in renter-occupied houses - no bedrooms (%)
Bedrooms in renter-occupied houses - 1 bedroom (%)
Bedrooms in renter-occupied houses - 2 bedrooms (%)
Bedrooms in renter-occupied houses - 3 bedrooms (%)
Bedrooms in renter-occupied houses - 4 bedrooms (%)
Bedrooms in renter-occupied houses - 5+ bedrooms (%)
Vehicles available in owner-occupied houses - no vehicle available (%)
Vehicles available in owner-occupied houses - 1 vehicle available(%)
Vehicles available in owner-occupied houses - 2 Vehicles available (%)
Vehicles available in owner-occupied houses - 3 Vehicles available (%)
Vehicles available in owner-occupied houses - 4 Vehicles available (%)
Vehicles available in owner-occupied houses - 5+ Vehicles available (%)
Vehicles available in renter-occupied houses - no vehicle available (%)
Vehicles available in renter-occupied houses - 1 vehicle available (%)
Vehicles available in renter-occupied houses - 2 Vehicles available (%)
Vehicles available in renter-occupied houses - 3 Vehicles available (%)
Vehicles available in renter-occupied houses - 4 Vehicles available (%)
Vehicles available in renter-occupied houses - 5+ Vehicles available (%)
Housing units in structures - 1, detached (%)
Housing units in structures - 1, attached (%)
Housing units in structures - 2 (%)
Housing units in structures - 3 or 4 (%)
Housing units in structures - 5 to 9 (%)
Housing units in structures - 10 to 19 (%)
Housing units in structures - 20 to 49 (%)
Housing units in structures - 50 or more (%)
Housing units in structures - Mobile home (%)
Housing units in structures - Boat, RV, van, etc. (%)
Housing units in structures - Owners - 1, detached (%)
Housing units in structures - Owners - 1, attached (%)
Housing units in structures - Owners - 2 (%)
Housing units in structures - Owners - 3 or 4 (%)
Housing units in structures - Owners - 5 to 9 (%)
Housing units in structures - Owners - 10 to 19 (%)
Housing units in structures - Owners - 20 to 49 (%)
Housing units in structures - Owners - 50 or more (%)
Housing units in structures - Owners - Mobile home (%)
Housing units in structures - Owners - Boat, RV, van, etc. (%)
Housing units in structures - Renters - 1, detached (%)
Housing units in structures - Renters - 1, attached (%)
Housing units in structures - Renters - 2 (%)
Housing units in structures - Renters - 3 or 4 (%)
Housing units in structures - Renters - 5 to 9 (%)
Housing units in structures - Renters - 10 to 19 (%)
Housing units in structures - Renters - 20 to 49 (%)
Housing units in structures - Renters - 50 or more (%)
Housing units in structures - Renters - Mobile home (%)
Housing units in structures - Renters - Boat, RV, van, etc. (%)
House/condo owner moved in on average (years ago)
Renter moved in on average (years ago)
Year householder moved into unit - Moved in 1999 to March 2000 (%)
Year householder moved into unit - Moved in 1999 to March 2000 (%) - White
Year householder moved into unit - Moved in 1999 to March 2000 (%) - Black or African American
Year householder moved into unit - Moved in 1999 to March 2000 (%) - Asian
Year householder moved into unit - Moved in 1999 to March 2000 (%) - Hispanic or Latino
Year householder moved into unit - Moved in 1999 to March 2000 (%) - American Indian and Alaska Native
Year householder moved into unit - Moved in 1999 to March 2000 (%) - Multirace
Year householder moved into unit - Moved in 1999 to March 2000 (%) - Other Race
Year householder moved into unit - Moved in 1995 to 1998 (%)
Year householder moved into unit - Moved in 1995 to 1998 (%) - White
Year householder moved into unit - Moved in 1995 to 1998 (%) - Black or African American
Year householder moved into unit - Moved in 1995 to 1998 (%) - Asian
Year householder moved into unit - Moved in 1995 to 1998 (%) - Hispanic or Latino
Year householder moved into unit - Moved in 1995 to 1998 (%) - American Indian and Alaska Native
Year householder moved into unit - Moved in 1995 to 1998 (%) - Multirace
Year householder moved into unit - Moved in 1995 to 1998 (%) - Other Race
Year householder moved into unit - Moved in 1990 to 1994 (%)
Year householder moved into unit - Moved in 1990 to 1994 (%) - White
Year householder moved into unit - Moved in 1990 to 1994 (%) - Black or African American
Year householder moved into unit - Moved in 1990 to 1994 (%) - Asian
Year householder moved into unit - Moved in 1990 to 1994 (%) - Hispanic or Latino
Year householder moved into unit - Moved in 1990 to 1994 (%) - American Indian and Alaska Native
Year householder moved into unit - Moved in 1990 to 1994 (%) - Multirace
Year householder moved into unit - Moved in 1990 to 1994 (%) - Other Race
Year householder moved into unit - Moved in 1980 to 1989 (%)
Year householder moved into unit - Moved in 1980 to 1989 (%) - White
Year householder moved into unit - Moved in 1980 to 1989 (%) - Black or African American
Year householder moved into unit - Moved in 1980 to 1989 (%) - Asian
Year householder moved into unit - Moved in 1980 to 1989 (%) - Hispanic or Latino
Year householder moved into unit - Moved in 1980 to 1989 (%) - American Indian and Alaska Native
Year householder moved into unit - Moved in 1980 to 1989 (%) - Multirace
Year householder moved into unit - Moved in 1980 to 1989 (%) - Other Race
Year householder moved into unit - Moved in 1970 to 1979 (%)
Year householder moved into unit - Moved in 1970 to 1979 (%) - White
Year householder moved into unit - Moved in 1970 to 1979 (%) - Black or African American
Year householder moved into unit - Moved in 1970 to 1979 (%) - Asian
Year householder moved into unit - Moved in 1970 to 1979 (%) - Hispanic or Latino
Year householder moved into unit - Moved in 1970 to 1979 (%) - American Indian and Alaska Native
Year householder moved into unit - Moved in 1970 to 1979 (%) - Multirace
Year householder moved into unit - Moved in 1970 to 1979 (%) - Other Race
Year householder moved into unit - Moved in 1969 or earlier (%)
Year householder moved into unit - Moved in 1969 or earlier (%) - White
Year householder moved into unit - Moved in 1969 or earlier (%) - Black or African American
Year householder moved into unit - Moved in 1969 or earlier (%) - Asian
Year householder moved into unit - Moved in 1969 or earlier (%) - Hispanic or Latino
Year householder moved into unit - Moved in 1969 or earlier (%) - American Indian and Alaska Native
Year householder moved into unit - Moved in 1969 or earlier (%) - Multirace
Year householder moved into unit - Moved in 1969 or earlier (%) - Other Race
Housing units lacking complete plumbing facilities (%)
Housing units lacking complete kitchen facilities (%)
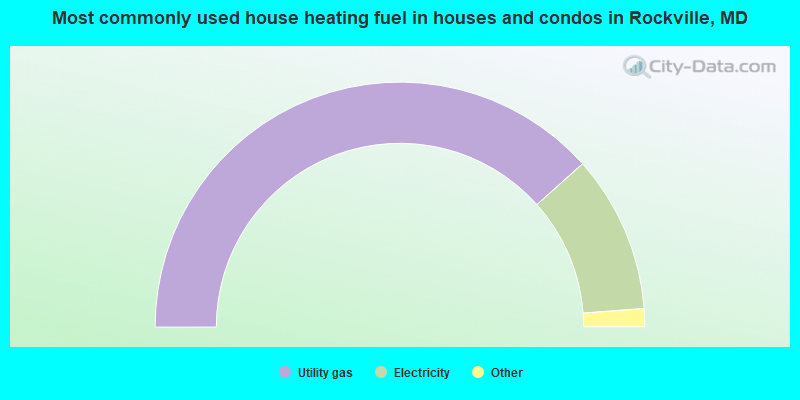
House heating fuel used in houses and condos - Utility gas (%)
House heating fuel used in houses and condos - Bottled, tank, or LP gas (%)
House heating fuel used in houses and condos - Electricity (%)
House heating fuel used in houses and condos - Fuel oil, kerosene, etc. (%)
House heating fuel used in houses and condos - Coal or coke (%)
House heating fuel used in houses and condos - Wood (%)
House heating fuel used in houses and condos - Solar energy (%)
House heating fuel used in houses and condos - Other fuel (%)
House heating fuel used in houses and condos - No fuel used (%)
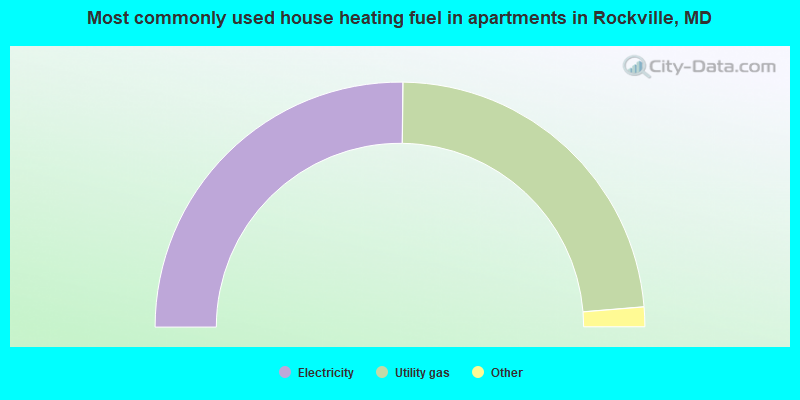
House heating fuel used in apartments - Utility gas (%)
House heating fuel used in apartments - Bottled, tank, or LP gas (%)
House heating fuel used in apartments - Electricity (%)
House heating fuel used in apartments - Fuel oil, kerosene, etc. (%)
House heating fuel used in apartments - Coal or coke (%)
House heating fuel used in apartments - Wood (%)
House heating fuel used in apartments - Solar energy (%)
House heating fuel used in apartments - Other fuel (%)
House heating fuel used in apartments - No fuel used (%)
Latest news about housing in Rockville, MD collected exclusively by city-data.com from local newspapers, TV, and radio stations
Median year house/condo built: 1974Median year apartment built: 1997Household type by relationship:
Households: 66,915
Male householders: 13,788 (3,780 living alone ), Female householders: 12,771 (4,284 living alone )12,287 spouses (12,176 opposite-sex spouses ), 1,331 unmarried partners , (1,278 opposite-sex unmarried partners ), 17,703 children (16,899 natural , 133 adopted , 671 stepchildren ), 399 grandchildren , 882 brothers or sisters , 657 parents , 0 foster children , 1,245 other relatives , 4,721 non-relatives In group quarters: 1,131
Size of family households: 6,918 2-persons , 3,939 3-persons , 3,667 4-persons , 1,363 5-persons , 151 6-persons , 385 7-or-more-persons .
Size of nonfamily households: 8,064 1-person , 1,483 2-persons , 119 3-persons , 425 4-persons , 45 5-persons .
9,670 married couples with children. single-parent households (715 men , 2,702 women ).
53.6% of residents of Rockville speak English at home. of residents speak Spanish at home (52% speak English very well , 24% speak English well , 16% speak English not well , 8% don't speak English at all ).of residents speak other Indo-European language at home (77% speak English very well , 15% speak English well , 6% speak English not well , 2% don't speak English at all ).of residents speak Asian or Pacific Island language at home (51% speak English very well , 25% speak English well , 20% speak English not well , 4% don't speak English at all ).of residents speak other language at home (80% speak English very well , 20% speak English well ).
Foreign born population: 25,888 (38.7%)of them are naturalized citizens )
Median number of rooms in houses and condos:
Median number of rooms in apartments
Owner-occupied Renter-occupied
Rooms in owner-occupied houses in Rockville, Maryland
0 1 room 81 2 rooms 412 3 rooms 1,087 4 rooms 1,321 5 rooms 2,644 6 rooms 1,865 7 rooms 2,153 8 rooms 4,060 9+ rooms
Rooms in renter-occupied apartments in Rockville, Maryland
552 1 room 1,685 2 rooms 2,184 3 rooms 4,172 4 rooms 2,240 5 rooms 714 6 rooms 946 7 rooms 160 8 rooms 283 9+ rooms
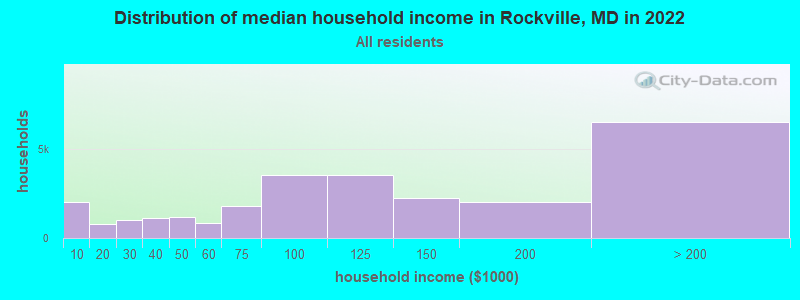
Rockville, MD household income distribution 2,003 Less than $10,000794 $10,000 to $19,9991,034 $20,000 to $29,9991,129 $30,000 to $39,9991,168 $40,000 to $49,999825 $50,000 to $59,9991,784 $60,000 to $74,9993,553 $75,000 to $99,9993,517 $100,000 to $124,9992,228 $125,000 to $149,9992,027 $150,000 to $199,9996,497 $200,000 or more
Home value of owner - occupied houses in 2022 in Rockville, MD 75 Less than $10,00017 $30,000 to $34,999101 $40,000 to $49,99917 $50,000 to $59,99916 $60,000 to $69,99932 $70,000 to $79,99922 $90,000 to $99,99978 $100,000 to $124,9998 $125,000 to $149,999162 $150,000 to $174,99963 $175,000 to $199,999195 $200,000 to $249,999201 $250,000 to $299,9991,095 $300,000 to $399,9992,025 $400,000 to $499,9995,768 $500,000 to $749,9994,116 $750,000 to $999,999871 $1,000,000 to $1,499,99912 $1,500,000 to $1,999,99931 $2,000,000 or moreRent paid by renters in 2022 in Rockville, MD 58 Less than $10065 $100 to $14974 $150 to $19958 $200 to $249104 $250 to $29940 $300 to $3498 $400 to $44910 $500 to $54933 $550 to $59949 $600 to $6498 $650 to $69959 $700 to $74930 $750 to $799299 $800 to $89959 $900 to $999150 $1,000 to $1,2491,252 $1,250 to $1,4993,695 $1,500 to $1,9993,199 $2,000 to $2,4991,186 $2,500 to $2,999384 $3,000 to $3,499299 $3,500 or more352 No cash rent
Percentage of workers working in this county: 76.8%Number of people working at home: 11,075 (31.6% of all workers )
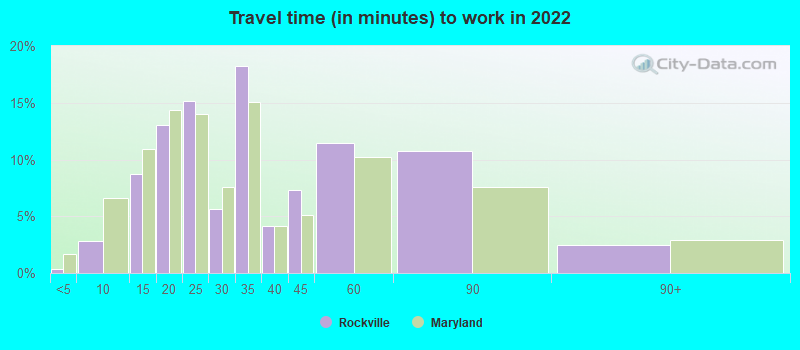
Travel time to work (commute)
Less than 5 minutes: 3345 to 9 minutes: 1,65010 to 14 minutes: 2,61415 to 19 minutes: 2,73520 to 24 minutes: 3,74525 to 29 minutes: 96330 to 34 minutes: 4,94635 to 39 minutes: 19140 to 44 minutes: 1,96745 to 59 minutes: 3,06060 to 89 minutes: 1,55090 or more minutes: 167
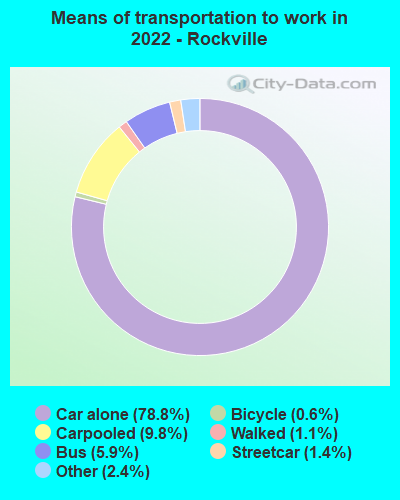
Means of transportation to work:
Drove a car alone: 38,846 (64.3%)Carpooled: 4,811 (8.0%)Bus : 2,924 (4.8%)Subway or elevated rail : 676 (1.1%)Taxi: 1,189 (2.0%)Bicycle: 316 (0.5%)Walked: 555 (0.9%)Worked at home: 11,075 (18.3%)
Unemployment by race in 2022
Unemployment rate for White non-Hispanic residents 1.3% FemalesUnemployment rate for Black residents 1.4% Males7.4% FemalesUnemployment rate for American Indian and Alaska Native residents 13.4% FemalesUnemployment rate for Asian residents 1.9% Males1.9% FemalesUnemployment rate for other race residents 1.4% Males6.0% FemalesUnemployment rate for two or more race residents 1.3% Males3.3% FemalesUnemployment rate for Hispanic or Latino residents 4.3% Males5.3% Females
Year of entry for the foreign-born population in Rockville, Maryland
9,955 2010 or later 5,567 2000 to 2009 4,059 1990 to 1999 3,373 1980 to 1989 1,597 1970 to 1979 1,309 Before 1970
First ancestries reported:
German: 1,709 (4.1%)
English: 1,328 (3.2%)
Iranian: 1,197 (2.8%)
Russian: 1,077 (2.6%)
Irish: 1,041 (2.5%)
American: 994 (2.4%)
European: 840 (2.0%)
Eastern European: 787 (1.9%)
Polish: 746 (1.8%)
Ethiopian: 724 (1.7%)
Italian: 708 (1.7%)
Turkish: 412 (1.0%)
Portuguese: 350 (0.8%)
Brazilian: 347 (0.8%)
Syrian: 313 (0.7%)
Ukrainian: 312 (0.7%)
Slovak: 286 (0.7%)
Greek: 267 (0.6%)
Romanian: 242 (0.6%)
Nigerian: 237 (0.6%)
Haitian: 203 (0.5%)
Egyptian: 191 (0.5%)
Scottish: 166 (0.4%)
Armenian: 165 (0.4%)
Israeli: 154 (0.4%)
Northern European: 145 (0.3%)
African: 133 (0.3%)
Trinidadian and Tobagonian: 129 (0.3%)
British: 126 (0.3%)
Jamaican: 110 (0.3%)
Hungarian: 93 (0.2%)
Lebanese: 92 (0.2%)
French: 84 (0.2%)
Slavic: 79 (0.2%)
Swedish: 78 (0.2%)
Ghanaian: 77 (0.2%)
Scotch-Irish: 73 (0.2%)
Bulgarian: 63 (0.1%)
Guyanese: 60 (0.1%)
Lithuanian: 59 (0.1%)
West Indian: 58 (0.1%)
Serbian: 48 (0.1%)
Czech: 45 (0.1%)
Ugandan: 45 (0.1%)
French Canadian: 42 (0.10%)
Iraqi: 40 (0.10%)
Yugoslavian: 33 (0.08%)
Arab: 32 (0.08%)
Scandinavian: 28 (0.07%)
Liberian: 26 (0.06%)
British West Indian: 25 (0.06%)
Dutch: 24 (0.06%)
Cypriot: 24 (0.06%)
Welsh: 23 (0.05%)
Latvian: 21 (0.05%)
Czechoslovakian: 20 (0.05%)
Albanian: 20 (0.05%)
Moroccan: 19 (0.05%)
Afghan: 18 (0.04%)
Swiss: 16 (0.04%)
Norwegian: 14 (0.03%)
Canadian: 14 (0.03%)
Assyrian: 14 (0.03%)
Jordanian: 12 (0.03%)
Cape Verdean: 11 (0.03%)
Croatian: 6 (0.01%)
Barbadian: 3 (0.01%)
Most common places of birth for foreign-born residents (%): China, excluding Hong Kong and Taiwan Rockville:
15.2% (3,681)Maryland:
4.6% (44,742)
India Rockville:
9.0% (2,190)Maryland:
6.4% (61,725)
El Salvador Rockville:
8.1% (1,963)Maryland:
12.0% (115,412)
Iran Rockville:
5.8% (1,416)Maryland:
1.3% (12,074)
Korea Rockville:
5.8% (1,404)Maryland:
3.4% (32,635)
Russia Rockville:
3.3% (793)Maryland:
1.0% (9,481)
Indonesia Rockville:
3.2% (781)Maryland:
0.3% (2,631)
Honduras Rockville:
3.1% (743)Maryland:
2.5% (24,026)
Brazil Rockville:
2.9% (712)Maryland:
1.2% (11,980)
Philippines Rockville:
2.9% (702)Maryland:
3.8% (36,698)
Taiwan Rockville:
2.8% (687)Maryland:
0.9% (8,520)
Peru Rockville:
2.0% (494)Maryland:
1.8% (17,161)
Vietnam Rockville:
1.7% (404)Maryland:
1.9% (18,716)
Israel Rockville:
1.6% (376)Maryland:
0.4% (3,756)
Venezuela Rockville:
1.5% (373)Maryland:
0.5% (4,901)
Dominican Republic Rockville:
1.5% (366)Maryland:
1.4% (13,947)
Place of birth for U.S.-born residents:
This state: 15,523Other state: 24,319Northeast: 7,188Midwest: 3,529South: 11,605West: 1,997 80.1% of Rockville residents lived in the same house 1 years ago.
Out of people who lived in different houses, 36.7% lived in this county.
Out of people who lived in different counties, 27.8% lived in Maryland.
Rockville:
80.1%State average:
88.5%
Education attainment for males 25 years and older:
No schooling: 119Nursery to 4th grade: 3445th and 6th grade: 07th and 8th grade: 6349th grade: 5510th grade: 011th grade: 16112th grade, no diploma: 202High school graduate (or equivalency): 2,314Less than 1 year of college: 855Some college more than 1 year, no degree: 1,764Associate degree: 1,036Bachelor's degree: 6,532Master's degree: 3,501Professional school degree: 1,905Doctorate degree: 2,593
Education attainment for females 25 years and older:
No schooling: 64Nursery to 4th grade: 525th and 6th grade: 2417th and 8th grade: 3939th grade: 25010th grade: 4711th grade: 24412th grade, no diploma: 345High school graduate (or equivalency): 2,655Less than 1 year of college: 1,977Some college more than 1 year, no degree: 1,998Associate degree: 1,145Bachelor's degree: 6,917Master's degree: 5,115Professional school degree: 1,260Doctorate degree: 2,435
Housing units in structures:
One, detached: 11,085One, attached: 4,478Two: 533 or 4: 3345 to 9: 33310 to 19: 3,58220 to 49: 1,88850 or more: 6,120Boats, RVs, vans, etc.: 44Housing units lacking complete plumbing facilities in 2022: 0.6%Housing units lacking complete kitchen facilities in 2022: 0.7%House/condo owner moved in on average 15 years ago
Renter moved in on average 1 years ago
Private vs. public school enrollment:
Students in private schools in grades 1 to 8 (elementary and middle school): 1,170 Students in private schools in grades 9 to 12 (high school): 254 Students in private undergraduate colleges: 1,159