Riverton, UT (Utah) Houses and Residents
| Riverton: | $581,788 |
| Utah: | $499,500 |
Total population: 41,457 (Urban population: 25,021, Rural population: 119 (all nonfarm))
Houses: 14,280 (13,807 occupied: 11,841 owner occupied, 1,881 renter occupied)
| % of renters here: | 14% |
| State: | 29% |
Housing density: 1,136 houses/condos per square mile
Median price asked for vacant for-sale houses and condos in 2022: $1,071,370.
Median contract rent in 2022: $1,682 (lower quartile is $1,300, upper quartile is over $2,000)
Median rent asked for vacant for-rent units in 2022: $2,405
Median gross rent in Riverton, UT in 2022: $1,719
Housing units in Riverton with a mortgage: 8,775 (1,345 second mortgage, 25 home equity loan, 1,147 both second mortgage and home equity loan)
Houses without a mortgage: 210
Median household income for houses/condos with a mortgage: $131,007
Median household income for apartments without a mortgage: $105,386
Median monthly housing costs: $1,774
Compare current foreclosures in Riverton, UT:
| Photo | Address | Area | Beds / Baths | Price | Details |
|---|---|---|---|---|---|

|
#1
W Crooked Sky Dr
Riverton, UT 84065
|
3,416 sq. feet
|
4 baths 6 beds |
show details | |

|
#2
S 1830 W
Riverton, UT 84065
|
2,070 sq. feet
|
2 baths 4 beds |
show details | |

|
#3
S 1300 W
Riverton, UT 84065
|
1,827 sq. feet
|
2 baths 3 beds |
show details | |

|
#4
S Mountain View Dr
Riverton, UT 84065
|
1,278 sq. feet
|
2 baths 2 beds |
show details | |

|
#5
S Wood Hollow Dr
Riverton, UT 84065
|
1,822 sq. feet
|
3 baths 3 beds |
show details | |

|
#6
W Tithing Hill Pl
Riverton, UT 84065
|
1,570 sq. feet
|
2 baths 2 beds |
show details | |

|
#7
W 12120 S
Riverton, UT 84065
|
1,572 sq. feet
|
2 baths 3 beds |
show details | |

|
#8
W Statehood Dr
Riverton, UT 84065
|
1,976 sq. feet
|
3 baths 5 beds |
show details | |

|
#9
W Salinas Dr
Riverton, UT 84065
|
2,052 sq. feet
|
2 baths 3 beds |
show details | |

|
#10
S Whatta View Pl
Riverton, UT 84065
|
1,993 sq. feet
|
2 baths 3 beds |
show details |
| Photo | Address | Area | Beds / Baths | Price | Details |
|---|---|---|---|---|---|

|
#11
S 2240 W
Riverton, UT 84065
|
2,012 sq. feet
|
2 baths 4 beds |
show details | |

|
#12
Brunello Dr
Riverton, UT 84065
|
1,182 sq. feet
|
2 baths 3 beds |
show details | |

|
#13
S Pyrenees Ave
Riverton, UT 84065
|
1,615 sq. feet
|
2 baths 3 beds |
show details | |

|
#14
W River Hills Dr
Riverton, UT 84065
|
3,080 sq. feet
|
2 baths 5 beds |
show details | |

|
#15
S 2795 W
Riverton, UT 84065
|
3,553 sq. feet
|
3 baths 5 beds |
show details | |

|
#16
S Timp View Dr
Riverton, UT 84065
|
1,914 sq. feet
|
2 baths 4 beds |
show details | |

|
#17
S 2480 W
Riverton, UT 84065
|
2,504 sq. feet
|
3 baths 5 beds |
show details | |

|
#18
W Vista Meadows Dr
Riverton, UT 84065
|
1,916 sq. feet
|
2 baths - beds |
show details | |

|
#19
S Navy Trails Ln
Riverton, UT 84065
|
- sq. feet
|
- baths - beds |
show details | |

|
#20
W 15250 S
Riverton, UT 84065
|
- sq. feet
|
- baths - beds |
show details |
| Photo | Address | Area | Beds / Baths | Price | Details |
|---|---|---|---|---|---|

|
#21
S Gallant Dr
Riverton, UT 84065
|
- sq. feet
|
- baths - beds |
show details | |

|
#22
W Cyan Valley Way
Riverton, UT 84065
|
- sq. feet
|
- baths - beds |
show details | |

|
#23
S Stafford View Dr
Riverton, UT 84065
|
- sq. feet
|
- baths - beds |
show details | |

|
#24
W 14000 S
Riverton, UT 84065
|
- sq. feet
|
- baths - beds |
show details | |

|
#25
S Porter Rockwell Blvd, Apt C308
Riverton, UT 84065
|
- sq. feet
|
- baths - beds |
show details | |

|
#26
W Gallant Dr
Riverton, UT 84065
|
- sq. feet
|
- baths - beds |
show details | |

|
#27
S Marketview Dr Apt D102
Riverton, UT 84065
|
- sq. feet
|
- baths - beds |
show details | |

|
#28
W Winford Dr
Riverton, UT 84065
|
- sq. feet
|
- baths - beds |
show details | |

|
#29
S 2610 W
Riverton, UT 84065
|
- sq. feet
|
- baths - beds |
show details | |

|
#30
S Redwood Rd
Riverton, UT 84065
|
- sq. feet
|
- baths - beds |
show details |
| Photo | Address | Area | Beds / Baths | Price | Details |
|---|---|---|---|---|---|

|
#31
W Canyon Lands Dr
Riverton, UT 84065
|
- sq. feet
|
- baths - beds |
show details | |

|
#32
S Porter Rockwell Blvd, # E
Riverton, UT 84065
|
- sq. feet
|
- baths - beds |
show details | |

|
#33
S Sonora Way
Riverton, UT 84065
|
- sq. feet
|
- baths - beds |
show details | |

|
#34
S Porter Rockwell Blvd, # Aptb215
Riverton, UT 84065
|
- sq. feet
|
- baths - beds |
show details | |

|
#35
S Beacon Point Ln, Apt I12
Riverton, UT 84065
|
- sq. feet
|
- baths - beds |
show details | |

|
#36
S Beacon Point Ln, Apt L12
Riverton, UT 84065
|
- sq. feet
|
- baths - beds |
show details | |

|
#37
S Marketview Dr Apt J301
Riverton, UT 84065
|
- sq. feet
|
- baths - beds |
show details | |

|
#38
S Tarawa Dr
Riverton, UT 84065
|
- sq. feet
|
- baths - beds |
show details | |

|
#39
S Gallant Dr
Riverton, UT 84065
|
- sq. feet
|
- baths - beds |
show details | |

|
#40
South Airport Road
Riverton, UT 84065
|
- sq. feet
|
- baths - beds |
show details |
| Photo | Address | Area | Beds / Baths | Price | Details |
|---|---|---|---|---|---|

|
#41
S Marketview Dr Apt J303
Riverton, UT 84065
|
- sq. feet
|
- baths - beds |
show details | |

|
#42
S Midnight View Way
Riverton, UT 84065
|
- sq. feet
|
- baths - beds |
show details | |

|
#43
South 2117 West
Riverton, UT 84065
|
- sq. feet
|
- baths - beds |
show details | |

|
#44
S Glengarry Ln
Riverton, UT 84065
|
- sq. feet
|
- baths - beds |
show details | |

|
#45
W Marblewood Dr
Riverton, UT 84065
|
- sq. feet
|
- baths - beds |
show details | |

|
#46
S Tack Way
Riverton, UT 84065
|
- sq. feet
|
- baths - beds |
show details | |

|
#47
W Park Ave Apt 324
Riverton, UT 84065
|
- sq. feet
|
- baths - beds |
show details | |

|
#48
S White Rock Ln
Riverton, UT 84065
|
- sq. feet
|
- baths - beds |
show details | |

|
#49
W Bridal Veil Dr
Riverton, UT 84065
|
- sq. feet
|
- baths - beds |
show details | |

|
Check over 1 million property listings on Foreclosure.com!
|
browse all offers | |||

Latest news about housing in Riverton, UT collected exclusively by city-data.com from local newspapers, TV, and radio stations

 | Apartment prices rising while quality degrading? (9 replies) |
| Need some help finding the perfect spot to live around Salt Lake (16 replies) |
| Looking for a neighborhood in SLC suburbs (14 replies) |
| Techie Texans Looking To Move to Utah (33 replies) |
| South Jordan versus Riverton (0 replies) |
| Relocating to SLC in late fall (9 replies) |

Median year apartment built: 2007
Household type by relationship:
Households: 45,077- Male householders: 7,034 (540 living alone), Female householders: 6,213 (1,194 living alone)
9,540 spouses (9,468 opposite-sex spouses), 374 unmarried partners, (306 opposite-sex unmarried partners), 17,402 children (16,178 natural, 563 adopted, 660 stepchildren), 1,088 grandchildren, 442 brothers or sisters, 708 parents, 0 foster children, 1,089 other relatives, 1,058 non-relatives
- In group quarters: 126
Size of family households: 3,401 2-persons, 2,519 3-persons, 2,627 4-persons, 1,332 5-persons, 844 6-persons, 679 7-or-more-persons.
Size of nonfamily households: 1,755 1-person, 187 2-persons, 108 3-persons, 63 4-persons, 65 5-persons.
11,119 married couples with children.
1,161 single-parent households (301 men, 860 women).
89.0% of residents of Riverton speak English at home.
5.7% of residents speak Spanish at home (63% speak English very well, 7% speak English well, 17% speak English not well, 12% don't speak English at all).
1.6% of residents speak other Indo-European language at home (95% speak English very well, 5% speak English well).
2.6% of residents speak Asian or Pacific Island language at home (88% speak English very well, 9% speak English well, 3% speak English not well).
0.1% of residents speak other language at home (71% speak English very well, 29% speak English well).
Foreign born population: 2,766 (6.1%)
(43.4% of them are naturalized citizens)
| Here: | 8.2 |
| State: | 7.6 |
| Here: | 5.1 |
| State: | 4.3 |

- Bedrooms in owner-occupied houses and condos in Riverton, Utah
- 0no bedroom
- 481 bedroom
- 7212 bedrooms
- 2,9053 bedrooms
- 3,3314 bedrooms
- 4,8375+ bedrooms

- Bedrooms in renter-occupied apartments in Riverton, Utah
- 94no bedroom
- 1191 bedroom
- 4292 bedrooms
- 8923 bedrooms
- 784 bedrooms
- 2715+ bedrooms

- Cars and other vehicles available in Riverton in owner-occupied houses/condos
- 214no vehicle
- 1,5201 vehicle
- 4,5842 vehicles
- 3,1093 vehicles
- 1,4794 vehicles
- 9365+ vehicles

- Cars and other vehicles available in Riverton in renter-occupied apartments
- 225no vehicle
- 4871 vehicle
- 6632 vehicles
- 2313 vehicles
- 2414 vehicles
- 345+ vehicles

- Rooms in owner-occupied houses in Riverton, Utah
- 01 room
- 02 rooms
- 2353 rooms
- 4324 rooms
- 8915 rooms
- 1,1966 rooms
- 1,6217 rooms
- 2,3188 rooms
- 5,1499+ rooms

- Rooms in renter-occupied apartments in Riverton, Utah
- 941 room
- 512 rooms
- 3563 rooms
- 3174 rooms
- 1945 rooms
- 1736 rooms
- 1877 rooms
- 1978 rooms
- 3139+ rooms


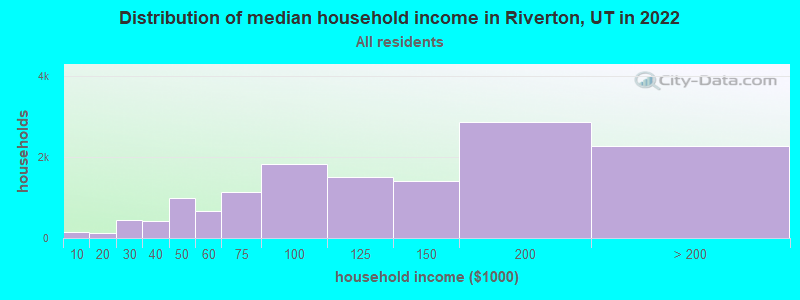
Riverton, UT household income distribution

- 154Less than $10,000
- 121$10,000 to $19,999
- 438$20,000 to $29,999
- 409$30,000 to $39,999
- 985$40,000 to $49,999
- 679$50,000 to $59,999
- 1,142$60,000 to $74,999
- 1,826$75,000 to $99,999
- 1,520$100,000 to $124,999
- 1,401$125,000 to $149,999
- 2,872$150,000 to $199,999
- 2,269$200,000 or more
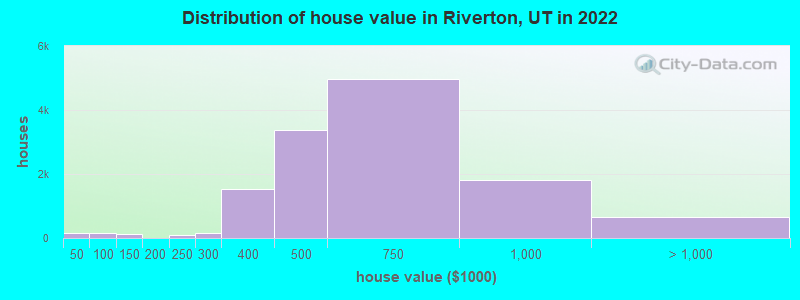
Home value of owner - occupied houses in 2022 in Riverton, UT
-
- 32Less than $10,000
- 15$20,000 to $24,999
- 16$35,000 to $39,999
- 101$40,000 to $49,999
- 15$50,000 to $59,999
- 9$70,000 to $79,999
- 20$80,000 to $89,999
- 13$90,000 to $99,999
- 128$125,000 to $149,999
- 9$150,000 to $174,999
- 90$200,000 to $249,999
- 150$250,000 to $299,999
- 1,536$300,000 to $399,999
- 3,367$400,000 to $499,999
- 4,954$500,000 to $749,999
- 1,803$750,000 to $999,999
- 457$1,000,000 to $1,499,999
- 151$1,500,000 to $1,999,999
- 50$2,000,000 or more
Rent paid by renters in 2022 in Riverton, UT
-
- 3$650 to $699
- 6$800 to $899
- 8$900 to $999
- 354$1,000 to $1,249
- 357$1,250 to $1,499
- 576$1,500 to $1,999
- 454$2,000 to $2,499
- 63$2,500 to $2,999
- 111$3,000 to $3,499
- 110No cash rent


Percentage of workers working in this county: 90.2%
Number of people working at home: 4,889 (21.4% of all workers)
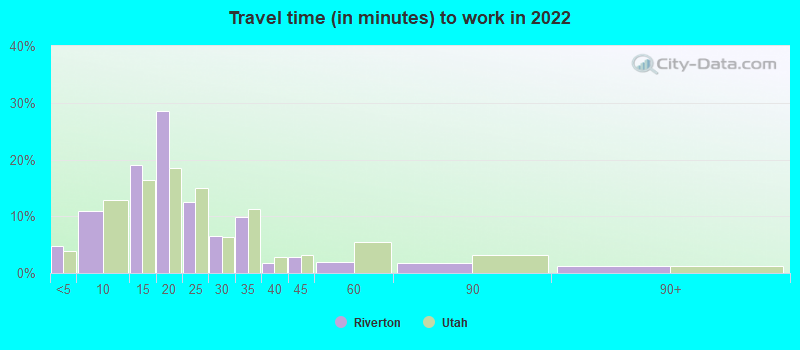
Travel time to work (commute)
- Less than 5 minutes: 445
- 5 to 9 minutes: 1,479
- 10 to 14 minutes: 1,717
- 15 to 19 minutes: 3,315
- 20 to 24 minutes: 1,969
- 25 to 29 minutes: 1,251
- 30 to 34 minutes: 3,016
- 35 to 39 minutes: 770
- 40 to 44 minutes: 1,039
- 45 to 59 minutes: 1,397
- 60 to 89 minutes: 1,232
- 90 or more minutes: 630
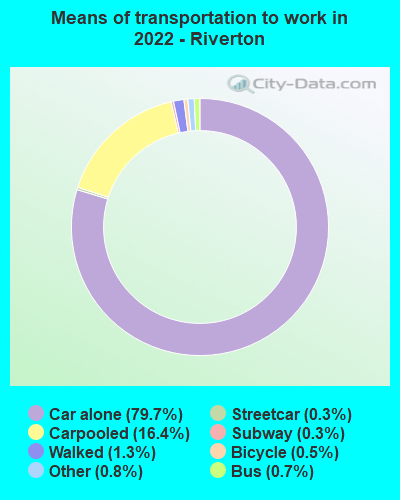
Means of transportation to work:
- Drove a car alone: 8,357 (56.5%)
- Carpooled: 1,850 (12.5%)
- Bus: 52 (0.4%)
- Subway or elevated rail: 16 (0.1%)
- Long-distance train or commuter rail: 22 (0.1%)
- Taxi: 88 (0.6%)
- Bicycle: 47 (0.3%)
- Walked: 136 (0.9%)
- Worked at home: 4,889 (33.0%)

- Unemployment by race in 2022
- Unemployment rate for White non-Hispanic residents
- 2.1%Males
- 1.4%Females
- Unemployment rate for American Indian and Alaska Native residents
- 30.3%Males
- Unemployment rate for Asian residents
- 2.3%Females
- Unemployment rate for other race residents
- 3.9%Males
- 30.3%Females
- Unemployment rate for two or more race residents
- 1.9%Females
- Unemployment rate for Hispanic or Latino residents
- 3.2%Males
- 12.8%Females

- Year of entry for the foreign-born population in Riverton, Utah
- 1,3692010 or later
- 4692000 to 2009
- 3551990 to 1999
- 1611980 to 1989
- 671970 to 1979
- 95Before 1970
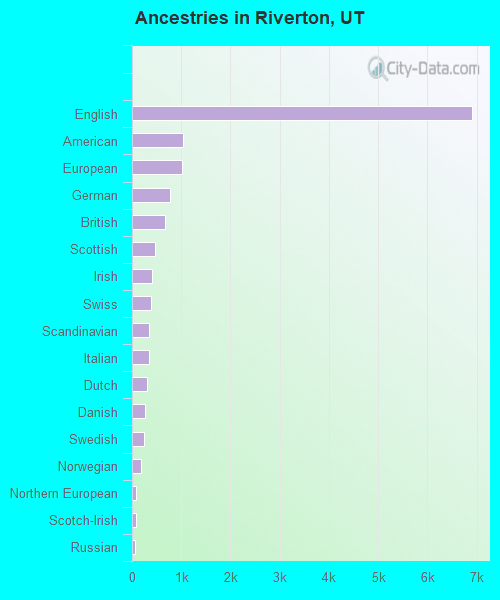
First ancestries reported:
- English: 6,905 (34.9%)
- American: 1,026 (5.2%)
- European: 1,006 (5.1%)
- German: 775 (3.9%)
- British: 677 (3.4%)
- Scottish: 473 (2.4%)
- Irish: 400 (2.0%)
- Swiss: 386 (2.0%)
- Scandinavian: 354 (1.8%)
- Italian: 344 (1.7%)
- Dutch: 310 (1.6%)
- Danish: 258 (1.3%)
- Swedish: 240 (1.2%)
- Norwegian: 176 (0.9%)
- Northern European: 85 (0.4%)
- Scotch-Irish: 76 (0.4%)
- Russian: 71 (0.4%)
- Polish: 61 (0.3%)
- Canadian: 55 (0.3%)
- Welsh: 43 (0.2%)
- Portuguese: 40 (0.2%)
- Hungarian: 39 (0.2%)
- Iranian: 36 (0.2%)
- Czech: 26 (0.1%)
- French: 20 (0.1%)
- Lebanese: 19 (0.10%)
- Austrian: 16 (0.08%)
- Australian: 13 (0.07%)
- Belgian: 12 (0.06%)
- Romanian: 11 (0.06%)
- Brazilian: 10 (0.05%)
- Arab: 8 (0.04%)
- Greek: 6 (0.03%)
- Eastern European: 4 (0.02%)
Most common places of birth for foreign-born residents (%):
| Riverton: | 29.0% (810) |
| Utah: | 3.2% (8,804) |
| Riverton: | 19.9% (555) |
| Utah: | 36.1% (99,740) |
| Riverton: | 10.9% (304) |
| Utah: | 2.0% (5,555) |
| Riverton: | 10.2% (285) |
| Utah: | 2.6% (7,211) |
| Riverton: | 4.7% (130) |
| Utah: | 3.0% (8,294) |
| Riverton: | 4.3% (121) |
| Utah: | 2.7% (7,472) |
| Riverton: | 3.1% (88) |
| Utah: | 1.1% (2,900) |
| Riverton: | 2.3% (65) |
| Utah: | 0.5% (1,269) |
| Riverton: | 2.3% (63) |
| Utah: | 3.0% (8,341) |
| Riverton: | 2.2% (62) |
| Utah: | 0.5% (1,280) |
| Riverton: | 2.0% (55) |
| Utah: | 0.6% (1,555) |
| Riverton: | 1.7% (48) |
| Utah: | 2.3% (6,468) |
| Riverton: | 1.6% (45) |
| Utah: | 2.9% (8,017) |
Place of birth for U.S.-born residents:
- This state: 32,245
- Other state: 9,541
- Northeast: 732
- Midwest: 1,892
- South: 1,271
- West: 5,609
88.6% of Riverton residents lived in the same house 1 years ago.
Out of people who lived in different houses, 39.2% lived in this county.
Out of people who lived in different counties, 58.1% lived in Utah.
| Riverton: | 88.6% |
| State average: | 85.7% |
Education attainment for males 25 years and older:
- No schooling: 696
- Nursery to 4th grade: 0
- 5th and 6th grade: 17
- 7th and 8th grade: 64
- 9th grade: 78
- 10th grade: 67
- 11th grade: 127
- 12th grade, no diploma: 582
- High school graduate (or equivalency): 2,699
- Less than 1 year of college: 800
- Some college more than 1 year, no degree: 1,915
- Associate degree: 1,814
- Bachelor's degree: 3,297
- Master's degree: 1,527
- Professional school degree: 391
- Doctorate degree: 132

Education attainment for females 25 years and older:
- No schooling: 154
- Nursery to 4th grade: 7
- 5th and 6th grade: 0
- 7th and 8th grade: 40
- 9th grade: 228
- 10th grade: 64
- 11th grade: 32
- 12th grade, no diploma: 177
- High school graduate (or equivalency): 2,995
- Less than 1 year of college: 1,328
- Some college more than 1 year, no degree: 1,916
- Associate degree: 1,788
- Bachelor's degree: 3,718
- Master's degree: 1,232
- Professional school degree: 192
- Doctorate degree: 64


Housing units in structures:
- One, detached: 11,354
- One, attached: 1,764
- Two: 33
- 3 or 4: 230
- 5 to 9: 156
- 10 to 19: 102
- 20 to 49: 397
- 50 or more: 206
- Mobile homes: 34
Housing units lacking complete kitchen facilities in 2022: 0.1%

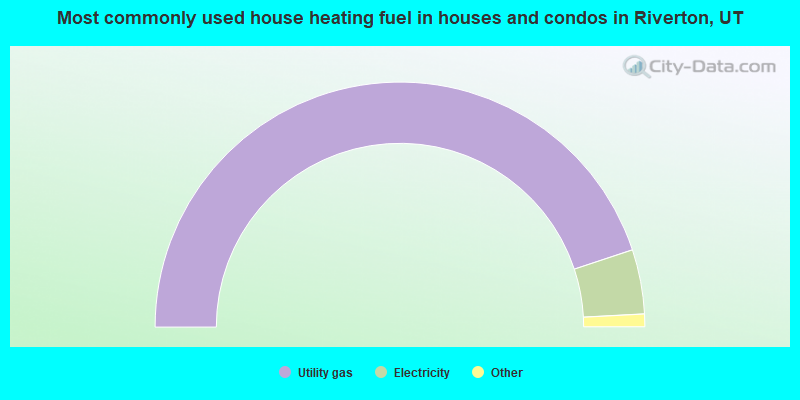
- 89.8%Utility gas
- 8.5%Electricity
- 0.8%Bottled, tank, or LP gas
- 0.7%Solar energy
- 0.1%Wood
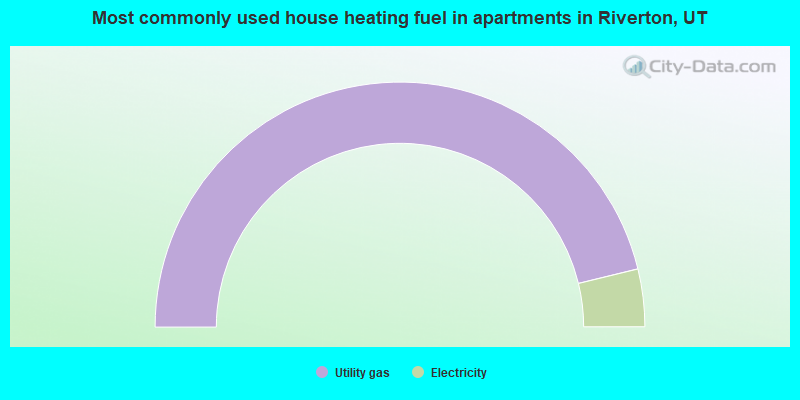
- 92.4%Utility gas
- 7.6%Electricity
Private vs. public school enrollment:
| Here: | 5.4% |
| Utah: | 7.2% |
| Here: | 0.6% |
| Utah: | 5.3% |
| Here: | 18.9% |
| Utah: | 26.7% |


