Riverton-Boulevard Park, WA (Washington) Houses and Residents
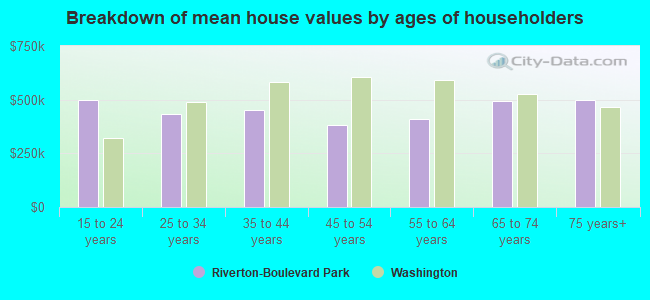
| Riverton-Boulevard Park: | $532,401 |
| Washington: | $569,500 |
Total population: 11,948 (Urban population: 11,389, Rural population: 0)
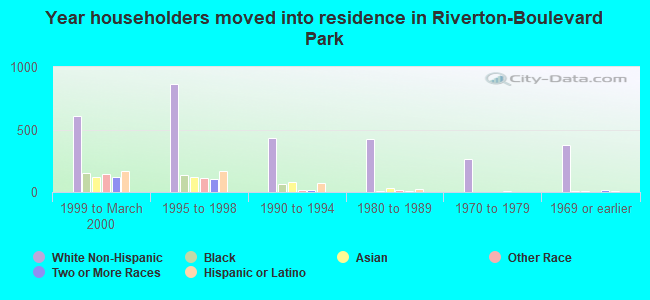
Houses: 4,633 (4,451 occupied: 2,240 owner occupied, 2,211 renter occupied)
| % of renters here: | 50% |
| State: | 36% |
Housing density: 1,700 houses/condos per square mile
Median price asked for vacant for-sale houses and condos in 2022 in this county: $843,880.
Median contract rent in 2022: $1,531 (lower quartile is $1,249, upper quartile is $1,932)
Median rent asked for vacant for-rent units in 2022: $2,358
Median gross rent in Riverton-Boulevard Park, WA in 2022: $1,656
Housing units in Riverton-Boulevard Park with a mortgage: 1,371 (249 second mortgage, 114 home equity loan, 17 both second mortgage and home equity loan)
Houses without a mortgage: 432
Compare current foreclosures near Riverton-Boulevard Park, WA:
| Photo | Address | Area | Beds / Baths | Price | Details |
|---|---|---|---|---|---|

|
#1
1st Ave S # 806
Seattle, WA 98104
|
806 sq. feet
|
1 baths 1 beds |
show details | |

|
#2
42nd Ave S Apt 101
Kent, WA 98032
|
995 sq. feet
|
2 baths 2 beds |
show details | |

|
#3
Newport Way NW Apt D2
Issaquah, WA 98027
|
1,545 sq. feet
|
2 baths 3 beds |
show details | |

|
#4
57th Ave S Unit B104
Seattle, WA 98178
|
572 sq. feet
|
1 baths 1 beds |
show details | |

|
#5
S 272nd St
Seattle, WA 98198
|
960 sq. feet
|
1 baths 2 beds |
show details | |

|
#6
Marine View Cir SW
Seattle, WA 98166
|
2,190 sq. feet
|
2 baths 3 beds |
show details | |

|
#7
119th Ave SE
Kent, WA 98030
|
2,760 sq. feet
|
2 baths 4 beds |
show details | |

|
#8
Aegean Blvd NE
Bremerton, WA 98311
|
1,960 sq. feet
|
2 baths 4 beds |
show details | |

|
#9
51st Ave S
Auburn, WA 98001
|
1,610 sq. feet
|
1 baths 3 beds |
show details | |

|
#10
Burwell St
Bremerton, WA 98337
|
1,770 sq. feet
|
1 baths 3 beds |
show details |
| Photo | Address | Area | Beds / Baths | Price | Details |
|---|---|---|---|---|---|

|
#11
SE 47th Pl
Issaquah, WA 98029
|
2,610 sq. feet
|
2 baths 3 beds |
show details | |

|
#12
SW 193rd Pl
Seattle, WA 98166
|
3,280 sq. feet
|
2 baths 4 beds |
show details | |

|
#13
N 31st St
Renton, WA 98056
|
960 sq. feet
|
1 baths 3 beds |
show details | |

|
#14
154th Pl SE
Bellevue, WA 98007
|
2,370 sq. feet
|
2 baths 4 beds |
show details | |

|
#15
39th Ave W
Seattle, WA 98199
|
2,800 sq. feet
|
2 baths 3 beds |
show details | |

|
#16
SW Hudson St
Seattle, WA 98116
|
2,840 sq. feet
|
3 baths 3 beds |
show details | |

|
#17
N 3rd St
Renton, WA 98057
|
610 sq. feet
|
1 baths 1 beds |
show details | |

|
#18
S 18th St
Renton, WA 98055
|
2,680 sq. feet
|
1 baths 4 beds |
show details | |

|
#19
S 182nd St
Seattle, WA 98188
|
1,168 sq. feet
|
2 baths 3 beds |
show details | |

|
#20
9th St
Bremerton, WA 98337
|
776 sq. feet
|
1 baths 2 beds |
show details |
| Photo | Address | Area | Beds / Baths | Price | Details |
|---|---|---|---|---|---|

|
#21
112th Ave SE Apt A105
Kent, WA 98031
|
1,416 sq. feet
|
3 baths 3 beds |
show details | |

|
#22
2nd Ave S
Kent, WA 98032
|
828 sq. feet
|
1 baths 1 beds |
show details | |

|
#23
SE Petrovitsky Rd
Renton, WA 98058
|
860 sq. feet
|
1 baths 2 beds |
show details | |

|
#24
SW 334th Pl
Federal Way, WA 98023
|
1,400 sq. feet
|
2 baths 3 beds |
show details | |

|
#25
E Guiberson St
Kent, WA 98030
|
2,890 sq. feet
|
3 baths 3 beds |
show details | |

|
#26
80th Ave NE
Bothell, WA 98011
|
940 sq. feet
|
1 baths 3 beds |
show details | |

|
#27
SE 14th St
Sammamish, WA 98075
|
3,520 sq. feet
|
3 baths 6 beds |
show details | |

|
#28
27th Pl S
Kent, WA 98032
|
1,550 sq. feet
|
3 baths 4 beds |
show details | |

|
#29
SE 200th St
Maple Valley, WA 98038
|
1,530 sq. feet
|
1 baths 3 beds |
show details | |

|
#30
Military Rd S Apt 3
Seattle, WA 98188
|
1,053 sq. feet
|
2 baths 2 beds |
show details |
| Photo | Address | Area | Beds / Baths | Price | Details |
|---|---|---|---|---|---|

|
#31
NE 9th Pl Apt D306
Bellevue, WA 98005
|
687 sq. feet
|
1 baths 1 beds |
show details | |

|
#32
211th Way NE
Sammamish, WA 98074
|
910 sq. feet
|
3 baths 4 beds |
show details | |

|
#33
2nd Ave N
Auburn, WA 98001
|
1,690 sq. feet
|
1 baths 3 beds |
show details | |

|
#34
Browns Point Blvd
Tacoma, WA 98422
|
2,847 sq. feet
|
3 baths 4 beds |
show details | |

|
#35
14th Ct S
Seattle, WA 98108
|
1,960 sq. feet
|
3 baths 3 beds |
show details | |

|
#36
19th Ave S
Seattle, WA 98168
|
2,420 sq. feet
|
2 baths 2 beds |
show details | |

|
#37
SE 79th Ct
Renton, WA 98056
|
2,210 sq. feet
|
3 baths 4 beds |
show details | |

|
#38
SE 304th St
Auburn, WA 98092
|
1,810 sq. feet
|
1 baths 5 beds |
show details | |

|
#39
NW 59th St
Seattle, WA 98107
|
1,110 sq. feet
|
1 baths 3 beds |
show details | |

|
#40
SW 294th St
Federal Way, WA 98023
|
3,350 sq. feet
|
3 baths 5 beds |
show details |
| Photo | Address | Area | Beds / Baths | Price | Details |
|---|---|---|---|---|---|

|
#41
230th Way SE
Sammamish, WA 98075
|
3,036 sq. feet
|
3 baths 4 beds |
show details | |

|
#42
SW 149th St
Seattle, WA 98166
|
1,520 sq. feet
|
1 baths 3 beds |
show details | |

|
#43
77th Ave S
Seattle, WA 98178
|
3,090 sq. feet
|
4 baths 6 beds |
show details | |

|
#44
Ravenna Ave NE
Seattle, WA 98125
|
1,660 sq. feet
|
2 baths 4 beds |
show details | |

|
#45
SE 5th St
Sammamish, WA 98074
|
3,180 sq. feet
|
2 baths 4 beds |
show details | |

|
#46
SW 100th St
Seattle, WA 98146
|
2,130 sq. feet
|
1 baths 5 beds |
show details | |

|
#47
51st Ave NE
Seattle, WA 98115
|
2,450 sq. feet
|
2 baths 4 beds |
show details | |

|
#48
63rd Ave NE
Tacoma, WA 98422
|
1,904 sq. feet
|
2 baths 2 beds |
show details | |

|
#49
21st Ave SW
Seattle, WA 98106
|
1,320 sq. feet
|
2 baths 3 beds |
show details | |

|
Check over 1 million property listings on Foreclosure.com!
|
browse all offers | |||


Household type by relationship:
Households: 1,894,118- In family households: 1,455,162 (324,509 male householders, 137,001 female householders)
357,491 spouses, 491,900 children (462,739 natural, 12,743 adopted, 16,418 stepchildren), 22,208 grandchildren, 21,116 brothers or sisters, 17,956 parents, foster children, 25,527 other relatives, 45,636 non-relatives
- In nonfamily households: 438,956 (162,683 male householders (115,616 living alone)), 165,039 female householders (129,083 living alone)), 111,234 nonrelatives
- In group quarters: 37,131 (10,490 institutionalized population)
277,933 married couples with children.
81,653 single-parent households (19,170 men, 62,483 women).
70.0% of residents of Riverton-Boulevard Park speak English at home.
12.5% of residents speak Spanish at home (45% speak English very well, 27% speak English well, 18% speak English not well, 10% don't speak English at all).
2.9% of residents speak other Indo-European language at home (48% speak English very well, 20% speak English well, 26% speak English not well, 6% don't speak English at all).
13.1% of residents speak Asian or Pacific Island language at home (35% speak English very well, 30% speak English well, 30% speak English not well, 5% don't speak English at all).
1.5% of residents speak other language at home (42% speak English very well, 12% speak English well, 35% speak English not well, 11% don't speak English at all).
Foreign born population: 5,454 (36.7%)
(40.6% of them are naturalized citizens)
| Here: | 5.5 |
| State: | 6.5 |
| Here: | 3.4 |
| State: | 3.9 |
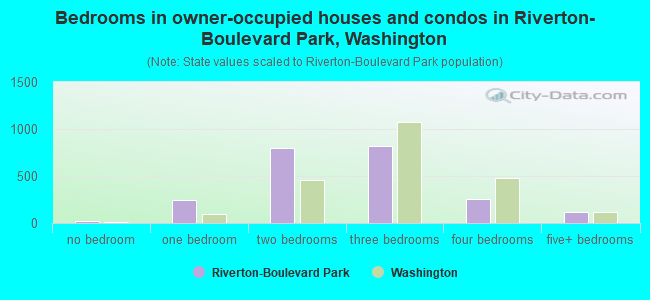
- Bedrooms in owner-occupied houses and condos in Riverton-Boulevard Park, Washington
- 17no bedroom
- 2421 bedroom
- 7932 bedrooms
- 8143 bedrooms
- 2594 bedrooms
- 1155+ bedrooms
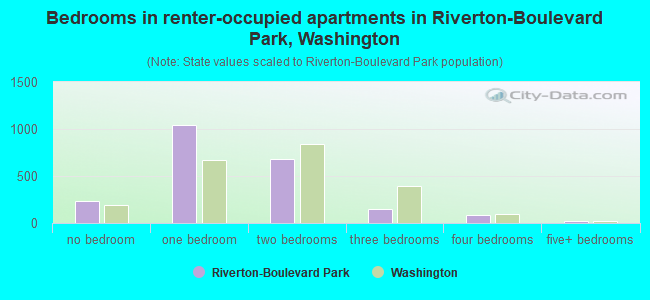
- Bedrooms in renter-occupied apartments in Riverton-Boulevard Park, Washington
- 236no bedroom
- 1,0391 bedroom
- 6832 bedrooms
- 1523 bedrooms
- 814 bedrooms
- 205+ bedrooms
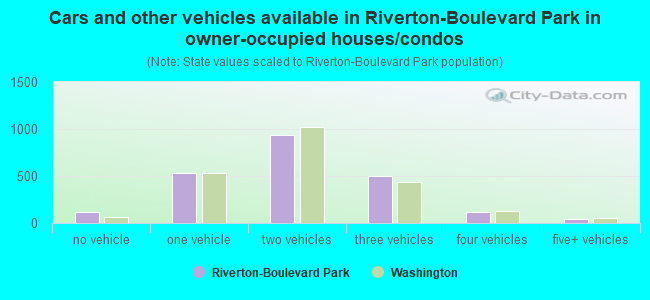
- Cars and other vehicles available in Riverton-Boulevard Park in owner-occupied houses/condos
- 116no vehicle
- 5351 vehicle
- 9352 vehicles
- 4983 vehicles
- 1134 vehicles
- 435+ vehicles
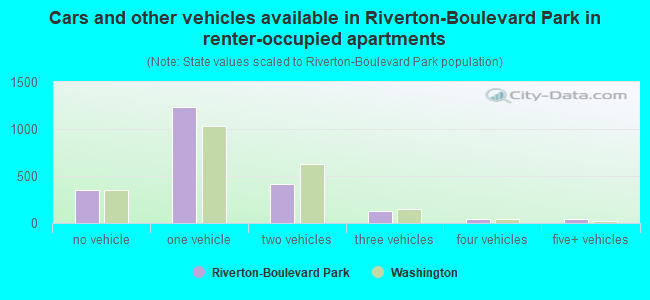
- Cars and other vehicles available in Riverton-Boulevard Park in renter-occupied apartments
- 350no vehicle
- 1,2381 vehicle
- 4162 vehicles
- 1293 vehicles
- 394 vehicles
- 395+ vehicles
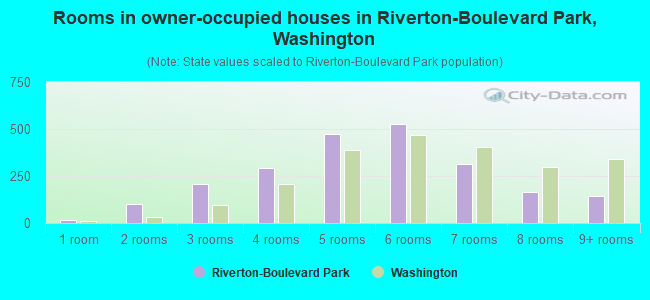
- Rooms in owner-occupied houses in Riverton-Boulevard Park, Washington
- 171 room
- 1032 rooms
- 2063 rooms
- 2934 rooms
- 4735 rooms
- 5296 rooms
- 3157 rooms
- 1638 rooms
- 1419+ rooms
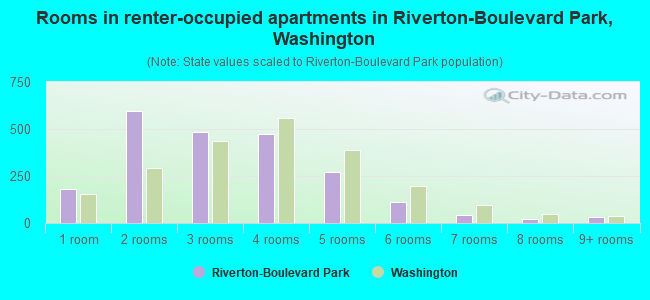
- Rooms in renter-occupied apartments in Riverton-Boulevard Park, Washington
- 1801 room
- 5942 rooms
- 4863 rooms
- 4764 rooms
- 2695 rooms
- 1116 rooms
- 427 rooms
- 208 rooms
- 339+ rooms
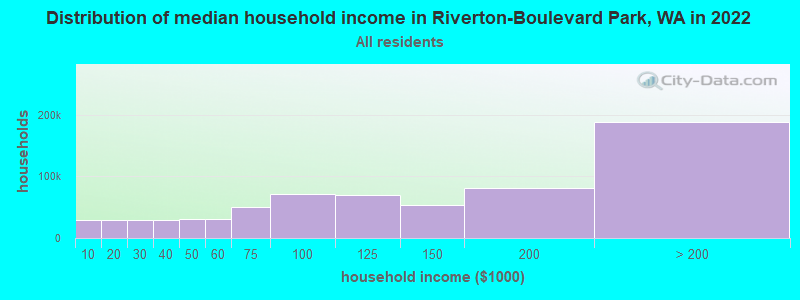
Riverton-Boulevard Park, WA household income distribution

- 29,068Less than $10,000
- 29,811$10,000 to $19,999
- 29,402$20,000 to $29,999
- 29,440$30,000 to $39,999
- 30,588$40,000 to $49,999
- 31,344$50,000 to $59,999
- 49,696$60,000 to $74,999
- 71,561$75,000 to $99,999
- 69,019$100,000 to $124,999
- 53,946$125,000 to $149,999
- 81,817$150,000 to $199,999
- 188,266$200,000 or more
Percentage of workers working in this county: 98.1%
Number of people working at home: 2,201 (30.5% of all workers)
Travel time to work (commute)
- Less than 5 minutes: 69
- 5 to 9 minutes: 424
- 10 to 14 minutes: 590
- 15 to 19 minutes: 993
- 20 to 24 minutes: 934
- 25 to 29 minutes: 307
- 30 to 34 minutes: 885
- 35 to 39 minutes: 129
- 40 to 44 minutes: 153
- 45 to 59 minutes: 405
- 60 to 89 minutes: 200
- 90 or more minutes: 116
Means of transportation to work:
- Drove a car alone: 3,584 (67.4%)
- Carpooled: 929 (17.5%)
- Bus or trolley bus: 492 (9.3%)
- Ferryboat: 15 (0.3%)
- Motorcycle: 14 (0.3%)
- Bicycle: 36 (0.7%)
- Walked: 91 (1.7%)
- Other means: 44 (0.8%)
- Worked at home: 112 (2.1%)
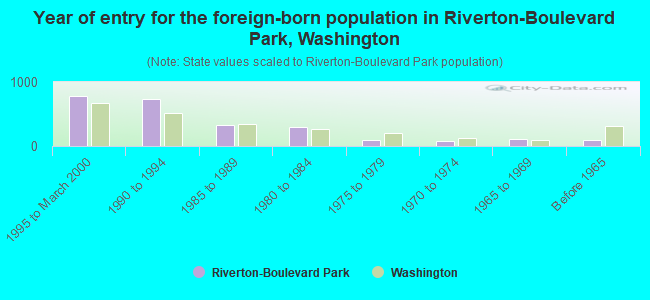
- Year of entry for the foreign-born population in Riverton-Boulevard Park, Washington
- 7771995 to March 2000
- 7411990 to 1994
- 3251985 to 1989
- 3031980 to 1984
- 931975 to 1979
- 811970 to 1974
- 1091965 to 1969
- 93Before 1965
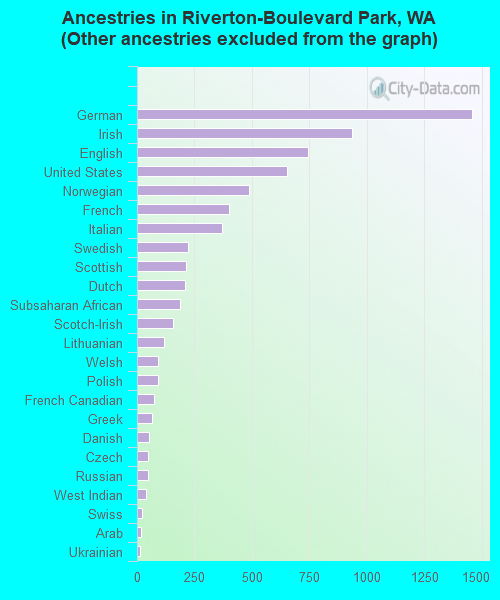
First ancestries reported:
- Other: 5,300 (44.1%)
- German: 1,458 (12.1%)
- Irish: 936 (7.8%)
- English: 744 (6.2%)
- United States: 652 (5.4%)
- Norwegian: 485 (4.0%)
- French: 398 (3.3%)
- Italian: 369 (3.1%)
- Swedish: 223 (1.9%)
- Scottish: 212 (1.8%)
- Dutch: 209 (1.7%)
- Subsaharan African: 186 (1.5%)
- Scotch-Irish: 158 (1.3%)
- Lithuanian: 119 (1.0%)
- Welsh: 93 (0.8%)
- Polish: 91 (0.8%)
- French Canadian: 76 (0.6%)
- Greek: 66 (0.5%)
- Danish: 54 (0.4%)
- Czech: 48 (0.4%)
- Russian: 46 (0.4%)
- West Indian: 41 (0.3%)
- Swiss: 22 (0.2%)
- Arab: 18 (0.1%)
- Ukrainian: 14 (0.1%)
- Hungarian: 6 (0.05%)
Most common places of birth for foreign-born residents (%):
| Riverton-Boulevard Park: | 32.9% (829) |
| Washington: | 24.1% (148,115) |
| Riverton-Boulevard Park: | 14.8% (374) |
| Washington: | 6.7% (40,879) |
| Riverton-Boulevard Park: | 8.8% (222) |
| Washington: | 7.6% (46,733) |
| Riverton-Boulevard Park: | 5.6% (141) |
| Washington: | 1.7% (10,656) |
| Riverton-Boulevard Park: | 3.8% (96) |
| Washington: | 0.7% (4,345) |
| Riverton-Boulevard Park: | 3.1% (79) |
| Washington: | 1.0% (6,438) |
| Riverton-Boulevard Park: | 2.9% (72) |
| Washington: | 2.4% (14,714) |
| Riverton-Boulevard Park: | 2.5% (63) |
| Washington: | 1.1% (6,542) |
| Riverton-Boulevard Park: | 2.3% (59) |
| Washington: | 3.4% (21,167) |
| Riverton-Boulevard Park: | 2.1% (54) |
| Washington: | 6.2% (38,172) |
| Riverton-Boulevard Park: | 2.1% (52) |
| Washington: | 7.7% (47,568) |
| Riverton-Boulevard Park: | 1.9% (48) |
| Washington: | 0.3% (1,748) |
| Riverton-Boulevard Park: | 1.8% (46) |
| Washington: | 2.8% (16,936) |
| Riverton-Boulevard Park: | 1.5% (38) |
| Washington: | 0.7% (4,414) |
Place of birth for U.S.-born residents:
- This state: 5,132
- Other state: 3,677
- Northeast: 344
- Midwest: 1,192
- South: 617
- West: 1,524
49% of Riverton-Boulevard Park residents lived in the same house 5 years ago.
Out of people who lived in different houses, 71% lived in this county.
Out of people who lived in different counties, 37% lived in Washington.
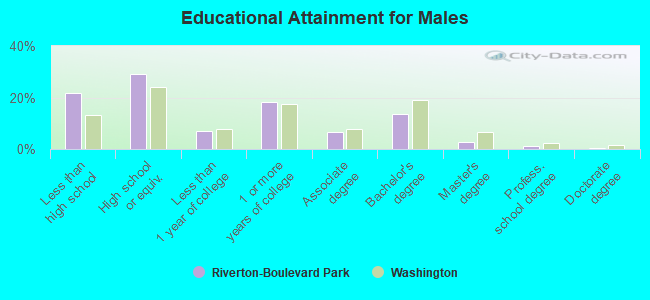
Education attainment for males 25 years and older:
- No schooling: 94
- Nursery to 4th grade: 7
- 5th and 6th grade: 134
- 7th and 8th grade: 57
- 9th grade: 81
- 10th grade: 125
- 11th grade: 99
- 12th grade, no diploma: 229
- High school graduate (or equivalency): 1,099
- Less than 1 year of college: 258
- Some college more than 1 year, no degree: 688
- Associate degree: 245
- Bachelor's degree: 512
- Master's degree: 97
- Professional school degree: 38
- Doctorate degree: 8
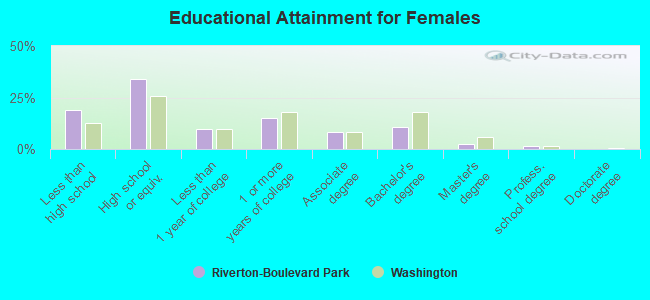
Education attainment for females 25 years and older:
- No schooling: 81
- Nursery to 4th grade: 26
- 5th and 6th grade: 88
- 7th and 8th grade: 61
- 9th grade: 73
- 10th grade: 92
- 11th grade: 74
- 12th grade, no diploma: 200
- High school graduate (or equivalency): 1,243
- Less than 1 year of college: 350
- Some college more than 1 year, no degree: 545
- Associate degree: 305
- Bachelor's degree: 393
- Master's degree: 95
- Professional school degree: 47
- Doctorate degree: 0


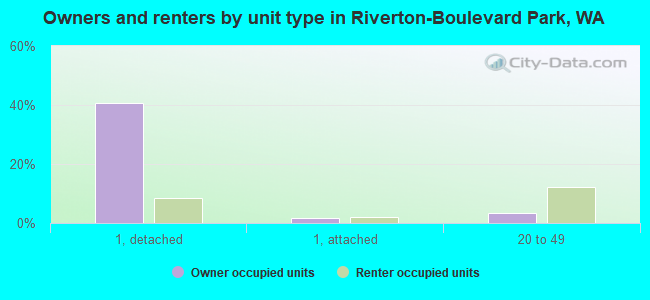
Housing units in structures:
- One, detached: 2,317
- One, attached: 179
- Two: 91
- 3 or 4: 208
- 5 to 9: 344
- 10 to 19: 271
- 20 to 49: 690
- 50 or more: 430
- Mobile homes: 60
- Boats, RVs, vans, etc.: 43
Median worth of mobile homes: $275,050
Housing units lacking complete kitchen facilities: 0.2%
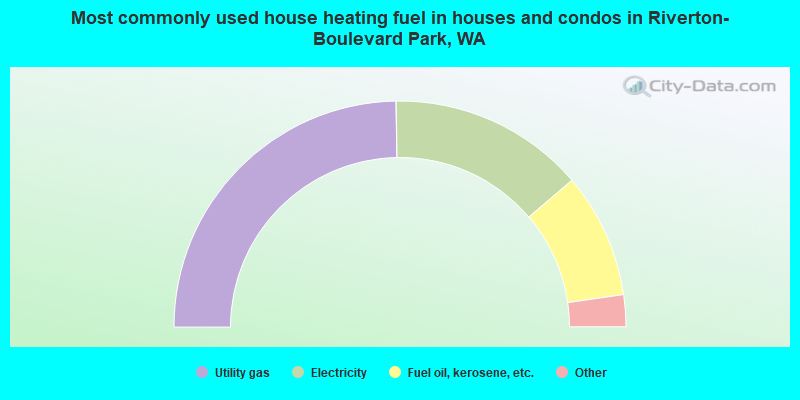
- 49.5%Utility gas
- 28.1%Electricity
- 17.9%Fuel oil, kerosene, etc.
- 2.1%Wood
- 1.4%Other fuel
- 0.7%Bottled, tank, or LP gas
- 0.4%No fuel used
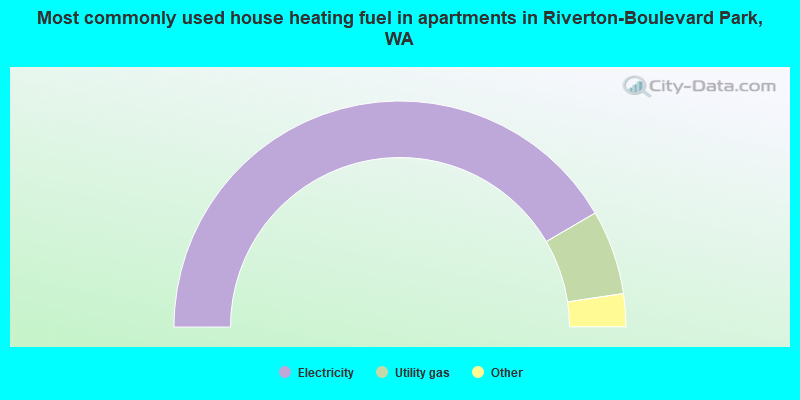
- 83.2%Electricity
- 12.1%Utility gas
- 3.0%Fuel oil, kerosene, etc.
- 1.3%Bottled, tank, or LP gas
- 0.4%Wood
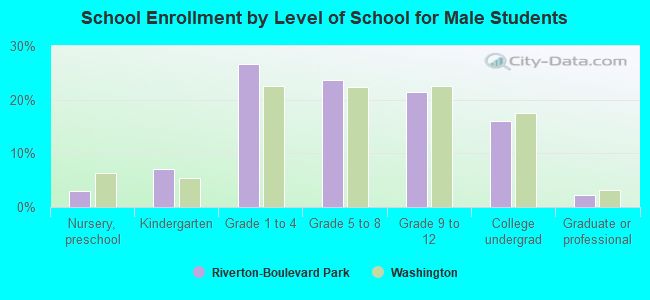
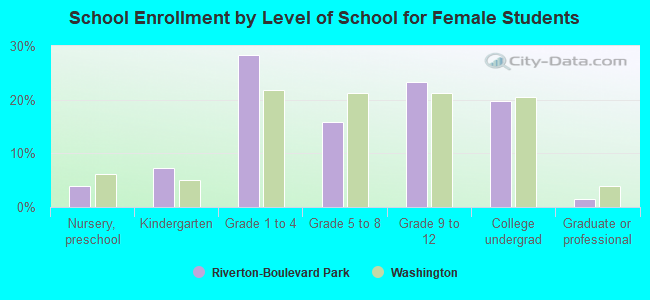
Private vs. public school enrollment:
| Here: | 6.2% |
| Washington: | 9.2% |
| Here: | 12.7% |
| Washington: | 7.0% |
| Here: | 25.8% |
| Washington: | 15.7% |