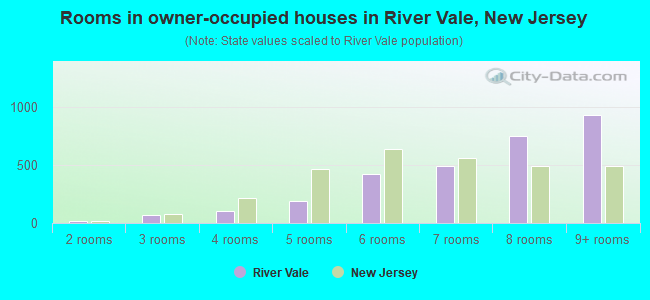
Housing density: 812 houses/condos per square mile
Median price asked for vacant for-sale houses and condos in 2022 in this county: $777,739.
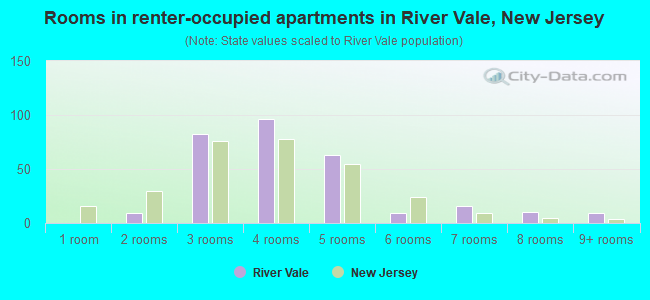
Median contract rent in 2022: over $2,000 (lower quartile is $1,667, upper quartile is over $2,000)
Median gross rent in River Vale, NJ in 2022: over $2,000
Housing units in River Vale with a mortgage: 2,068 (164 second mortgage, 355 home equity loan, 0 both second mortgage and home equity loan) Houses without a mortgage: 682
In family households: 779,421 (168,972 male householders, 69,583 female householders)
188,466 spouses, 279,702 children (268,784 natural, 4,691 adopted, 6,227 stepchildren), 10,849 grandchildren, 10,453 brothers or sisters, 14,408 parents, foster children, 12,886 other relatives, 15,359 non-relatives
In nonfamily households: 115,273 (40,798 male householders (32,649 living alone)), 56,377 female householders (50,096 living alone)), 18,098 nonrelatives
In group quarters: 10,422 (5,047 institutionalized population)
164,958 married couples with children.
25,129 single-parent households (5,042 men, 20,087 women).
84.5% of residents of River Vale speak English at home.
3.8% of residents speak Spanish at home (70% speak English very well, 20% speak English well, 8% speak English not well, 2% don't speak English at all).
7.2% of residents speak other Indo-European language at home (79% speak English very well, 14% speak English well, 6% speak English not well, 2% don't speak English at all).
4.3% of residents speak Asian or Pacific Island language at home (55% speak English very well, 33% speak English well, 10% speak English not well, 2% don't speak English at all).
0.2% of residents speak other language at home (100% speak English very well).
Foreign born population: 1,501 (14.7%)
(93.5% of them are naturalized citizens)
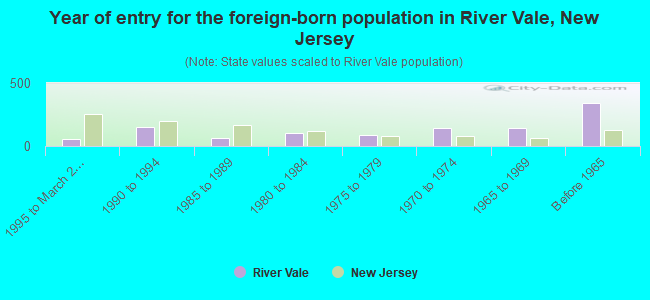
Year of entry for the foreign-born population in River Vale, New Jersey
571995 to March 2000
1521990 to 1994
651985 to 1989
1021980 to 1984
851975 to 1979
1411970 to 1974
1461965 to 1969
340Before 1965
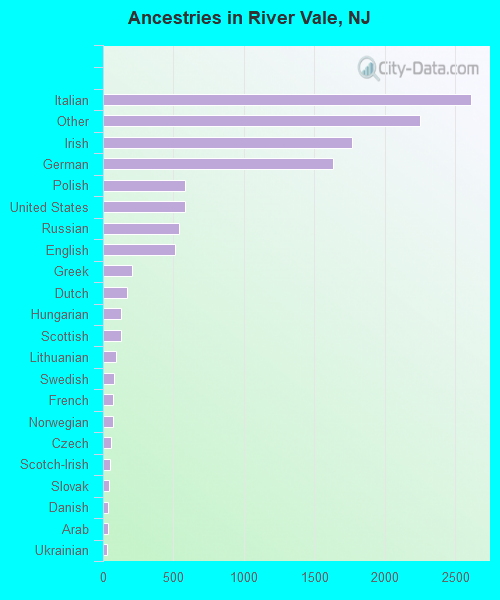
First ancestries reported:
Italian: 2,610 (22.3%)
Other: 2,253 (19.2%)
Irish: 1,767 (15.1%)
German: 1,634 (13.9%)
Polish: 581 (5.0%)
United States: 579 (4.9%)
Russian: 538 (4.6%)
English: 509 (4.3%)
Greek: 206 (1.8%)
Dutch: 167 (1.4%)
Hungarian: 130 (1.1%)
Scottish: 127 (1.1%)
Lithuanian: 89 (0.8%)
Swedish: 78 (0.7%)
French: 74 (0.6%)
Norwegian: 73 (0.6%)
Czech: 59 (0.5%)
Scotch-Irish: 51 (0.4%)
Slovak: 42 (0.4%)
Danish: 39 (0.3%)
Arab: 36 (0.3%)
Ukrainian: 26 (0.2%)
West Indian: 21 (0.2%)
Swiss: 18 (0.2%)
Portuguese: 12 (0.1%)
Welsh: 7 (0.06%)
Most common places of birth for foreign-born residents (%):
Korea
River Vale:
16.5% (180)
New Jersey:
3.5% (51,970)
Germany
River Vale:
10.4% (113)
New Jersey:
2.3% (33,531)
Russia
River Vale:
8.5% (93)
New Jersey:
1.4% (20,243)
Argentina
River Vale:
6.5% (71)
New Jersey:
0.6% (9,102)
Greece
River Vale:
5.8% (63)
New Jersey:
0.8% (12,403)
Cuba
River Vale:
5.6% (61)
New Jersey:
3.7% (55,241)
Canada
River Vale:
4.9% (53)
New Jersey:
1.1% (16,333)
Ukraine
River Vale:
4.0% (44)
New Jersey:
1.0% (14,768)
India
River Vale:
2.6% (28)
New Jersey:
8.1% (119,497)
Italy
River Vale:
2.5% (27)
New Jersey:
4.0% (58,395)
Iran
River Vale:
2.5% (27)
New Jersey:
0.4% (5,220)
Colombia
River Vale:
2.3% (25)
New Jersey:
4.7% (69,754)
Ireland
River Vale:
2.2% (24)
New Jersey:
0.8% (12,082)
Guyana
River Vale:
2.1% (23)
New Jersey:
1.2% (17,746)
Jamaica
River Vale:
1.9% (21)
New Jersey:
2.5% (36,443)
Japan
River Vale:
1.9% (21)
New Jersey:
0.8% (11,245)
Romania
River Vale:
1.7% (19)
New Jersey:
0.4% (6,115)
Other Eastern Europe
River Vale:
1.6% (17)
New Jersey:
1.2% (17,647)
Place of birth for U.S.-born residents:
This state: 4,880
Other state: 3,446
Northeast: 2,985
Midwest: 250
South: 128
West: 83
75% of River Vale residents lived in the same house 5 years ago. Out of people who lived in different houses, 67% lived in this county. Out of people who lived in different counties, 31% lived in New Jersey.
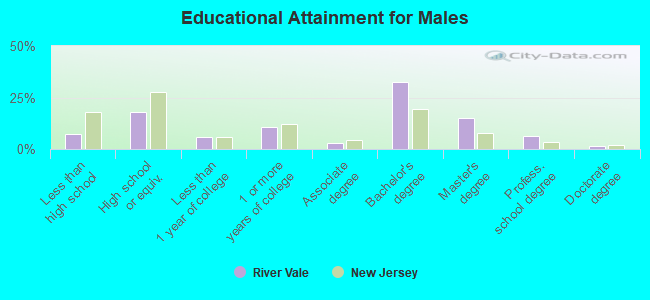
Education attainment for males 25 years and older:
No schooling: 7
Nursery to 4th grade: 7
5th and 6th grade: 0
7th and 8th grade: 32
9th grade: 26
10th grade: 55
11th grade: 15
12th grade, no diploma: 74
High school graduate (or equivalency): 552
Less than 1 year of college: 175
Some college more than 1 year, no degree: 328
Associate degree: 89
Bachelor's degree: 996
Master's degree: 462
Professional school degree: 195
Doctorate degree: 47
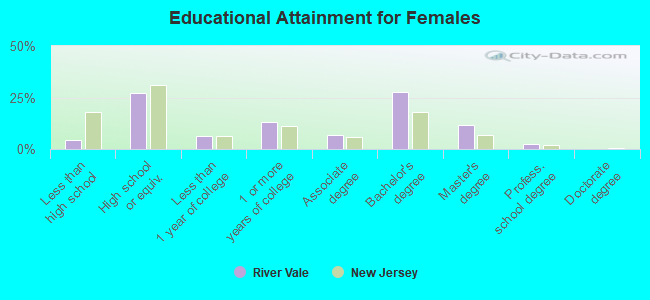
Education attainment for females 25 years and older: