Red Bank, TN (Tennessee) Houses and Residents
| Red Bank: | $266,594 |
| Tennessee: | $284,800 |
Mean price in 2022:
Detached houses: $245,068
Here: $245,068 State: $374,382 Townhouses or other attached units: $392,024
Here: $392,024 State: $354,101 In 2-unit structures: $170,150
Here: $170,150 State: $247,693 Mobile homes: $267,583
Here: $267,583 State: $101,421
Total population: 11,784 (All urban)
Houses: 6,587 (5,914 occupied: 3,345 owner occupied, 2,557 renter occupied)
| % of renters here: | 43% |
| State: | 33% |
Housing density: 1,023 houses/condos per square mile
Median price asked for vacant for-sale houses and condos in 2022: $386,594.
Median contract rent in 2022: $987 (lower quartile is $704, upper quartile is $1,216)
Median rent asked for vacant for-rent units in 2022: $1,043
Median gross rent in Red Bank, TN in 2022: $1,107
Housing units in Red Bank with a mortgage: 1,942 (117 second mortgage, 0 home equity loan, 112 both second mortgage and home equity loan)
Houses without a mortgage: 50
Median household income for houses/condos with a mortgage: $87,320
Median household income for apartments without a mortgage: $52,749
Median monthly housing costs: $992
Compare current foreclosures near Red Bank, TN:
| Photo | Address | Area | Beds / Baths | Price | Details |
|---|---|---|---|---|---|

|
#1
Short Tail Springs Rd
Harrison, TN 37341
|
3,383 sq. feet
|
3 baths 4 beds |
$855,000
|
show details |

|
#2
Everett Dr
Chattanooga, TN 37421
|
2,660 sq. feet
|
2 baths 5 beds |
show details | |

|
#3
Wiley Ave
Chattanooga, TN 37412
|
2,345 sq. feet
|
2 baths 4 beds |
show details | |

|
#4
Dolores Dr
Hixson, TN 37343
|
1,671 sq. feet
|
2 baths 3 beds |
show details | |

|
#5
Laura Ln
Ringgold, GA 30736
|
1,308 sq. feet
|
2 baths 3 beds |
show details | |

|
#6
Page Rd
Rossville, GA 30741
|
1,626 sq. feet
|
2 baths 3 beds |
show details | |

|
#7
Fallen Leaf Dr
Soddy Daisy, TN 37379
|
1,508 sq. feet
|
2 baths 3 beds |
show details | |

|
#8
Cuscowilla Trl
Chattanooga, TN 37415
|
1,608 sq. feet
|
2 baths 3 beds |
show details | |

|
#9
Courtland Dr
Hixson, TN 37343
|
2,376 sq. feet
|
2 baths - beds |
show details | |

|
#10
W Garden Farm Rd
Rossville, GA 30741
|
1,288 sq. feet
|
1 baths - beds |
show details |
| Photo | Address | Area | Beds / Baths | Price | Details |
|---|---|---|---|---|---|

|
#11
Ashmore Ave
Chattanooga, TN 37415
|
2,096 sq. feet
|
1 baths - beds |
show details | |

|
#12
Creek Rd
Wildwood, GA 30757
|
1,560 sq. feet
|
2 baths 3 beds |
show details | |

|
#13
Love Ln
Hixson, TN 37343
|
912 sq. feet
|
1 baths - beds |
show details | |

|
#14
Hickory Valley Rd
Chattanooga, TN 37421
|
1,189 sq. feet
|
1 baths - beds |
show details | |

|
#15
Longview St
Hixson, TN 37343
|
1,710 sq. feet
|
2 baths - beds |
show details | |

|
#16
Flagstone Dr
Ooltewah, TN 37363
|
5,707 sq. feet
|
6 baths - beds |
show details | |

|
#17
Glass Slipper Trl
Flintstone, GA 30725
|
1,094 sq. feet
|
2 baths - beds |
show details | |

|
#18
Teague Cemetery Rd
Whitwell, TN 37397
|
1,420 sq. feet
|
2 baths - beds |
show details | |

|
#19
Alan Dr
Ringgold, GA 30736
|
1,032 sq. feet
|
1 baths - beds |
show details | |

|
#20
Chattanooga Valley Rd
Flintstone, GA 30725
|
1,088 sq. feet
|
2 baths - beds |
show details |
| Photo | Address | Area | Beds / Baths | Price | Details |
|---|---|---|---|---|---|

|
#21
Creeks Jewell Dr
Ringgold, GA 30736
|
1,661 sq. feet
|
2 baths - beds |
show details | |

|
#22
Pine Grove Access Rd
Ringgold, GA 30736
|
720 sq. feet
|
1 baths - beds |
show details | |

|
#23
Belree Rd
Wildwood, GA 30757
|
2,036 sq. feet
|
2 baths - beds |
show details | |

|
#24
Pegram Cir
Fort Oglethorpe, GA 30742
|
1,392 sq. feet
|
1 baths - beds |
show details | |

|
#25
Century Station Dr
Rossville, GA 30741
|
1,456 sq. feet
|
2 baths - beds |
show details | |

|
#26
Sunset Dr
Whitwell, TN 37397
|
1,170 sq. feet
|
1 baths - beds |
show details | |

|
#27
Holli Ln
Rossville, GA 30741
|
1,612 sq. feet
|
2 baths - beds |
show details | |

|
#28
Alvin York Hwy
Whitwell, TN 37397
|
1,032 sq. feet
|
1 baths - beds |
show details | |

|
#29
Cubine Rd
Flintstone, GA 30725
|
1,276 sq. feet
|
2 baths - beds |
show details | |

|
#30
Forrest Rd
Fort Oglethorpe, GA 30742
|
1,152 sq. feet
|
1 baths - beds |
show details |
| Photo | Address | Area | Beds / Baths | Price | Details |
|---|---|---|---|---|---|

|
#31
Robert E Lee St
Fort Oglethorpe, GA 30742
|
925 sq. feet
|
1 baths - beds |
show details | |

|
#32
Shelby St
Fort Oglethorpe, GA 30742
|
1,168 sq. feet
|
1 baths - beds |
show details | |

|
#33
Delores Dr
Fort Oglethorpe, GA 30742
|
1,224 sq. feet
|
1 baths - beds |
show details | |

|
#34
Windmill Ln
Ringgold, GA 30736
|
1,732 sq. feet
|
1 baths - beds |
show details | |

|
#35
Woodmont Dr
Whitwell, TN 37397
|
1,144 sq. feet
|
1 baths - beds |
show details | |

|
#36
Foster Dr
Ringgold, GA 30736
|
1,431 sq. feet
|
2 baths - beds |
show details | |

|
#37
Dee Vue Ln
Rossville, GA 30741
|
1,150 sq. feet
|
1 baths - beds |
show details | |

|
#38
Williams Ln
Rossville, GA 30741
|
1,140 sq. feet
|
1 baths - beds |
show details | |

|
#39
Pegram Cir
Fort Oglethorpe, GA 30742
|
1,600 sq. feet
|
1 baths - beds |
show details | |

|
#40
Beaver Rd
Fort Oglethorpe, GA 30742
|
1,152 sq. feet
|
2 baths - beds |
show details |
| Photo | Address | Area | Beds / Baths | Price | Details |
|---|---|---|---|---|---|

|
#41
Benton Dr
Ringgold, GA 30736
|
1,647 sq. feet
|
1 baths - beds |
show details | |

|
#42
S Stovall St
Fort Oglethorpe, GA 30742
|
1,068 sq. feet
|
1 baths - beds |
show details | |

|
#43
Alvin York Hwy
Whitwell, TN 37397
|
960 sq. feet
|
1 baths - beds |
show details | |

|
#44
Inman St
Ringgold, GA 30736
|
1,600 sq. feet
|
2 baths - beds |
show details | |

|
#45
Virginia Ave
Rossville, GA 30741
|
1,254 sq. feet
|
1 baths - beds |
show details | |

|
#46
Daffron Rd
Ringgold, GA 30736
|
1,948 sq. feet
|
1 baths - beds |
show details | |

|
#47
Lewis St
Rossville, GA 30741
|
984 sq. feet
|
1 baths - beds |
show details | |

|
#48
Vera Dr
Ringgold, GA 30736
|
984 sq. feet
|
1 baths - beds |
show details | |

|
#49
E Circle Dr
Rossville, GA 30741
|
1,132 sq. feet
|
1 baths - beds |
show details | |

|
Check over 1 million property listings on Foreclosure.com!
|
browse all offers | |||


Median year apartment built: 1974
Household type by relationship:
Households: 12,162- Male householders: 2,837 (1,060 living alone), Female householders: 3,029 (1,234 living alone)
2,038 spouses (1,977 opposite-sex spouses), 393 unmarried partners, (363 opposite-sex unmarried partners), 2,018 children (1,769 natural, 41 adopted, 207 stepchildren), 326 grandchildren, 217 brothers or sisters, 119 parents, 0 foster children, 151 other relatives, 1,005 non-relatives
- In group quarters: 24
Size of family households: 1,688 2-persons, 782 3-persons, 229 4-persons, 77 5-persons, 51 6-persons, 18 7-or-more-persons.
Size of nonfamily households: 2,198 1-person, 705 2-persons, 213 3-persons, 35 4-persons.
872 married couples with children.
572 single-parent households (80 men, 492 women).
94.5% of residents of Red Bank speak English at home.
2.5% of residents speak Spanish at home (57% speak English very well, 8% speak English well, 36% speak English not well).
0.9% of residents speak other Indo-European language at home (91% speak English very well, 9% speak English well).
1.5% of residents speak Asian or Pacific Island language at home (93% speak English very well, 7% speak English well).
0.4% of residents speak other language at home (100% speak English well).
Foreign born population: 301 (2.5%)
(31.9% of them are naturalized citizens)
| Here: | 6.5 |
| State: | 6.5 |
| Here: | 3.9 |
| State: | 4.4 |

- Bedrooms in owner-occupied houses and condos in Red Bank, Tennessee
- 7no bedroom
- 551 bedroom
- 8462 bedrooms
- 1,5903 bedrooms
- 7214 bedrooms
- 1265+ bedrooms

- Bedrooms in renter-occupied apartments in Red Bank, Tennessee
- 11no bedroom
- 8261 bedroom
- 1,3762 bedrooms
- 2613 bedrooms
- 554 bedrooms
- 285+ bedrooms

- Cars and other vehicles available in Red Bank in owner-occupied houses/condos
- 99no vehicle
- 9951 vehicle
- 1,4312 vehicles
- 5683 vehicles
- 1884 vehicles
- 665+ vehicles

- Cars and other vehicles available in Red Bank in renter-occupied apartments
- 110no vehicle
- 1,4971 vehicle
- 7152 vehicles
- 2033 vehicles
- 04 vehicles
- 335+ vehicles

- Rooms in owner-occupied houses in Red Bank, Tennessee
- 71 room
- 72 rooms
- 473 rooms
- 2214 rooms
- 7475 rooms
- 7636 rooms
- 4997 rooms
- 4538 rooms
- 6029+ rooms

- Rooms in renter-occupied apartments in Red Bank, Tennessee
- 111 room
- 1952 rooms
- 6493 rooms
- 8264 rooms
- 4845 rooms
- 2176 rooms
- 1217 rooms
- 88 rooms
- 469+ rooms


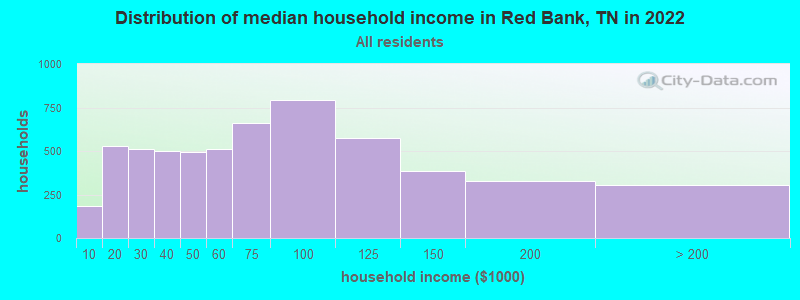
Red Bank, TN household income distribution

- 185Less than $10,000
- 528$10,000 to $19,999
- 514$20,000 to $29,999
- 499$30,000 to $39,999
- 496$40,000 to $49,999
- 511$50,000 to $59,999
- 660$60,000 to $74,999
- 793$75,000 to $99,999
- 576$100,000 to $124,999
- 386$125,000 to $149,999
- 329$150,000 to $199,999
- 303$200,000 or more
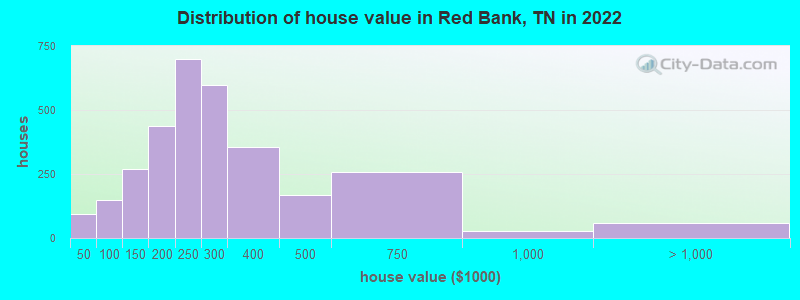
Home value of owner - occupied houses in 2022 in Red Bank, TN
-
- 10Less than $10,000
- 16$10,000 to $14,999
- 34$20,000 to $24,999
- 9$25,000 to $29,999
- 24$35,000 to $39,999
- 44$70,000 to $79,999
- 92$80,000 to $89,999
- 12$90,000 to $99,999
- 178$100,000 to $124,999
- 92$125,000 to $149,999
- 248$150,000 to $174,999
- 190$175,000 to $199,999
- 698$200,000 to $249,999
- 596$250,000 to $299,999
- 353$300,000 to $399,999
- 168$400,000 to $499,999
- 257$500,000 to $749,999
- 27$750,000 to $999,999
- 40$1,000,000 to $1,499,999
- 17$2,000,000 or more
Rent paid by renters in 2022 in Red Bank, TN
-
- 17$100 to $149
- 61$150 to $199
- 33$350 to $399
- 7$400 to $449
- 51$450 to $499
- 69$500 to $549
- 86$550 to $599
- 138$600 to $649
- 117$650 to $699
- 59$700 to $749
- 52$750 to $799
- 269$800 to $899
- 308$900 to $999
- 562$1,000 to $1,249
- 82$1,250 to $1,499
- 269$1,500 to $1,999
- 8$2,000 to $2,499
- 33$2,500 to $2,999
- 126No cash rent


Percentage of workers working in this county: 95.0%
Number of people working at home: 1,095 (14.8% of all workers)
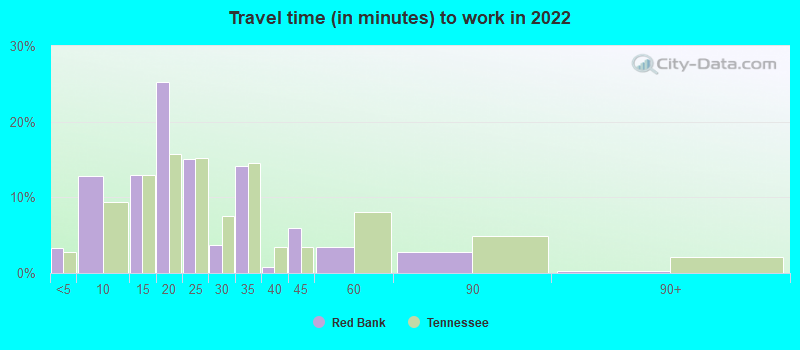
Travel time to work (commute)
- Less than 5 minutes: 83
- 5 to 9 minutes: 577
- 10 to 14 minutes: 1,309
- 15 to 19 minutes: 1,398
- 20 to 24 minutes: 1,322
- 25 to 29 minutes: 438
- 30 to 34 minutes: 788
- 35 to 39 minutes: 34
- 40 to 44 minutes: 60
- 45 to 59 minutes: 85
- 60 to 89 minutes: 59
- 90 or more minutes: 120
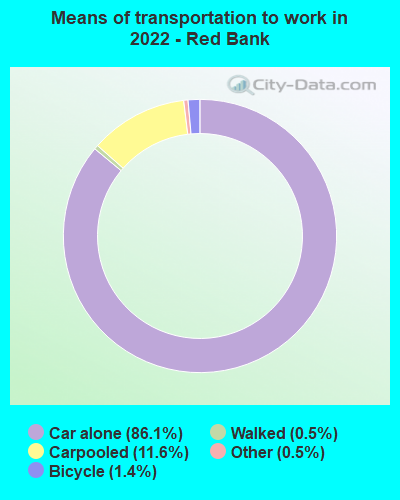
Means of transportation to work:
- Drove a car alone: 2,093 (63.1%)
- Carpooled: 296 (8.9%)
- Taxi: 13 (0.4%)
- Bicycle: 51 (1.5%)
- Walked: 9 (0.3%)
- Worked at home: 1,095 (33.0%)

- Unemployment by race in 2022
- Unemployment rate for White non-Hispanic residents
- 2.0%Males
- 1.5%Females
- Unemployment rate for Black residents
- 7.1%Males
- 5.3%Females
- Unemployment rate for two or more race residents
- 4.0%Females
- Unemployment rate for Hispanic or Latino residents
- 9.7%Males
- 6.5%Females

- Year of entry for the foreign-born population in Red Bank, Tennessee
- 1572010 or later
- 1232000 to 2009
- 371990 to 1999
- 471980 to 1989
- 821970 to 1979
- 77Before 1970

First ancestries reported:
- English: 1,115 (20.0%)
- American: 711 (12.8%)
- Irish: 641 (11.5%)
- German: 385 (6.9%)
- Scottish: 323 (5.8%)
- European: 257 (4.6%)
- Scotch-Irish: 117 (2.1%)
- French: 74 (1.3%)
- Welsh: 68 (1.2%)
- Northern European: 66 (1.2%)
- Italian: 50 (0.9%)
- Polish: 46 (0.8%)
- Norwegian: 29 (0.5%)
- Portuguese: 28 (0.5%)
- Iranian: 27 (0.5%)
- British: 24 (0.4%)
- Sudanese: 24 (0.4%)
- Dutch: 23 (0.4%)
- Canadian: 20 (0.4%)
- African: 19 (0.3%)
- Pennsylvania German: 18 (0.3%)
- Slovene: 13 (0.2%)
- Romanian: 10 (0.2%)
- Hungarian: 9 (0.2%)
- Croatian: 6 (0.1%)
- Austrian: 5 (0.09%)
Most common places of birth for foreign-born residents (%):
| Red Bank: | 22.2% (72) |
| Tennessee: | 23.0% (86,435) |
| Red Bank: | 12.9% (42) |
| Tennessee: | 0.5% (1,793) |
| Red Bank: | 12.9% (42) |
| Tennessee: | 4.6% (17,433) |
| Red Bank: | 9.8% (32) |
| Tennessee: | 3.1% (11,640) |
| Red Bank: | 8.9% (29) |
| Tennessee: | 2.2% (8,261) |
| Red Bank: | 7.7% (25) |
| Tennessee: | 2.7% (10,295) |
| Red Bank: | 5.8% (19) |
| Tennessee: | 0.8% (2,872) |
| Red Bank: | 4.3% (14) |
| Tennessee: | 0.4% (1,593) |
| Red Bank: | 2.8% (9) |
| Tennessee: | 0.4% (1,632) |
| Red Bank: | 2.8% (9) |
| Tennessee: | 0.3% (1,136) |
| Red Bank: | 2.5% (8) |
| Tennessee: | 1.2% (4,587) |
| Red Bank: | 1.5% (5) |
| Tennessee: | 2.7% (10,313) |
| Red Bank: | 1.5% (5) |
| Tennessee: | 0.0% (114) |
Place of birth for U.S.-born residents:
- This state: 6,490
- Other state: 5,162
- Northeast: 699
- Midwest: 975
- South: 2,838
- West: 654
81.3% of Red Bank residents lived in the same house 1 years ago.
Out of people who lived in different houses, 36.8% lived in this county.
Out of people who lived in different counties, 11.4% lived in Tennessee.
| Red Bank: | 81.3% |
| State average: | 87.0% |
Education attainment for males 25 years and older:
- No schooling: 27
- Nursery to 4th grade: 11
- 5th and 6th grade: 0
- 7th and 8th grade: 73
- 9th grade: 18
- 10th grade: 21
- 11th grade: 40
- 12th grade, no diploma: 12
- High school graduate (or equivalency): 966
- Less than 1 year of college: 270
- Some college more than 1 year, no degree: 1,131
- Associate degree: 273
- Bachelor's degree: 1,286
- Master's degree: 434
- Professional school degree: 67
- Doctorate degree: 43

Education attainment for females 25 years and older:
- No schooling: 48
- Nursery to 4th grade: 0
- 5th and 6th grade: 148
- 7th and 8th grade: 36
- 9th grade: 20
- 10th grade: 30
- 11th grade: 42
- 12th grade, no diploma: 20
- High school graduate (or equivalency): 893
- Less than 1 year of college: 311
- Some college more than 1 year, no degree: 547
- Associate degree: 551
- Bachelor's degree: 1,272
- Master's degree: 750
- Professional school degree: 42
- Doctorate degree: 94


Housing units in structures:
- One, detached: 4,224
- One, attached: 154
- Two: 423
- 3 or 4: 361
- 5 to 9: 391
- 10 to 19: 611
- 20 to 49: 205
- 50 or more: 184
- Mobile homes: 30
Median worth of mobile homes: $78,788
Housing units lacking complete kitchen facilities in 2022: 1.5%
House/condo owner moved in on average 11 years ago
Renter moved in on average 0 years ago

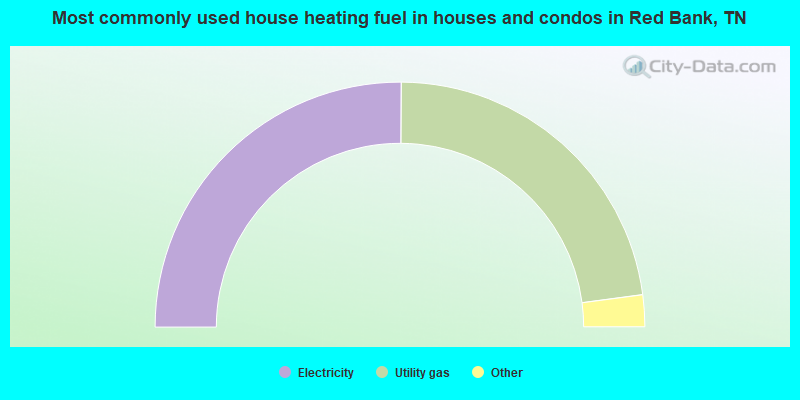
- 50.2%Electricity
- 45.6%Utility gas
- 3.8%Bottled, tank, or LP gas
- 0.4%Fuel oil, kerosene, etc.
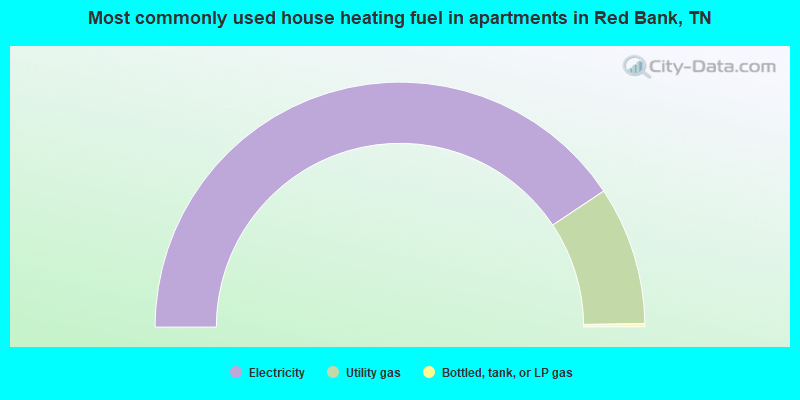
- 81.2%Electricity
- 18.3%Utility gas
- 0.4%Bottled, tank, or LP gas
Private vs. public school enrollment:
| Here: | 36.4% |
| Tennessee: | 15.0% |
| Here: | 12.9% |
| Tennessee: | 16.2% |
| Here: | 11.2% |
| Tennessee: | 23.5% |


