Progress, PA (Pennsylvania) Houses and Residents
| Progress: | $181,480 |
| Pennsylvania: | $245,500 |
Total population: 9,765 (All urban)
Houses: 4,897 (4,724 occupied: 2,948 owner occupied, 1,910 renter occupied)
| % of renters here: | 39% |
| State: | 31% |
Housing density: 1,776 houses/condos per square mile
Median price asked for vacant for-sale houses and condos in 2022: $273,838.
Median contract rent in 2022: $961 (lower quartile is $813, upper quartile is $1,149)
Median rent asked for vacant for-rent units in 2022: $1,043
Median gross rent in Progress, PA in 2022: $1,102
Housing units in Progress with a mortgage: 1,949 (120 second mortgage, 0 home equity loan, 115 both second mortgage and home equity loan)
Houses without a mortgage: 61
Median household income for houses/condos with a mortgage: $90,002
Median household income for apartments without a mortgage: $71,619
Median monthly housing costs: $1,147
Compare current foreclosures near Progress, PA:
| Photo | Address | Area | Beds / Baths | Price | Details |
|---|---|---|---|---|---|

|
#1
Conewago Ave
Manchester, PA 17345
|
768 sq. feet
|
1 baths 2 beds |
show details | |

|
#2
Crescent Dr
New Cumberland, PA 17070
|
2,052 sq. feet
|
2 baths 4 beds |
show details | |

|
#3
Parklea Dr
Hummelstown, PA 17036
|
984 sq. feet
|
1 baths 3 beds |
show details | |

|
#4
Lawn Rd
Palmyra, PA 17078
|
1,830 sq. feet
|
2 baths 2 beds |
show details | |

|
#5
S 18th St
Camp Hill, PA 17011
|
1,064 sq. feet
|
1 baths 3 beds |
show details | |

|
#6
Magaro Rd
Enola, PA 17025
|
1,800 sq. feet
|
2 baths 3 beds |
show details | |

|
#7
Fishing Creek Valley Rd
Harrisburg, PA 17112
|
1,344 sq. feet
|
1 baths 3 beds |
show details | |

|
#8
Nixon Dr
Mechanicsburg, PA 17055
|
2,020 sq. feet
|
1 baths 3 beds |
show details | |

|
#9
S 16th St
Harrisburg, PA 17104
|
800 sq. feet
|
1 baths 2 beds |
show details | |

|
#10
Randolph St
Harrisburg, PA 17104
|
1,220 sq. feet
|
1 baths 3 beds |
show details |
| Photo | Address | Area | Beds / Baths | Price | Details |
|---|---|---|---|---|---|

|
#11
Berkley Dr
Middletown, PA 17057
|
1,196 sq. feet
|
1 baths 4 beds |
show details | |

|
#12
Market St
Highspire, PA 17034
|
2,148 sq. feet
|
2 baths 3 beds |
show details | |

|
#13
Eddington Ave
Harrisburg, PA 17111
|
1,784 sq. feet
|
2 baths 4 beds |
show details | |

|
#14
Chestnut St
Harrisburg, PA 17104
|
1,890 sq. feet
|
1 baths 5 beds |
show details | |

|
#15
S Enola Dr
Enola, PA 17025
|
2,088 sq. feet
|
2 baths 6 beds |
show details | |

|
#16
Clover Ln
Halifax, PA 17032
|
1,103 sq. feet
|
1 baths 3 beds |
show details | |

|
#17
Crossing Way
Manchester, PA 17345
|
1,094 sq. feet
|
1 baths 3 beds |
show details | |

|
#18
1/2 Norwood St
Harrisburg, PA 17104
|
1,569 sq. feet
|
1 baths 4 beds |
show details | |

|
#19
Carlisle Pike
Mechanicsburg, PA 17050
|
2,176 sq. feet
|
1 baths 3 beds |
show details | |

|
#20
2nd Street Aka 493 Second Street
Highspire, PA 17034
|
1,864 sq. feet
|
1 baths 3 beds |
show details |
| Photo | Address | Area | Beds / Baths | Price | Details |
|---|---|---|---|---|---|

|
#21
Franklin Ave
Mechanicsburg, PA 17050
|
1,520 sq. feet
|
2 baths 3 beds |
show details | |

|
#22
N 16th St
Harrisburg, PA 17103
|
3,162 sq. feet
|
4 baths 5 beds |
show details | |

|
#23
Mulberry St
Harrisburg, PA 17104
|
1,683 sq. feet
|
1 baths 4 beds |
show details | |

|
#24
Leonard Ln
Harrisburg, PA 17111
|
1,248 sq. feet
|
2 baths 2 beds |
show details | |

|
#25
Park St
Harrisburg, PA 17103
|
1,820 sq. feet
|
1 baths 5 beds |
show details | |

|
#26
Shawnee Dr
Harrisburg, PA 17112
|
1,092 sq. feet
|
1 baths 3 beds |
show details | |

|
#27
College Ave
Elizabethtown, PA 17022
|
1,419 sq. feet
|
1 baths 3 beds |
show details | |

|
#28
Tulane Rd
Hummelstown, PA 17036
|
698 sq. feet
|
1 baths 3 beds |
show details | |

|
#29
Race St
Bainbridge, PA 17502
|
1,290 sq. feet
|
3 baths 3 beds |
show details | |

|
#30
Hunters Ridge Dr
Harrisburg, PA 17110
|
1,364 sq. feet
|
2 baths 3 beds |
show details |
| Photo | Address | Area | Beds / Baths | Price | Details |
|---|---|---|---|---|---|

|
#31
Heatherfield Way
Harrisburg, PA 17112
|
1,308 sq. feet
|
2 baths 3 beds |
show details | |

|
#32
Rhema Ct
Elizabethtown, PA 17022
|
1,428 sq. feet
|
2 baths 2 beds |
show details | |

|
#33
E High St
Elizabethtown, PA 17022
|
1,276 sq. feet
|
2 baths 3 beds |
show details | |

|
#34
Canyon Rd
Harrisburg, PA 17111
|
1,602 sq. feet
|
2 baths 4 beds |
show details | |

|
#35
Terrace Ct
Harrisburg, PA 17111
|
1,531 sq. feet
|
3 baths 3 beds |
show details | |

|
#36
S 2nd St
Lemoyne, PA 17043
|
1,120 sq. feet
|
1 baths 2 beds |
show details | |

|
#37
2nd St
Lemoyne, PA 17043
|
1,120 sq. feet
|
1 baths 2 beds |
show details | |

|
#38
E Washington St
Elizabethtown, PA 17022
|
1,578 sq. feet
|
1 baths 3 beds |
show details | |

|
#39
N Market St
Elizabethtown, PA 17022
|
1,656 sq. feet
|
1 baths 3 beds |
show details | |

|
#40
N Lime St
Elizabethtown, PA 17022
|
1,200 sq. feet
|
2 baths 3 beds |
show details |
| Photo | Address | Area | Beds / Baths | Price | Details |
|---|---|---|---|---|---|

|
#41
Main St
Harrisburg, PA 17113
|
1,205 sq. feet
|
1 baths 4 beds |
show details | |

|
#42
Prosperous Dr
Harrisburg, PA 17112
|
3,734 sq. feet
|
3 baths 4 beds |
show details | |

|
#43
Rosemont Ave
New Cumberland, PA 17070
|
1,410 sq. feet
|
2 baths 3 beds |
show details | |

|
#44
N 2nd St
Lemoyne, PA 17043
|
1,520 sq. feet
|
1 baths 3 beds |
show details | |

|
#45
W Oak St
Elizabethtown, PA 17022
|
1,080 sq. feet
|
2 baths 3 beds |
show details | |

|
#46
Front St
Enola, PA 17025
|
2,092 sq. feet
|
3 baths 4 beds |
show details | |

|
#47
Green St
Harrisburg, PA 17102
|
2,412 sq. feet
|
1 baths 5 beds |
show details | |

|
#48
2nd St
Enola, PA 17025
|
1,488 sq. feet
|
2 baths 3 beds |
show details | |

|
#49
Dogwood Dr
Elizabethtown, PA 17022
|
2,220 sq. feet
|
2 baths 4 beds |
show details | |

|
Check over 1 million property listings on Foreclosure.com!
|
browse all offers | |||

Latest news about housing in Progress, PA collected exclusively by city-data.com from local newspapers, TV, and radio stations

 | Buying a house in Harrisburg, never been there before (23 replies) |
| Apartment suggestions needed (3 replies) |
| Nice Apartments in Harrisburg? (18 replies) |
| U oldies remember the old Linglestown rd underpass (5 replies) |
| Hotels in Harrisburg 'downtown' (5 replies) |
| Commute times in and out of Harrisburg (2 replies) |

Median year apartment built: 1973
Household type by relationship:
Households: 11,470- Male householders: 2,411 (741 living alone), Female householders: 2,312 (719 living alone)
1,778 spouses (1,778 opposite-sex spouses), 542 unmarried partners, (542 opposite-sex unmarried partners), 3,645 children (3,576 natural, 14 adopted, 55 stepchildren), 356 grandchildren, 95 brothers or sisters, 105 parents, 0 foster children, 23 other relatives, 182 non-relatives
- In group quarters: 16
Size of family households: 1,219 2-persons, 798 3-persons, 351 4-persons, 415 5-persons, 21 6-persons, 31 7-or-more-persons.
Size of nonfamily households: 1,501 1-person, 567 2-persons, 24 3-persons.
1,484 married couples with children.
1,146 single-parent households (569 men, 577 women).
82.4% of residents of Progress speak English at home.
3.5% of residents speak Spanish at home (60% speak English very well, 25% speak English well, 15% speak English not well).
7.7% of residents speak other Indo-European language at home (55% speak English very well, 28% speak English well, 16% speak English not well, 1% don't speak English at all).
3.0% of residents speak Asian or Pacific Island language at home (32% speak English very well, 34% speak English well, 29% speak English not well, 5% don't speak English at all).
3.4% of residents speak other language at home (18% speak English very well, 71% speak English well, 12% speak English not well).
Foreign born population: 2,462 (21.5%)
(63.9% of them are naturalized citizens)
| Here: | 6.2 |
| State: | 6.8 |
| Here: | 4.4 |
| State: | 4.3 |

- Bedrooms in owner-occupied houses and condos in Progress, Pennsylvania
- 0no bedroom
- 351 bedroom
- 5402 bedrooms
- 1,8753 bedrooms
- 4484 bedrooms
- 505+ bedrooms

- Bedrooms in renter-occupied apartments in Progress, Pennsylvania
- 0no bedroom
- 5131 bedroom
- 1,0172 bedrooms
- 3493 bedrooms
- 314 bedrooms
- 05+ bedrooms

- Cars and other vehicles available in Progress in owner-occupied houses/condos
- 202no vehicle
- 6061 vehicle
- 1,5842 vehicles
- 4123 vehicles
- 1224 vehicles
- 215+ vehicles

- Cars and other vehicles available in Progress in renter-occupied apartments
- 246no vehicle
- 1,2271 vehicle
- 3282 vehicles
- 1093 vehicles
- 04 vehicles
- 05+ vehicles

- Rooms in owner-occupied houses in Progress, Pennsylvania
- 01 room
- 02 rooms
- 223 rooms
- 1524 rooms
- 6215 rooms
- 9466 rooms
- 4957 rooms
- 3968 rooms
- 3189+ rooms

- Rooms in renter-occupied apartments in Progress, Pennsylvania
- 01 room
- 372 rooms
- 2283 rooms
- 7094 rooms
- 4895 rooms
- 2926 rooms
- 937 rooms
- 228 rooms
- 399+ rooms


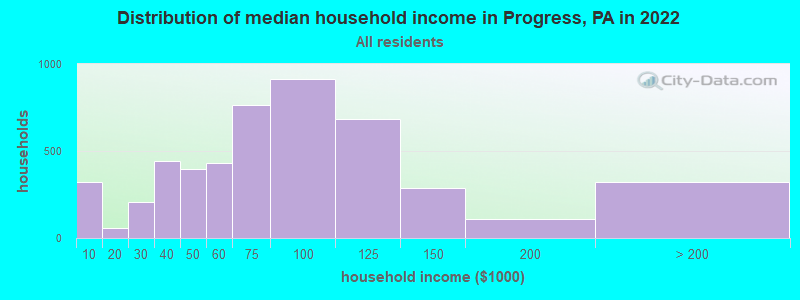
Progress, PA household income distribution

- 324Less than $10,000
- 59$10,000 to $19,999
- 209$20,000 to $29,999
- 440$30,000 to $39,999
- 399$40,000 to $49,999
- 429$50,000 to $59,999
- 766$60,000 to $74,999
- 913$75,000 to $99,999
- 685$100,000 to $124,999
- 290$125,000 to $149,999
- 110$150,000 to $199,999
- 323$200,000 or more
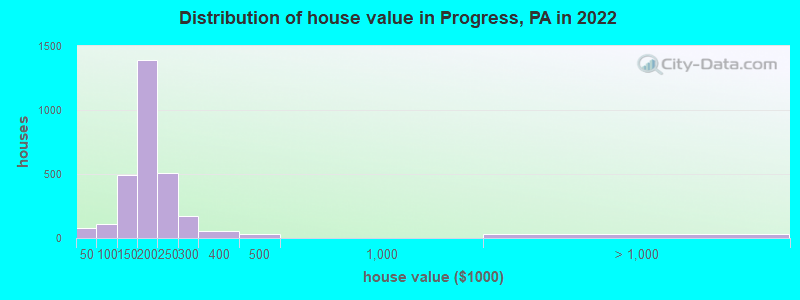
Home value of owner - occupied houses in 2022 in Progress, PA
-
- 10$20,000 to $24,999
- 24$25,000 to $29,999
- 40$35,000 to $39,999
- 6$70,000 to $79,999
- 56$80,000 to $89,999
- 50$90,000 to $99,999
- 242$100,000 to $124,999
- 252$125,000 to $149,999
- 833$150,000 to $174,999
- 554$175,000 to $199,999
- 505$200,000 to $249,999
- 172$250,000 to $299,999
- 54$300,000 to $399,999
- 28$400,000 to $499,999
- 32$2,000,000 or more
Rent paid by renters in 2022 in Progress, PA
-
- 23Less than $100
- 5$300 to $349
- 125$550 to $599
- 87$700 to $749
- 157$750 to $799
- 294$800 to $899
- 295$900 to $999
- 611$1,000 to $1,249
- 176$1,250 to $1,499
- 34$1,500 to $1,999
- 105No cash rent


Percentage of workers working in this county: 64.0%
Number of people working at home: 1,027 (16.1% of all workers)
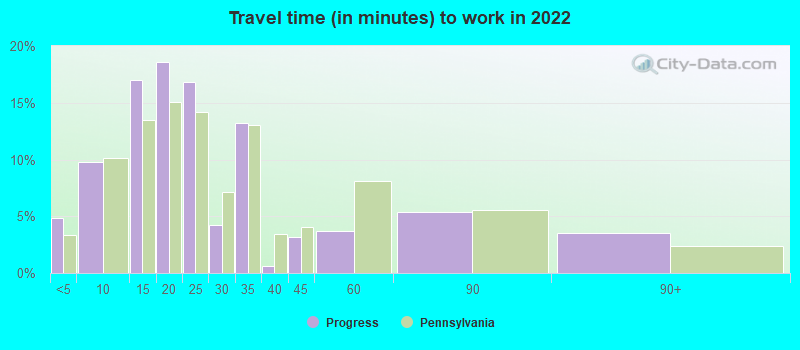
Travel time to work (commute)
- Less than 5 minutes: 140
- 5 to 9 minutes: 379
- 10 to 14 minutes: 924
- 15 to 19 minutes: 1,313
- 20 to 24 minutes: 594
- 25 to 29 minutes: 740
- 30 to 34 minutes: 732
- 35 to 39 minutes: 25
- 40 to 44 minutes: 201
- 45 to 59 minutes: 135
- 60 to 89 minutes: 142
- 90 or more minutes: 36
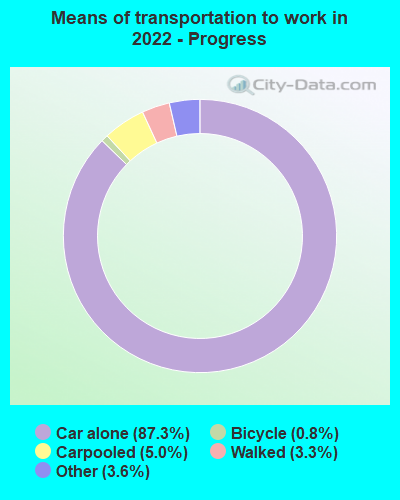
Means of transportation to work:
- Drove a car alone: 2,329 (66.8%)
- Carpooled: 115 (3.3%)
- Taxi: 131 (3.8%)
- Bicycle: 14 (0.4%)
- Walked: 93 (2.7%)
- Worked at home: 1,027 (29.5%)

- Unemployment by race in 2022
- Unemployment rate for White non-Hispanic residents
- 1.2%Males
- 0.8%Females
- Unemployment rate for Black residents
- 1.2%Males
- 10.7%Females
- Unemployment rate for other race residents
- 9.2%Males
- Unemployment rate for Hispanic or Latino residents
- 5.0%Males

- Year of entry for the foreign-born population in Progress, Pennsylvania
- 7942010 or later
- 8892000 to 2009
- 3151990 to 1999
- 541980 to 1989
- 121970 to 1979
- 63Before 1970

First ancestries reported:
- American: 655 (10.0%)
- German: 469 (7.2%)
- Albanian: 249 (3.8%)
- Italian: 179 (2.7%)
- English: 120 (1.8%)
- Kenyan: 56 (0.9%)
- Pennsylvania German: 54 (0.8%)
- European: 52 (0.8%)
- Irish: 52 (0.8%)
- Eastern European: 40 (0.6%)
- Scottish: 39 (0.6%)
- African: 37 (0.6%)
- Scotch-Irish: 30 (0.5%)
- Greek: 23 (0.4%)
- Russian: 16 (0.2%)
- Polish: 14 (0.2%)
- Trinidadian and Tobagonian: 12 (0.2%)
Most common places of birth for foreign-born residents (%):
| Progress: | 25.4% (536) |
| Pennsylvania: | 0.1% (1,376) |
| Progress: | 21.7% (459) |
| Pennsylvania: | 0.7% (6,855) |
| Progress: | 17.8% (376) |
| Pennsylvania: | 0.8% (7,882) |
| Progress: | 7.3% (155) |
| Pennsylvania: | 3.3% (31,542) |
| Progress: | 6.3% (134) |
| Pennsylvania: | 7.2% (67,704) |
| Progress: | 5.4% (114) |
| Pennsylvania: | 0.5% (5,121) |
| Progress: | 4.5% (96) |
| Pennsylvania: | 0.6% (5,742) |
| Progress: | 3.6% (75) |
| Pennsylvania: | 1.1% (10,331) |
| Progress: | 2.8% (59) |
| Pennsylvania: | 0.5% (4,946) |
| Progress: | 2.3% (49) |
| Pennsylvania: | 0.2% (1,902) |
| Progress: | 2.2% (47) |
| Pennsylvania: | 0.4% (3,736) |
| Progress: | 2.0% (43) |
| Pennsylvania: | 1.4% (12,910) |
| Progress: | 1.6% (34) |
| Pennsylvania: | 1.2% (11,211) |
| Progress: | 1.6% (33) |
| Pennsylvania: | 1.6% (15,224) |
Place of birth for U.S.-born residents:
- This state: 6,597
- Other state: 2,405
- Northeast: 789
- Midwest: 278
- South: 1,131
- West: 229
82.7% of Progress residents lived in the same house 1 years ago.
Out of people who lived in different houses, 40.7% lived in this county.
Out of people who lived in different counties, 47.5% lived in Pennsylvania.
| Progress: | 82.7% |
| State average: | 89.3% |
Education attainment for males 25 years and older:
- No schooling: 40
- Nursery to 4th grade: 0
- 5th and 6th grade: 0
- 7th and 8th grade: 31
- 9th grade: 23
- 10th grade: 7
- 11th grade: 61
- 12th grade, no diploma: 30
- High school graduate (or equivalency): 1,343
- Less than 1 year of college: 178
- Some college more than 1 year, no degree: 358
- Associate degree: 69
- Bachelor's degree: 931
- Master's degree: 401
- Professional school degree: 0
- Doctorate degree: 46

Education attainment for females 25 years and older:
- No schooling: 108
- Nursery to 4th grade: 0
- 5th and 6th grade: 9
- 7th and 8th grade: 0
- 9th grade: 28
- 10th grade: 22
- 11th grade: 8
- 12th grade, no diploma: 78
- High school graduate (or equivalency): 1,292
- Less than 1 year of college: 176
- Some college more than 1 year, no degree: 391
- Associate degree: 267
- Bachelor's degree: 781
- Master's degree: 414
- Professional school degree: 117
- Doctorate degree: 0


Housing units in structures:
- One, detached: 3,241
- One, attached: 134
- Two: 125
- 3 or 4: 378
- 5 to 9: 307
- 10 to 19: 487
- 20 to 49: 39
- 50 or more: 183
Housing units lacking complete kitchen facilities in 2022: 2.3%
House/condo owner moved in on average 14 years ago
Renter moved in on average 2 years ago

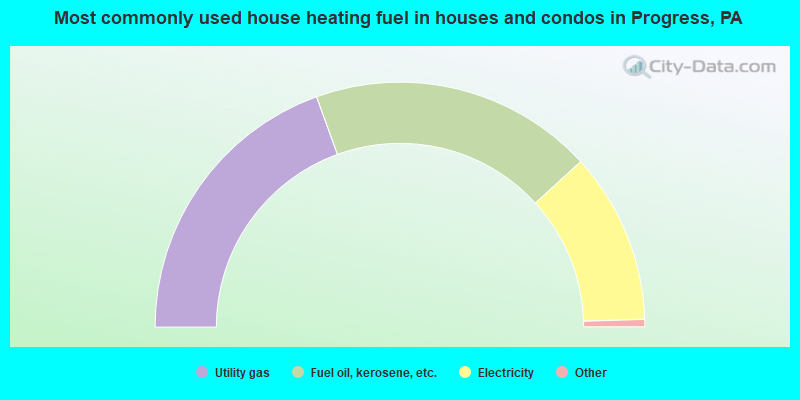
- 39.0%Utility gas
- 37.5%Fuel oil, kerosene, etc.
- 22.6%Electricity
- 0.4%Wood
- 0.3%Coal or coke
- 0.2%Bottled, tank, or LP gas
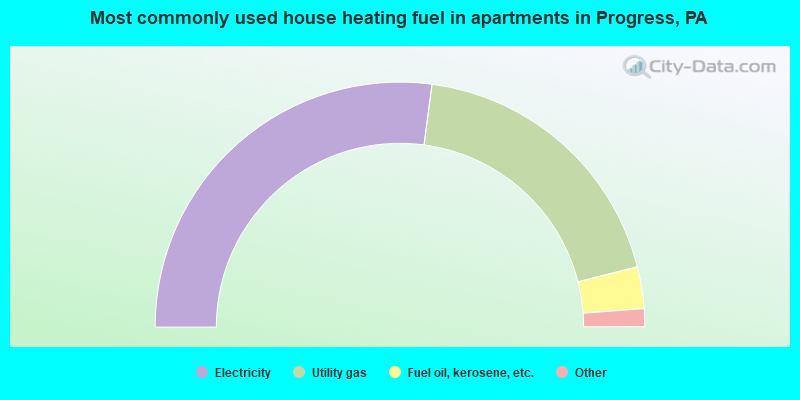
- 54.2%Electricity
- 37.9%Utility gas
- 5.5%Fuel oil, kerosene, etc.
- 1.6%Other fuel
- 0.8%Bottled, tank, or LP gas
Private vs. public school enrollment:
| Here: | 14.8% |
| Pennsylvania: | 15.7% |
| Here: | 53.0% |
| Pennsylvania: | 13.4% |
| Here: | 25.7% |
| Pennsylvania: | 39.8% |


