Portland, OR (Oregon) Houses and Residents
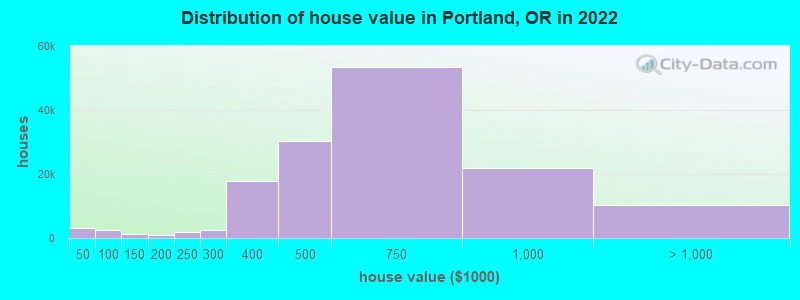
Estimated median house or condo value in 2022: $562,500 (it was $154,700 in 2000 )
Portland:
$562,500Oregon:
$475,600
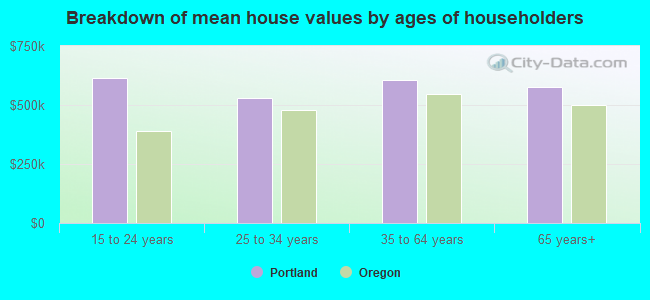
Lower value quartile - upper value quartile: $424,500 - $731,700Mean price in 2022: Detached houses: $616,638 Here:
$616,638State:
$562,872
Townhouses or other attached units: $511,079 Here:
$511,079State:
$463,029
In 2-unit structures: $673,050 Here:
$673,050State:
$505,105
In 3-to-4-unit structures: $593,865 Here:
$593,865State:
$419,673
In 5-or-more-unit structures: $500,919 Here:
$500,919State:
$420,389
Mobile homes: $100,085 Here:
$100,085State:
$214,044
Occupied boats, RVs, vans, etc.: $647,209 Here:
$647,209State:
$122,960
Total population: 619,360 (Urban population: 527,256, Rural population: 1,769 (16 farm, 1,753 nonfarm ))
Houses: 305,077 (284,533 occupied: 144,708 owner occupied, 139,825 renter occupied )
% of renters here:
49%State:
37%
Housing density: 2,271 houses/condos per square mile
Median price asked for vacant for-sale houses and condos in 2022: $756,216.
Median contract rent in 2022: $1,369 (lower quartile is $1,058, upper quartile is $1,800)
Median rent asked for vacant for-rent units in 2022: $1,829
Median gross rent in Portland, OR in 2022: $1,480
Housing units in Portland with a mortgage: 105,573 (11,439 second mortgage, 205 home equity loan, 9,711 both second mortgage and home equity loan )Houses without a mortgage: 2,164
Median household income for houses/condos with a mortgage: $130,771
Median household income for apartments without a mortgage: $84,105
Median monthly housing costs: $1,659
Data:
Median house or condo value ($)
Median house or condo value ($ change since 2000)
Median house or condo value ($) - White
Median house or condo value ($) - Black or African American
Median house or condo value ($) - Asian
Median house or condo value ($) - Hispanic or Latino
Median house or condo value ($) - American Indian and Alaska Native
Median house or condo value ($) - Multirace
Median house or condo value ($) - Other Race
Median price asked for mobile homes ($)
Household density (households per square mile)
Mean house or condo value by units in structure - 1, detached ($)
Mean house or condo value by units in structure - 1, attached ($)
Mean house or condo value by units in structure - 2 ($)
Mean house or condo value by units in structure by units in structure - 3 or 4 ($)
Mean house or condo value by units in structure - 5 or more ($)
Mean house or condo value by units in structure - Boat, RV, van, etc. ($)
Mean house or condo value by units in structure - Mobile home ($)
Median contract rent ($)
Median contract rent - Lower quartile ($)
Median contract rent - Upper quartile ($)
Median gross rent ($)
Urban houses (%)
Rural houses (%)
Houses occupied (%)
Houses occupied (% change since 2000)
Houses owner occupied (%)
Houses owner occupied (% change since 2000)
Houses renter occupied (%)
Houses renter occupied (% change since 2000)
Vacant housing units - For rent (%)
Vacant housing units - For rent (% change since 2000)
Vacant housing units - For sale only (%)
Vacant housing units - For sale only (% change since 2000)
Vacant housing units - Rented or sold, not occupied (%)
Vacant housing units - Rented or sold, not occupied (% change since 2000)
Vacant housing units - For seasonal, recreational, or occasional use (%)
Vacant housing units - For seasonal, recreational, or occasional use (% change since 2000)
Vacant housing units - For migrant workers (%)
Vacant housing units - For migrant workers (% change since 2000)
Vacant housing units - Other vacant (%)
Vacant housing units - Other vacant (% change since 2000)
Median monthly housing costs ($)
Median household income for houses/condos with a mortgage ($)
Median household income for houses/condos without a mortgage ($)
Median household income ($)
Median household income ($) - White
Median household income ($) - Black or African American
Median household income ($) - Asian
Median household income ($) - Hispanic or Latino
Median household income ($) - American Indian and Alaska Native
Median household income ($) - Multirace
Median household income ($) - Other Race
Mortgage status - with mortgage (%)
Mortgage status - with second mortgage (%)
Mortgage status - with home equity loan (%)
Mortgage status - with both second mortgage and home equity loan (%)
Mortgage status - without a mortgage (%)
Median year house/condo built
Median year apartment built
Household type by relationship - Male householder living alone (%)
Household type by relationship - Male householder not living alone (%)
Household type by relationship - Female householder living alone (%)
Household type by relationship - Female householder not living alone (%)
Household type by relationship - Opposite-Sex spouse (%)
Household type by relationship - Same-Sex spouse (%)
Household type by relationship - Opposite-Sex unmarried partner (%)
Household type by relationship - Same-Sex unmarried partner (%)
Household type by relationship - In group quarters (%)
Size of family households - 2-person household (%)
Size of family households - 3-person household (%)
Size of family households - 4-person household (%)
Size of family households - 5-person household (%)
Size of family households - 6-person household (%)
Size of family households - 7-or-more-person household (%)
Size of nonfamily households - 1-person household (%)
Size of nonfamily households - 2-person household (%)
Size of nonfamily households - 3-person household (%)
Size of nonfamily households - 4-person household (%)
Size of nonfamily households - 5-person household (%)
Size of nonfamily households - 6-person household (%)
Size of nonfamily households - 7-or-moreperson household (%)
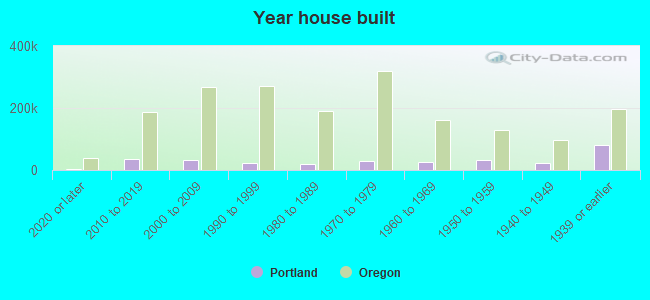
Year house built - Built 2010 or later (%)
Year house built - Built 2000 to 2009 (%)
Year house built - Built 1990 to 1999 (%)
Year house built - Built 1980 to 1989 (%)
Year house built - Built 1970 to 1979 (%)
Year house built - Built 1960 to 1969 (%)
Year house built - Built 1950 to 1959 (%)
Year house built - Built 1940 to 1949 (%)
Year house built - Built 1939 or earlier (%)
Median number of rooms in houses and condos
Median number of rooms in apartments
Median number of bedrooms in owner occupied houses
Mean number of bedrooms in owner occupied houses
Median number of bedrooms in renter occupied houses
Mean number of bedrooms in renter occupied houses
Median number of vehichles in owner occupied houses
Mean number of vehichles in owner occupied houses
Median number of vehichles in renter occupied houses
Mean number of vehichles in renter occupied houses
Rooms in owner-occupied houses - 1 room (%)
Rooms in owner-occupied houses - 2 rooms (%)
Rooms in owner-occupied houses - 3 rooms (%)
Rooms in owner-occupied houses - 4 rooms (%)
Rooms in owner-occupied houses - 5 rooms (%)
Rooms in owner-occupied houses - 6 rooms (%)
Rooms in owner-occupied houses - 7 rooms (%)
Rooms in owner-occupied houses - 8 rooms (%)
Rooms in owner-occupied houses - 9+ rooms (%)
Rooms in renter-occupied houses - 1 room (%)
Rooms in renter-occupied houses - 2 rooms (%)
Rooms in renter-occupied houses - 3 rooms (%)
Rooms in renter-occupied houses - 4 rooms (%)
Rooms in renter-occupied houses - 5 rooms (%)
Rooms in renter-occupied houses - 6 rooms (%)
Rooms in renter-occupied houses - 7 rooms (%)
Rooms in renter-occupied houses - 8 rooms (%)
Rooms in renter-occupied houses - 9+ rooms (%)
Bedrooms in owner-occupied houses - no bedrooms (%)
Bedrooms in owner-occupied houses - 1 bedroom (%)
Bedrooms in owner-occupied houses - 2 bedrooms (%)
Bedrooms in owner-occupied houses - 3 bedrooms (%)
Bedrooms in owner-occupied houses - 4 bedrooms (%)
Bedrooms in owner-occupied houses - 5+ bedrooms (%)
Bedrooms in renter-occupied houses - no bedrooms (%)
Bedrooms in renter-occupied houses - 1 bedroom (%)
Bedrooms in renter-occupied houses - 2 bedrooms (%)
Bedrooms in renter-occupied houses - 3 bedrooms (%)
Bedrooms in renter-occupied houses - 4 bedrooms (%)
Bedrooms in renter-occupied houses - 5+ bedrooms (%)
Vehicles available in owner-occupied houses - no vehicle available (%)
Vehicles available in owner-occupied houses - 1 vehicle available(%)
Vehicles available in owner-occupied houses - 2 Vehicles available (%)
Vehicles available in owner-occupied houses - 3 Vehicles available (%)
Vehicles available in owner-occupied houses - 4 Vehicles available (%)
Vehicles available in owner-occupied houses - 5+ Vehicles available (%)
Vehicles available in renter-occupied houses - no vehicle available (%)
Vehicles available in renter-occupied houses - 1 vehicle available (%)
Vehicles available in renter-occupied houses - 2 Vehicles available (%)
Vehicles available in renter-occupied houses - 3 Vehicles available (%)
Vehicles available in renter-occupied houses - 4 Vehicles available (%)
Vehicles available in renter-occupied houses - 5+ Vehicles available (%)
Housing units in structures - 1, detached (%)
Housing units in structures - 1, attached (%)
Housing units in structures - 2 (%)
Housing units in structures - 3 or 4 (%)
Housing units in structures - 5 to 9 (%)
Housing units in structures - 10 to 19 (%)
Housing units in structures - 20 to 49 (%)
Housing units in structures - 50 or more (%)
Housing units in structures - Mobile home (%)
Housing units in structures - Boat, RV, van, etc. (%)
Housing units in structures - Owners - 1, detached (%)
Housing units in structures - Owners - 1, attached (%)
Housing units in structures - Owners - 2 (%)
Housing units in structures - Owners - 3 or 4 (%)
Housing units in structures - Owners - 5 to 9 (%)
Housing units in structures - Owners - 10 to 19 (%)
Housing units in structures - Owners - 20 to 49 (%)
Housing units in structures - Owners - 50 or more (%)
Housing units in structures - Owners - Mobile home (%)
Housing units in structures - Owners - Boat, RV, van, etc. (%)
Housing units in structures - Renters - 1, detached (%)
Housing units in structures - Renters - 1, attached (%)
Housing units in structures - Renters - 2 (%)
Housing units in structures - Renters - 3 or 4 (%)
Housing units in structures - Renters - 5 to 9 (%)
Housing units in structures - Renters - 10 to 19 (%)
Housing units in structures - Renters - 20 to 49 (%)
Housing units in structures - Renters - 50 or more (%)
Housing units in structures - Renters - Mobile home (%)
Housing units in structures - Renters - Boat, RV, van, etc. (%)
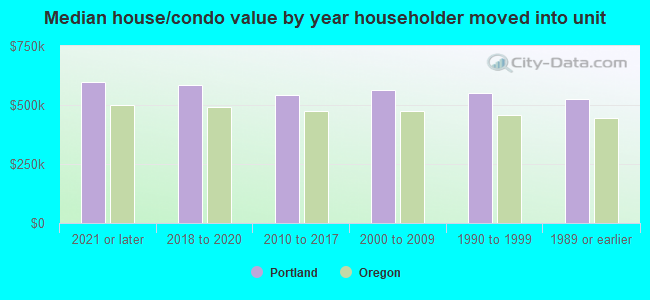
House/condo owner moved in on average (years ago)
Renter moved in on average (years ago)
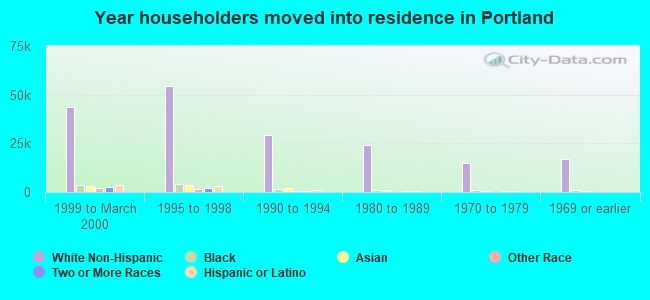
Year householder moved into unit - Moved in 1999 to March 2000 (%)
Year householder moved into unit - Moved in 1999 to March 2000 (%) - White
Year householder moved into unit - Moved in 1999 to March 2000 (%) - Black or African American
Year householder moved into unit - Moved in 1999 to March 2000 (%) - Asian
Year householder moved into unit - Moved in 1999 to March 2000 (%) - Hispanic or Latino
Year householder moved into unit - Moved in 1999 to March 2000 (%) - American Indian and Alaska Native
Year householder moved into unit - Moved in 1999 to March 2000 (%) - Multirace
Year householder moved into unit - Moved in 1999 to March 2000 (%) - Other Race
Year householder moved into unit - Moved in 1995 to 1998 (%)
Year householder moved into unit - Moved in 1995 to 1998 (%) - White
Year householder moved into unit - Moved in 1995 to 1998 (%) - Black or African American
Year householder moved into unit - Moved in 1995 to 1998 (%) - Asian
Year householder moved into unit - Moved in 1995 to 1998 (%) - Hispanic or Latino
Year householder moved into unit - Moved in 1995 to 1998 (%) - American Indian and Alaska Native
Year householder moved into unit - Moved in 1995 to 1998 (%) - Multirace
Year householder moved into unit - Moved in 1995 to 1998 (%) - Other Race
Year householder moved into unit - Moved in 1990 to 1994 (%)
Year householder moved into unit - Moved in 1990 to 1994 (%) - White
Year householder moved into unit - Moved in 1990 to 1994 (%) - Black or African American
Year householder moved into unit - Moved in 1990 to 1994 (%) - Asian
Year householder moved into unit - Moved in 1990 to 1994 (%) - Hispanic or Latino
Year householder moved into unit - Moved in 1990 to 1994 (%) - American Indian and Alaska Native
Year householder moved into unit - Moved in 1990 to 1994 (%) - Multirace
Year householder moved into unit - Moved in 1990 to 1994 (%) - Other Race
Year householder moved into unit - Moved in 1980 to 1989 (%)
Year householder moved into unit - Moved in 1980 to 1989 (%) - White
Year householder moved into unit - Moved in 1980 to 1989 (%) - Black or African American
Year householder moved into unit - Moved in 1980 to 1989 (%) - Asian
Year householder moved into unit - Moved in 1980 to 1989 (%) - Hispanic or Latino
Year householder moved into unit - Moved in 1980 to 1989 (%) - American Indian and Alaska Native
Year householder moved into unit - Moved in 1980 to 1989 (%) - Multirace
Year householder moved into unit - Moved in 1980 to 1989 (%) - Other Race
Year householder moved into unit - Moved in 1970 to 1979 (%)
Year householder moved into unit - Moved in 1970 to 1979 (%) - White
Year householder moved into unit - Moved in 1970 to 1979 (%) - Black or African American
Year householder moved into unit - Moved in 1970 to 1979 (%) - Asian
Year householder moved into unit - Moved in 1970 to 1979 (%) - Hispanic or Latino
Year householder moved into unit - Moved in 1970 to 1979 (%) - American Indian and Alaska Native
Year householder moved into unit - Moved in 1970 to 1979 (%) - Multirace
Year householder moved into unit - Moved in 1970 to 1979 (%) - Other Race
Year householder moved into unit - Moved in 1969 or earlier (%)
Year householder moved into unit - Moved in 1969 or earlier (%) - White
Year householder moved into unit - Moved in 1969 or earlier (%) - Black or African American
Year householder moved into unit - Moved in 1969 or earlier (%) - Asian
Year householder moved into unit - Moved in 1969 or earlier (%) - Hispanic or Latino
Year householder moved into unit - Moved in 1969 or earlier (%) - American Indian and Alaska Native
Year householder moved into unit - Moved in 1969 or earlier (%) - Multirace
Year householder moved into unit - Moved in 1969 or earlier (%) - Other Race
Housing units lacking complete plumbing facilities (%)
Housing units lacking complete kitchen facilities (%)
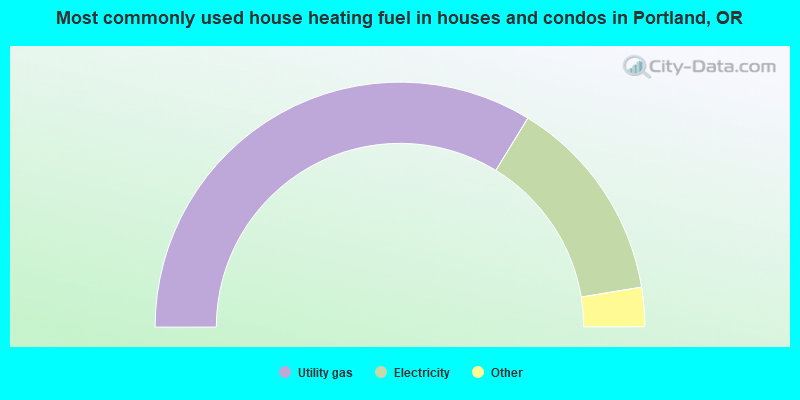
House heating fuel used in houses and condos - Utility gas (%)
House heating fuel used in houses and condos - Bottled, tank, or LP gas (%)
House heating fuel used in houses and condos - Electricity (%)
House heating fuel used in houses and condos - Fuel oil, kerosene, etc. (%)
House heating fuel used in houses and condos - Coal or coke (%)
House heating fuel used in houses and condos - Wood (%)
House heating fuel used in houses and condos - Solar energy (%)
House heating fuel used in houses and condos - Other fuel (%)
House heating fuel used in houses and condos - No fuel used (%)
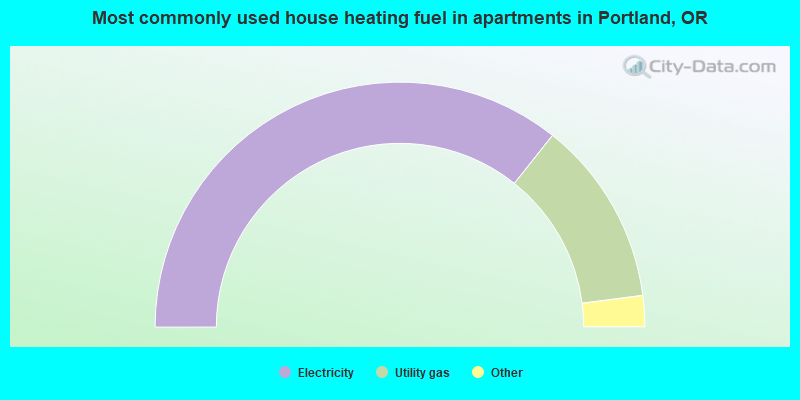
House heating fuel used in apartments - Utility gas (%)
House heating fuel used in apartments - Bottled, tank, or LP gas (%)
House heating fuel used in apartments - Electricity (%)
House heating fuel used in apartments - Fuel oil, kerosene, etc. (%)
House heating fuel used in apartments - Coal or coke (%)
House heating fuel used in apartments - Wood (%)
House heating fuel used in apartments - Solar energy (%)
House heating fuel used in apartments - Other fuel (%)
House heating fuel used in apartments - No fuel used (%)
Latest news about housing in Portland, OR collected exclusively by city-data.com from local newspapers, TV, and radio stations
Median year house/condo built: 1955Median year apartment built: 1977Household type by relationship:
Households: 635,296
Male householders: 136,639 (50,245 living alone ), Female householders: 147,894 (56,378 living alone )95,463 spouses (91,954 opposite-sex spouses ), 36,389 unmarried partners , (32,024 opposite-sex unmarried partners ), 131,226 children (121,110 natural , 5,527 adopted , 4,589 stepchildren ), 4,615 grandchildren , 6,647 brothers or sisters , 7,536 parents , 2,171 foster children , 4,828 other relatives , 43,584 non-relatives In group quarters: 18,304
Size of family households: 60,060 2-persons , 33,956 3-persons , 24,947 4-persons , 7,606 5-persons , 2,785 6-persons , 1,219 7-or-more-persons .
Size of nonfamily households: 106,623 1-person , 39,014 2-persons , 5,366 3-persons , 1,518 4-persons , 708 5-persons , 626 6-persons , 105 7-or-more-persons .
67,610 married couples with children. single-parent households (9,562 men , 20,513 women ).
83.1% of residents of Portland speak English at home. of residents speak Spanish at home (69% speak English very well , 15% speak English well , 11% speak English not well , 5% don't speak English at all ).of residents speak other Indo-European language at home (69% speak English very well , 16% speak English well , 13% speak English not well , 2% don't speak English at all ).of residents speak Asian or Pacific Island language at home (45% speak English very well , 23% speak English well , 24% speak English not well , 8% don't speak English at all ).of residents speak other language at home (63% speak English very well , 23% speak English well , 10% speak English not well , 4% don't speak English at all ).
Foreign born population: 77,231 (12.2%)of them are naturalized citizens )
Median number of rooms in houses and condos:
Median number of rooms in apartments
Owner-occupied Renter-occupied
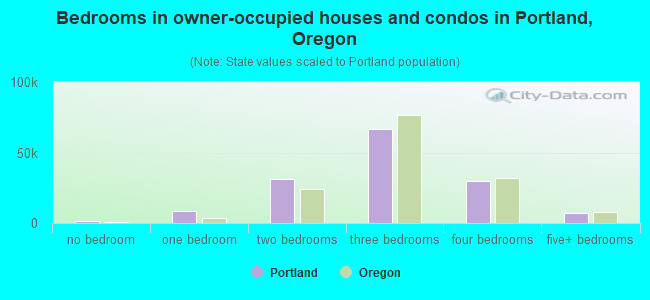
Bedrooms in owner-occupied houses and condos in Portland, Oregon
1,208 no bedroom 8,407 1 bedroom 31,408 2 bedrooms 66,890 3 bedrooms 29,789 4 bedrooms 7,006 5+ bedrooms
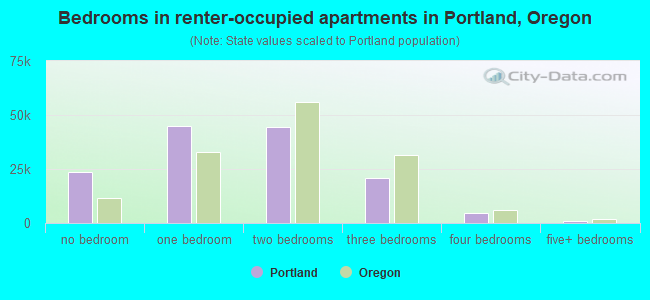
Bedrooms in renter-occupied apartments in Portland, Oregon
23,385 no bedroom 45,033 1 bedroom 44,674 2 bedrooms 21,063 3 bedrooms 4,756 4 bedrooms 914 5+ bedrooms
Owner-occupied Renter-occupied
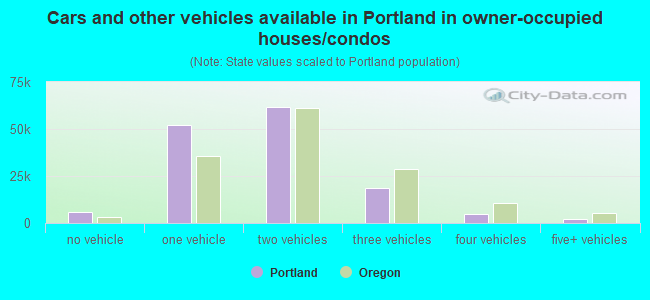
Cars and other vehicles available in Portland in owner-occupied houses/condos
5,590 no vehicle 51,982 1 vehicle 61,683 2 vehicles 18,548 3 vehicles 4,740 4 vehicles 2,165 5+ vehicles
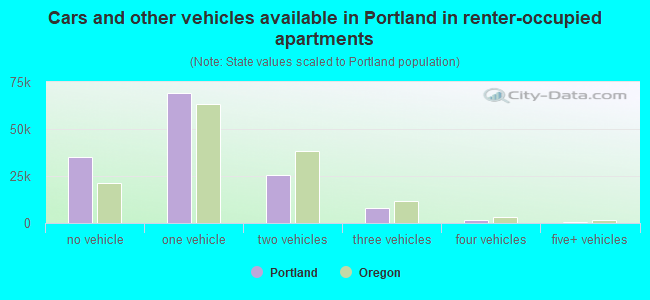
Cars and other vehicles available in Portland in renter-occupied apartments
34,962 no vehicle 69,292 1 vehicle 25,509 2 vehicles 7,950 3 vehicles 1,395 4 vehicles 717 5+ vehicles
Owner-occupied Renter-occupied
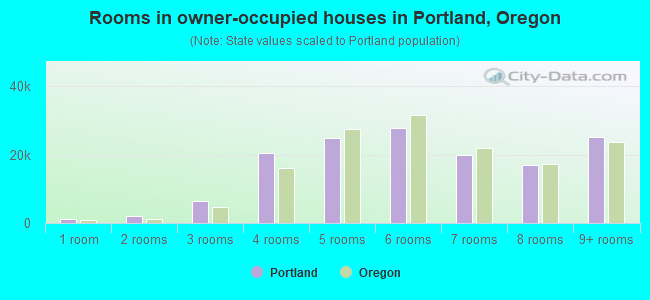
Rooms in owner-occupied houses in Portland, Oregon
1,056 1 room 2,027 2 rooms 6,473 3 rooms 20,376 4 rooms 24,788 5 rooms 27,875 6 rooms 19,924 7 rooms 16,875 8 rooms 25,314 9+ rooms
Rooms in renter-occupied apartments in Portland, Oregon
20,242 1 room 20,628 2 rooms 31,303 3 rooms 29,564 4 rooms 19,684 5 rooms 9,169 6 rooms 3,812 7 rooms 1,975 8 rooms 3,448 9+ rooms
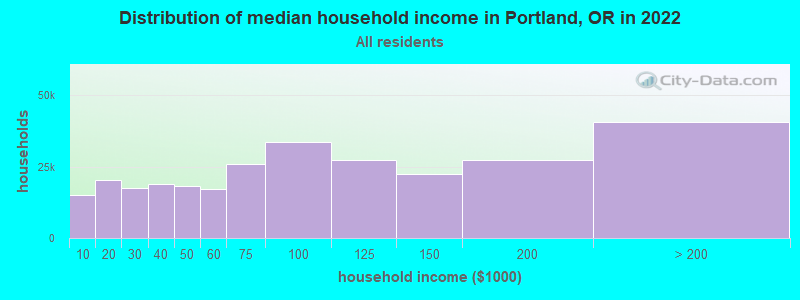
Portland, OR household income distribution 14,944 Less than $10,00020,419 $10,000 to $19,99917,402 $20,000 to $29,99918,788 $30,000 to $39,99918,406 $40,000 to $49,99917,315 $50,000 to $59,99925,797 $60,000 to $74,99933,668 $75,000 to $99,99927,322 $100,000 to $124,99922,394 $125,000 to $149,99927,379 $150,000 to $199,99940,699 $200,000 or more
Home value of owner - occupied houses in 2022 in Portland, OR 882 Less than $10,000158 $10,000 to $14,999294 $15,000 to $19,999223 $20,000 to $24,999373 $30,000 to $34,999219 $35,000 to $39,999972 $40,000 to $49,999268 $50,000 to $59,999225 $60,000 to $69,999340 $70,000 to $79,999501 $80,000 to $89,99972 $90,000 to $99,999442 $100,000 to $124,999702 $125,000 to $149,999466 $150,000 to $174,999519 $175,000 to $199,9991,780 $200,000 to $249,9992,608 $250,000 to $299,99917,744 $300,000 to $399,99930,202 $400,000 to $499,99953,460 $500,000 to $749,99921,932 $750,000 to $999,9998,119 $1,000,000 to $1,499,9991,481 $1,500,000 to $1,999,999726 $2,000,000 or moreRent paid by renters in 2022 in Portland, OR 191 Less than $100709 $100 to $1491,695 $150 to $1991,131 $200 to $249889 $250 to $299630 $300 to $3491,650 $350 to $399834 $400 to $449849 $450 to $499864 $500 to $549316 $550 to $599847 $600 to $649960 $650 to $6991,310 $700 to $7491,811 $750 to $7995,434 $800 to $8998,040 $900 to $99926,159 $1,000 to $1,24929,429 $1,250 to $1,49931,348 $1,500 to $1,99914,319 $2,000 to $2,4994,109 $2,500 to $2,9991,778 $3,000 to $3,4991,432 $3,500 or more3,091 No cash rent
Percentage of workers working in this county: 83.7%Number of people working at home: 101,430 (28.6% of all workers )
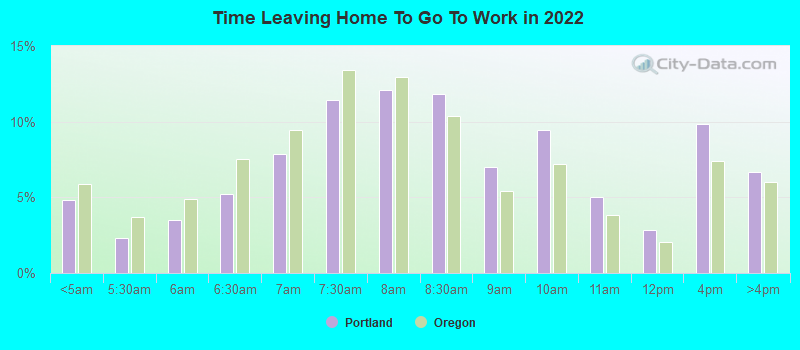
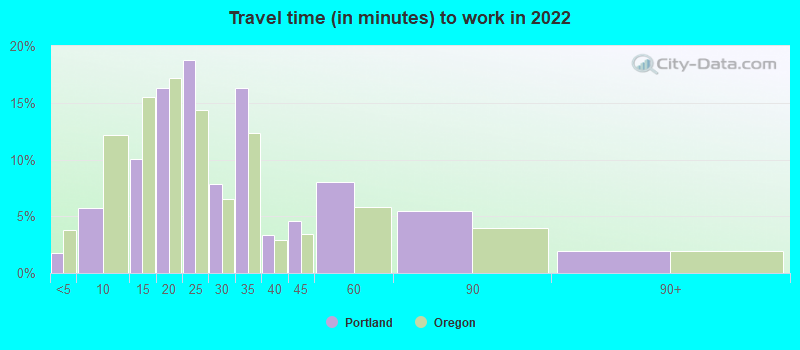
Travel time to work (commute)
Less than 5 minutes: 5,3165 to 9 minutes: 19,28110 to 14 minutes: 31,13815 to 19 minutes: 50,75520 to 24 minutes: 49,39825 to 29 minutes: 19,64930 to 34 minutes: 38,08735 to 39 minutes: 6,48840 to 44 minutes: 6,62645 to 59 minutes: 14,74960 to 89 minutes: 7,96390 or more minutes: 4,043
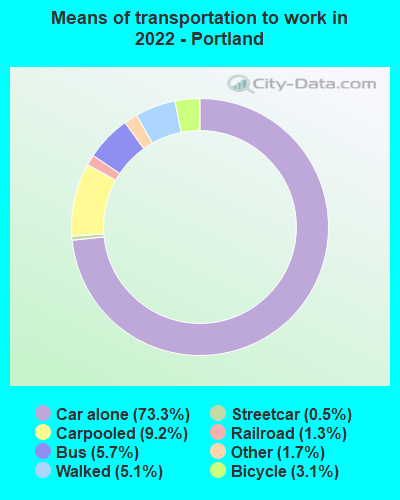
Means of transportation to work:
Drove a car alone: 258,618 (56.9%)Carpooled: 32,570 (7.2%)Bus : 20,015 (4.4%)Subway or elevated rail : 1,795 (0.4%)Long-distance train or commuter rail : 297 (0.1%)Light rail, streetcar or trolley : 4,605 (1.0%)Taxi: 6,002 (1.3%)Bicycle: 10,954 (2.4%)Walked: 18,012 (4.0%)Worked at home: 101,430 (22.3%)
Unemployment by race in 2022
Unemployment rate for White non-Hispanic residents 5.4% Males2.8% FemalesUnemployment rate for Black residents 14.0% Males7.9% FemalesUnemployment rate for American Indian and Alaska Native residents 5.7% Males11.9% FemalesUnemployment rate for Asian residents 3.5% Males3.3% FemalesUnemployment rate for other race residents 5.3% Males2.8% FemalesUnemployment rate for two or more race residents 4.4% Males4.1% FemalesUnemployment rate for Hispanic or Latino residents 3.1% Males3.8% Females
Year of entry for the foreign-born population in Portland, Oregon
22,960 2010 or later 17,714 2000 to 2009 16,818 1990 to 1999 16,620 1980 to 1989 7,002 1970 to 1979 7,730 Before 1970
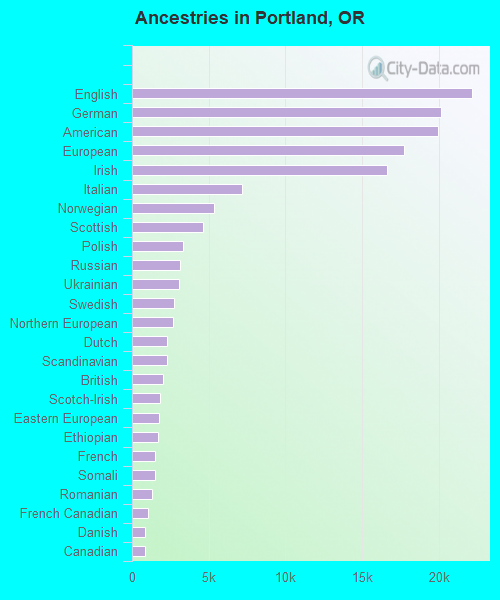
First ancestries reported:
English: 22,160 (7.5%)
German: 20,164 (6.8%)
American: 19,929 (6.7%)
European: 17,714 (6.0%)
Irish: 16,620 (5.6%)
Italian: 7,182 (2.4%)
Norwegian: 5,331 (1.8%)
Scottish: 4,614 (1.6%)
Polish: 3,294 (1.1%)
Russian: 3,115 (1.0%)
Ukrainian: 3,048 (1.0%)
Swedish: 2,730 (0.9%)
Northern European: 2,694 (0.9%)
Dutch: 2,277 (0.8%)
Scandinavian: 2,262 (0.8%)
British: 2,026 (0.7%)
Scotch-Irish: 1,823 (0.6%)
Eastern European: 1,744 (0.6%)
Ethiopian: 1,703 (0.6%)
French: 1,519 (0.5%)
Somali: 1,514 (0.5%)
Romanian: 1,315 (0.4%)
French Canadian: 1,061 (0.4%)
Danish: 871 (0.3%)
Canadian: 847 (0.3%)
Greek: 812 (0.3%)
Turkish: 731 (0.2%)
African: 726 (0.2%)
Iranian: 701 (0.2%)
Finnish: 685 (0.2%)
Hungarian: 672 (0.2%)
Nigerian: 670 (0.2%)
Yugoslavian: 613 (0.2%)
Swiss: 562 (0.2%)
Czech: 505 (0.2%)
Haitian: 457 (0.2%)
Croatian: 452 (0.2%)
Welsh: 440 (0.1%)
Armenian: 437 (0.1%)
Lithuanian: 391 (0.1%)
Austrian: 382 (0.1%)
Trinidadian and Tobagonian: 364 (0.1%)
Portuguese: 341 (0.1%)
Lebanese: 322 (0.1%)
Jamaican: 294 (0.10%)
Syrian: 293 (0.10%)
Afghan: 291 (0.10%)
Ghanaian: 284 (0.10%)
Liberian: 275 (0.09%)
Belgian: 271 (0.09%)
Arab: 255 (0.09%)
Latvian: 199 (0.07%)
Jordanian: 189 (0.06%)
Australian: 186 (0.06%)
Slavic: 171 (0.06%)
German Russian: 167 (0.06%)
Czechoslovakian: 149 (0.05%)
Kenyan: 146 (0.05%)
Bulgarian: 133 (0.04%)
Slovak: 128 (0.04%)
Celtic: 120 (0.04%)
Brazilian: 119 (0.04%)
Israeli: 116 (0.04%)
Basque: 115 (0.04%)
Serbian: 112 (0.04%)
Macedonian: 107 (0.04%)
Guyanese: 95 (0.03%)
Palestinian: 87 (0.03%)
Belizean: 79 (0.03%)
Iraqi: 78 (0.03%)
Cajun: 75 (0.03%)
Senegalese: 75 (0.03%)
Estonian: 69 (0.02%)
West Indian: 67 (0.02%)
Alsatian: 64 (0.02%)
Slovene: 59 (0.02%)
Icelander: 44 (0.01%)
Egyptian: 43 (0.01%)
Moroccan: 41 (0.01%)
Ugandan: 37 (0.01%)
South African: 34 (0.01%)
Pennsylvania German: 27 (0.01%)
New Zealander: 24 (0.01%)
Luxembourger: 15 (0.01%)
Most common places of birth for foreign-born residents (%): Mexico Portland:
14.1% (11,716)Oregon:
33.9% (140,109)
Vietnam Portland:
12.9% (10,736)Oregon:
5.5% (22,563)
China, excluding Hong Kong and Taiwan Portland:
8.7% (7,224)Oregon:
5.2% (21,429)
Canada Portland:
3.7% (3,072)Oregon:
3.7% (15,229)
Ukraine Portland:
3.4% (2,844)Oregon:
2.1% (8,469)
Philippines Portland:
3.2% (2,702)Oregon:
3.5% (14,530)
India Portland:
2.8% (2,361)Oregon:
4.7% (19,604)
Ethiopia Portland:
2.0% (1,695)Oregon:
0.9% (3,555)
Germany Portland:
1.9% (1,595)Oregon:
1.9% (8,005)
United Kingdom, excluding England and Scotland Portland:
1.7% (1,405)Oregon:
1.2% (5,082)
Laos Portland:
1.6% (1,316)Oregon:
0.8% (3,218)
Russia Portland:
1.5% (1,250)Oregon:
1.3% (5,229)
Japan Portland:
1.5% (1,249)Oregon:
1.5% (6,259)
Place of birth for U.S.-born residents:
This state: 242,269Other state: 306,238Northeast: 42,673Midwest: 63,366South: 45,766West: 154,433 82.6% of Portland residents lived in the same house 1 years ago.
Out of people who lived in different houses, 35.7% lived in this county.
Out of people who lived in different counties, 43.8% lived in Oregon.
Portland:
82.6%State average:
85.5%
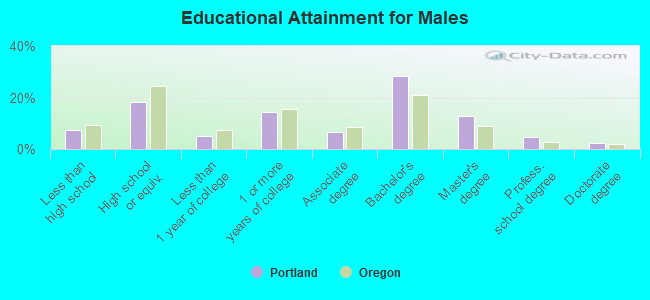
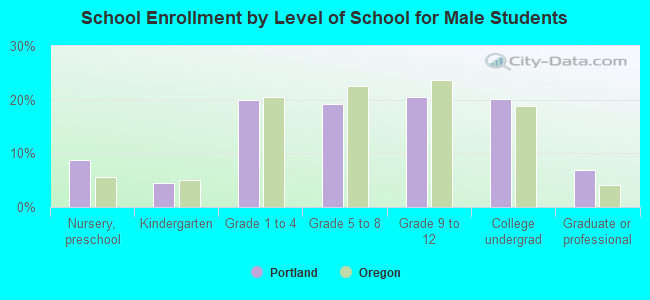
Education attainment for males 25 years and older:
No schooling: 3,762Nursery to 4th grade: 5745th and 6th grade: 1,3877th and 8th grade: 1,8119th grade: 1,45210th grade: 1,77311th grade: 2,59612th grade, no diploma: 4,656High school graduate (or equivalency): 43,060Less than 1 year of college: 12,277Some college more than 1 year, no degree: 34,194Associate degree: 15,431Bachelor's degree: 67,499Master's degree: 30,529Professional school degree: 11,331Doctorate degree: 5,576
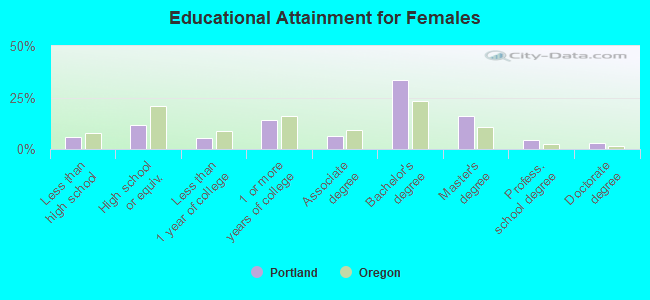
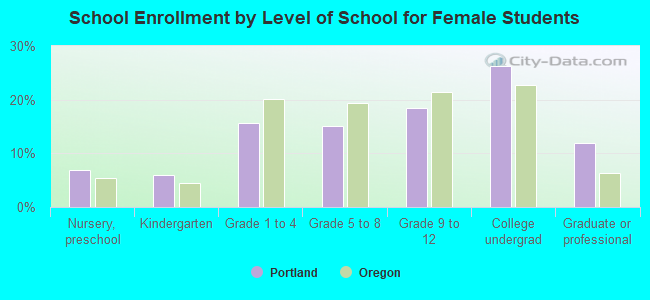
Education attainment for females 25 years and older:
No schooling: 4,494Nursery to 4th grade: 1,0645th and 6th grade: 1,1007th and 8th grade: 6089th grade: 1,36010th grade: 1,68311th grade: 92912th grade, no diploma: 2,781High school graduate (or equivalency): 28,538Less than 1 year of college: 12,431Some college more than 1 year, no degree: 34,143Associate degree: 15,648Bachelor's degree: 80,361Master's degree: 38,650Professional school degree: 10,914Doctorate degree: 6,578
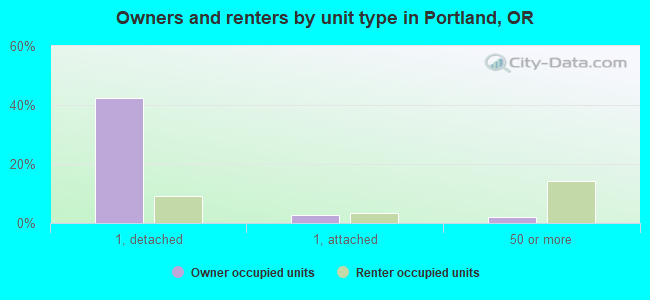
Housing units in structures:
One, detached: 154,518One, attached: 18,926Two: 9,7703 or 4: 13,8795 to 9: 14,26010 to 19: 17,24120 to 49: 20,71250 or more: 51,056Mobile homes: 4,494Boats, RVs, vans, etc.: 221Median worth of mobile homes: $61,600
Housing units lacking complete plumbing facilities in 2022: 0.8%Housing units lacking complete kitchen facilities in 2022: 1.3%House/condo owner moved in on average 10 years ago
Renter moved in on average 2 years ago
Private vs. public school enrollment:
Students in private schools in grades 1 to 8 (elementary and middle school): 5,569 Students in private schools in grades 9 to 12 (high school): 3,026 Students in private undergraduate colleges: 9,020