Port St. John, FL (Florida) Houses and Residents
Estimated median house or condo value in 2022: $283,009 (it was $77,800 in 2000 )
Port St. John:
$283,009Florida:
$354,100
Lower value quartile - upper value quartile: $237,846 - $331,449Total population: 12,267 (Urban population: 11,967, Rural population: 0)
Houses: 10,531 (9,428 occupied: 8,636 owner occupied, 851 renter occupied )
% of renters here:
9%State:
33%
Housing density: 2,758 houses/condos per square mile
Median price asked for vacant for-sale houses and condos in 2022: $199,100.
Median contract rent in 2022: $1,429 (lower quartile is $966, upper quartile is $1,868)
Median rent asked for vacant for-rent units in 2022: $1,694
Median gross rent in Port St. John, FL in 2022: $1,510
Housing units in Port St. John with a mortgage: 6,219 (656 second mortgage, 0 home equity loan, 509 both second mortgage and home equity loan )Houses without a mortgage: 535
Median household income for houses/condos with a mortgage: $92,929
Median household income for apartments without a mortgage: $70,876
Median monthly housing costs: $1,214
Data:
Median house or condo value ($)
Median house or condo value ($ change since 2000)
Median house or condo value ($) - White
Median house or condo value ($) - Black or African American
Median house or condo value ($) - Asian
Median house or condo value ($) - Hispanic or Latino
Median house or condo value ($) - American Indian and Alaska Native
Median house or condo value ($) - Multirace
Median house or condo value ($) - Other Race
Median price asked for mobile homes ($)
Household density (households per square mile)
Mean house or condo value by units in structure - 1, detached ($)
Mean house or condo value by units in structure - 1, attached ($)
Mean house or condo value by units in structure - 2 ($)
Mean house or condo value by units in structure by units in structure - 3 or 4 ($)
Mean house or condo value by units in structure - 5 or more ($)
Mean house or condo value by units in structure - Boat, RV, van, etc. ($)
Mean house or condo value by units in structure - Mobile home ($)
Median contract rent ($)
Median contract rent - Lower quartile ($)
Median contract rent - Upper quartile ($)
Median gross rent ($)
Urban houses (%)
Rural houses (%)
Houses occupied (%)
Houses occupied (% change since 2000)
Houses owner occupied (%)
Houses owner occupied (% change since 2000)
Houses renter occupied (%)
Houses renter occupied (% change since 2000)
Vacant housing units - For rent (%)
Vacant housing units - For rent (% change since 2000)
Vacant housing units - For sale only (%)
Vacant housing units - For sale only (% change since 2000)
Vacant housing units - Rented or sold, not occupied (%)
Vacant housing units - Rented or sold, not occupied (% change since 2000)
Vacant housing units - For seasonal, recreational, or occasional use (%)
Vacant housing units - For seasonal, recreational, or occasional use (% change since 2000)
Vacant housing units - For migrant workers (%)
Vacant housing units - For migrant workers (% change since 2000)
Vacant housing units - Other vacant (%)
Vacant housing units - Other vacant (% change since 2000)
Median monthly housing costs ($)
Median household income for houses/condos with a mortgage ($)
Median household income for houses/condos without a mortgage ($)
Median household income ($)
Median household income ($) - White
Median household income ($) - Black or African American
Median household income ($) - Asian
Median household income ($) - Hispanic or Latino
Median household income ($) - American Indian and Alaska Native
Median household income ($) - Multirace
Median household income ($) - Other Race
Mortgage status - with mortgage (%)
Mortgage status - with second mortgage (%)
Mortgage status - with home equity loan (%)
Mortgage status - with both second mortgage and home equity loan (%)
Mortgage status - without a mortgage (%)
Median year house/condo built
Median year apartment built
Household type by relationship - Male householder living alone (%)
Household type by relationship - Male householder not living alone (%)
Household type by relationship - Female householder living alone (%)
Household type by relationship - Female householder not living alone (%)
Household type by relationship - Opposite-Sex spouse (%)
Household type by relationship - Same-Sex spouse (%)
Household type by relationship - Opposite-Sex unmarried partner (%)
Household type by relationship - Same-Sex unmarried partner (%)
Household type by relationship - In group quarters (%)
Size of family households - 2-person household (%)
Size of family households - 3-person household (%)
Size of family households - 4-person household (%)
Size of family households - 5-person household (%)
Size of family households - 6-person household (%)
Size of family households - 7-or-more-person household (%)
Size of nonfamily households - 1-person household (%)
Size of nonfamily households - 2-person household (%)
Size of nonfamily households - 3-person household (%)
Size of nonfamily households - 4-person household (%)
Size of nonfamily households - 5-person household (%)
Size of nonfamily households - 6-person household (%)
Size of nonfamily households - 7-or-moreperson household (%)
Year house built - Built 2010 or later (%)
Year house built - Built 2000 to 2009 (%)
Year house built - Built 1990 to 1999 (%)
Year house built - Built 1980 to 1989 (%)
Year house built - Built 1970 to 1979 (%)
Year house built - Built 1960 to 1969 (%)
Year house built - Built 1950 to 1959 (%)
Year house built - Built 1940 to 1949 (%)
Year house built - Built 1939 or earlier (%)
Median number of rooms in houses and condos
Median number of rooms in apartments
Median number of bedrooms in owner occupied houses
Mean number of bedrooms in owner occupied houses
Median number of bedrooms in renter occupied houses
Mean number of bedrooms in renter occupied houses
Median number of vehichles in owner occupied houses
Mean number of vehichles in owner occupied houses
Median number of vehichles in renter occupied houses
Mean number of vehichles in renter occupied houses
Rooms in owner-occupied houses - 1 room (%)
Rooms in owner-occupied houses - 2 rooms (%)
Rooms in owner-occupied houses - 3 rooms (%)
Rooms in owner-occupied houses - 4 rooms (%)
Rooms in owner-occupied houses - 5 rooms (%)
Rooms in owner-occupied houses - 6 rooms (%)
Rooms in owner-occupied houses - 7 rooms (%)
Rooms in owner-occupied houses - 8 rooms (%)
Rooms in owner-occupied houses - 9+ rooms (%)
Rooms in renter-occupied houses - 1 room (%)
Rooms in renter-occupied houses - 2 rooms (%)
Rooms in renter-occupied houses - 3 rooms (%)
Rooms in renter-occupied houses - 4 rooms (%)
Rooms in renter-occupied houses - 5 rooms (%)
Rooms in renter-occupied houses - 6 rooms (%)
Rooms in renter-occupied houses - 7 rooms (%)
Rooms in renter-occupied houses - 8 rooms (%)
Rooms in renter-occupied houses - 9+ rooms (%)
Bedrooms in owner-occupied houses - no bedrooms (%)
Bedrooms in owner-occupied houses - 1 bedroom (%)
Bedrooms in owner-occupied houses - 2 bedrooms (%)
Bedrooms in owner-occupied houses - 3 bedrooms (%)
Bedrooms in owner-occupied houses - 4 bedrooms (%)
Bedrooms in owner-occupied houses - 5+ bedrooms (%)
Bedrooms in renter-occupied houses - no bedrooms (%)
Bedrooms in renter-occupied houses - 1 bedroom (%)
Bedrooms in renter-occupied houses - 2 bedrooms (%)
Bedrooms in renter-occupied houses - 3 bedrooms (%)
Bedrooms in renter-occupied houses - 4 bedrooms (%)
Bedrooms in renter-occupied houses - 5+ bedrooms (%)
Vehicles available in owner-occupied houses - no vehicle available (%)
Vehicles available in owner-occupied houses - 1 vehicle available(%)
Vehicles available in owner-occupied houses - 2 Vehicles available (%)
Vehicles available in owner-occupied houses - 3 Vehicles available (%)
Vehicles available in owner-occupied houses - 4 Vehicles available (%)
Vehicles available in owner-occupied houses - 5+ Vehicles available (%)
Vehicles available in renter-occupied houses - no vehicle available (%)
Vehicles available in renter-occupied houses - 1 vehicle available (%)
Vehicles available in renter-occupied houses - 2 Vehicles available (%)
Vehicles available in renter-occupied houses - 3 Vehicles available (%)
Vehicles available in renter-occupied houses - 4 Vehicles available (%)
Vehicles available in renter-occupied houses - 5+ Vehicles available (%)
Housing units in structures - 1, detached (%)
Housing units in structures - 1, attached (%)
Housing units in structures - 2 (%)
Housing units in structures - 3 or 4 (%)
Housing units in structures - 5 to 9 (%)
Housing units in structures - 10 to 19 (%)
Housing units in structures - 20 to 49 (%)
Housing units in structures - 50 or more (%)
Housing units in structures - Mobile home (%)
Housing units in structures - Boat, RV, van, etc. (%)
Housing units in structures - Owners - 1, detached (%)
Housing units in structures - Owners - 1, attached (%)
Housing units in structures - Owners - 2 (%)
Housing units in structures - Owners - 3 or 4 (%)
Housing units in structures - Owners - 5 to 9 (%)
Housing units in structures - Owners - 10 to 19 (%)
Housing units in structures - Owners - 20 to 49 (%)
Housing units in structures - Owners - 50 or more (%)
Housing units in structures - Owners - Mobile home (%)
Housing units in structures - Owners - Boat, RV, van, etc. (%)
Housing units in structures - Renters - 1, detached (%)
Housing units in structures - Renters - 1, attached (%)
Housing units in structures - Renters - 2 (%)
Housing units in structures - Renters - 3 or 4 (%)
Housing units in structures - Renters - 5 to 9 (%)
Housing units in structures - Renters - 10 to 19 (%)
Housing units in structures - Renters - 20 to 49 (%)
Housing units in structures - Renters - 50 or more (%)
Housing units in structures - Renters - Mobile home (%)
Housing units in structures - Renters - Boat, RV, van, etc. (%)
House/condo owner moved in on average (years ago)
Renter moved in on average (years ago)
Year householder moved into unit - Moved in 1999 to March 2000 (%)
Year householder moved into unit - Moved in 1999 to March 2000 (%) - White
Year householder moved into unit - Moved in 1999 to March 2000 (%) - Black or African American
Year householder moved into unit - Moved in 1999 to March 2000 (%) - Asian
Year householder moved into unit - Moved in 1999 to March 2000 (%) - Hispanic or Latino
Year householder moved into unit - Moved in 1999 to March 2000 (%) - American Indian and Alaska Native
Year householder moved into unit - Moved in 1999 to March 2000 (%) - Multirace
Year householder moved into unit - Moved in 1999 to March 2000 (%) - Other Race
Year householder moved into unit - Moved in 1995 to 1998 (%)
Year householder moved into unit - Moved in 1995 to 1998 (%) - White
Year householder moved into unit - Moved in 1995 to 1998 (%) - Black or African American
Year householder moved into unit - Moved in 1995 to 1998 (%) - Asian
Year householder moved into unit - Moved in 1995 to 1998 (%) - Hispanic or Latino
Year householder moved into unit - Moved in 1995 to 1998 (%) - American Indian and Alaska Native
Year householder moved into unit - Moved in 1995 to 1998 (%) - Multirace
Year householder moved into unit - Moved in 1995 to 1998 (%) - Other Race
Year householder moved into unit - Moved in 1990 to 1994 (%)
Year householder moved into unit - Moved in 1990 to 1994 (%) - White
Year householder moved into unit - Moved in 1990 to 1994 (%) - Black or African American
Year householder moved into unit - Moved in 1990 to 1994 (%) - Asian
Year householder moved into unit - Moved in 1990 to 1994 (%) - Hispanic or Latino
Year householder moved into unit - Moved in 1990 to 1994 (%) - American Indian and Alaska Native
Year householder moved into unit - Moved in 1990 to 1994 (%) - Multirace
Year householder moved into unit - Moved in 1990 to 1994 (%) - Other Race
Year householder moved into unit - Moved in 1980 to 1989 (%)
Year householder moved into unit - Moved in 1980 to 1989 (%) - White
Year householder moved into unit - Moved in 1980 to 1989 (%) - Black or African American
Year householder moved into unit - Moved in 1980 to 1989 (%) - Asian
Year householder moved into unit - Moved in 1980 to 1989 (%) - Hispanic or Latino
Year householder moved into unit - Moved in 1980 to 1989 (%) - American Indian and Alaska Native
Year householder moved into unit - Moved in 1980 to 1989 (%) - Multirace
Year householder moved into unit - Moved in 1980 to 1989 (%) - Other Race
Year householder moved into unit - Moved in 1970 to 1979 (%)
Year householder moved into unit - Moved in 1970 to 1979 (%) - White
Year householder moved into unit - Moved in 1970 to 1979 (%) - Black or African American
Year householder moved into unit - Moved in 1970 to 1979 (%) - Asian
Year householder moved into unit - Moved in 1970 to 1979 (%) - Hispanic or Latino
Year householder moved into unit - Moved in 1970 to 1979 (%) - American Indian and Alaska Native
Year householder moved into unit - Moved in 1970 to 1979 (%) - Multirace
Year householder moved into unit - Moved in 1970 to 1979 (%) - Other Race
Year householder moved into unit - Moved in 1969 or earlier (%)
Year householder moved into unit - Moved in 1969 or earlier (%) - White
Year householder moved into unit - Moved in 1969 or earlier (%) - Black or African American
Year householder moved into unit - Moved in 1969 or earlier (%) - Asian
Year householder moved into unit - Moved in 1969 or earlier (%) - Hispanic or Latino
Year householder moved into unit - Moved in 1969 or earlier (%) - American Indian and Alaska Native
Year householder moved into unit - Moved in 1969 or earlier (%) - Multirace
Year householder moved into unit - Moved in 1969 or earlier (%) - Other Race
Housing units lacking complete plumbing facilities (%)
Housing units lacking complete kitchen facilities (%)
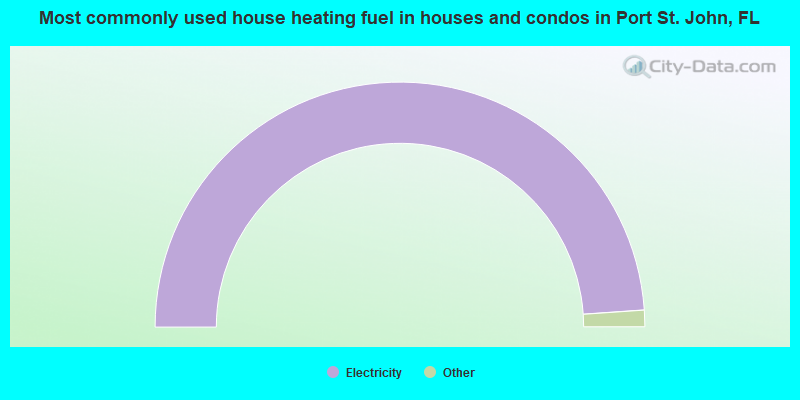
House heating fuel used in houses and condos - Utility gas (%)
House heating fuel used in houses and condos - Bottled, tank, or LP gas (%)
House heating fuel used in houses and condos - Electricity (%)
House heating fuel used in houses and condos - Fuel oil, kerosene, etc. (%)
House heating fuel used in houses and condos - Coal or coke (%)
House heating fuel used in houses and condos - Wood (%)
House heating fuel used in houses and condos - Solar energy (%)
House heating fuel used in houses and condos - Other fuel (%)
House heating fuel used in houses and condos - No fuel used (%)
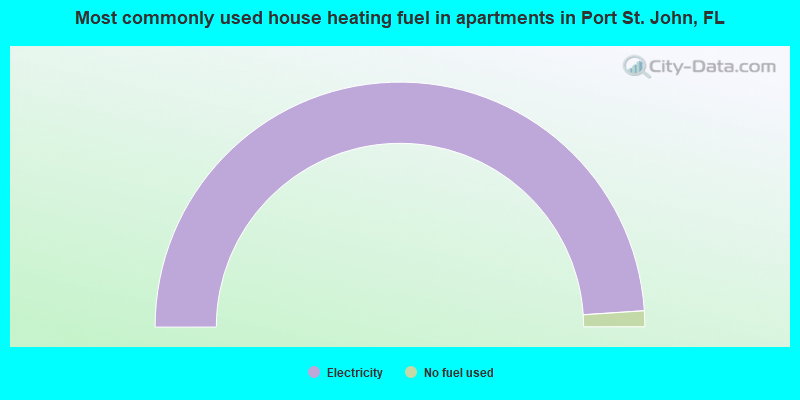
House heating fuel used in apartments - Utility gas (%)
House heating fuel used in apartments - Bottled, tank, or LP gas (%)
House heating fuel used in apartments - Electricity (%)
House heating fuel used in apartments - Fuel oil, kerosene, etc. (%)
House heating fuel used in apartments - Coal or coke (%)
House heating fuel used in apartments - Wood (%)
House heating fuel used in apartments - Solar energy (%)
House heating fuel used in apartments - Other fuel (%)
House heating fuel used in apartments - No fuel used (%)
Median year house/condo built: 1990Median year apartment built: 1988Household type by relationship:
Households: 25,162
Male householders: 4,818 (1,315 living alone ), Female householders: 4,631 (941 living alone )5,631 spouses (5,612 opposite-sex spouses ), 708 unmarried partners , (679 opposite-sex unmarried partners ), 6,862 children (6,128 natural , 199 adopted , 534 stepchildren ), 683 grandchildren , 127 brothers or sisters , 422 parents , 23 foster children , 428 other relatives , 825 non-relatives
Size of family households: 3,287 2-persons , 1,768 3-persons , 885 4-persons , 516 5-persons , 175 6-persons , 59 7-or-more-persons .
Size of nonfamily households: 2,213 1-person , 385 2-persons , 112 3-persons , 55 4-persons .
2,857 married couples with children. single-parent households (182 men , 607 women ).
92.3% of residents of Port St. John speak English at home. of residents speak Spanish at home (59% speak English very well , 14% speak English well , 14% speak English not well , 13% don't speak English at all ).of residents speak other Indo-European language at home (73% speak English very well , 21% speak English well , 6% don't speak English at all ).of residents speak Asian or Pacific Island language at home (64% speak English very well , 25% speak English well , 11% speak English not well ).
Foreign born population: 1,614 (6.4%)of them are naturalized citizens )
Median number of rooms in houses and condos:
Median number of rooms in apartments
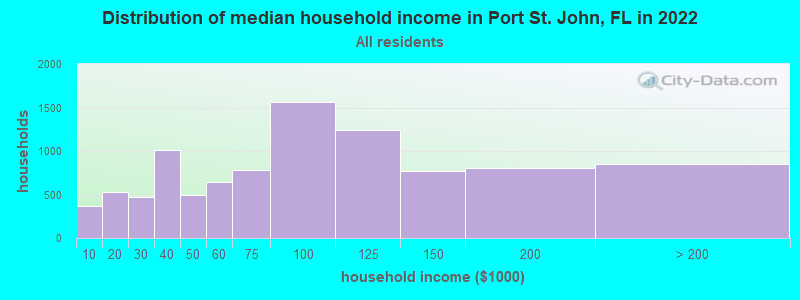
Port St. John, FL household income distribution 373 Less than $10,000530 $10,000 to $19,999468 $20,000 to $29,9991,011 $30,000 to $39,999497 $40,000 to $49,999638 $50,000 to $59,999785 $60,000 to $74,9991,568 $75,000 to $99,9991,238 $100,000 to $124,999766 $125,000 to $149,999805 $150,000 to $199,999854 $200,000 or more
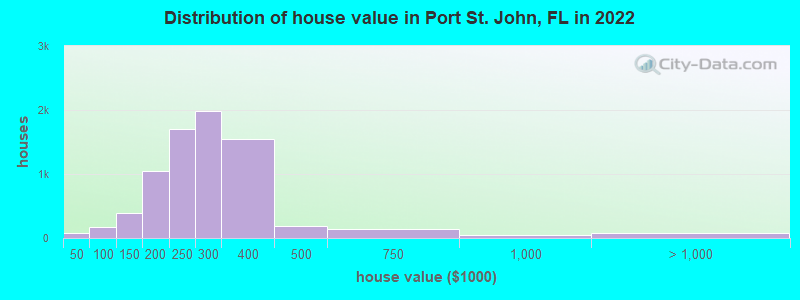
Home value of owner - occupied houses in 2022 in Port St. John, FL 12 Less than $10,00010 $10,000 to $14,99934 $15,000 to $19,9998 $20,000 to $24,9992 $30,000 to $34,9999 $40,000 to $49,99958 $60,000 to $69,99951 $70,000 to $79,99922 $80,000 to $89,99932 $90,000 to $99,999110 $100,000 to $124,999279 $125,000 to $149,999465 $150,000 to $174,999586 $175,000 to $199,9991,696 $200,000 to $249,9991,979 $250,000 to $299,9991,541 $300,000 to $399,999190 $400,000 to $499,999135 $500,000 to $749,99945 $750,000 to $999,99976 $1,000,000 to $1,499,999Rent paid by renters in 2022 in Port St. John, FL 26 $250 to $2998 $550 to $5999 $650 to $69947 $800 to $899154 $900 to $99929 $1,000 to $1,249155 $1,250 to $1,499288 $1,500 to $1,99974 $2,000 to $2,49938 No cash rent
Percentage of workers working in this county: 85.3%Number of people working at home: 1,098 (8.6% of all workers )
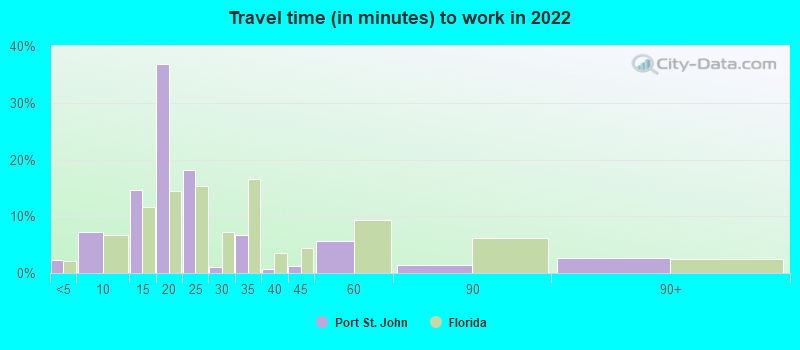
Travel time to work (commute)
Less than 5 minutes: 2005 to 9 minutes: 70910 to 14 minutes: 58515 to 19 minutes: 1,37920 to 24 minutes: 2,43425 to 29 minutes: 1,22730 to 34 minutes: 1,45035 to 39 minutes: 1,07540 to 44 minutes: 29345 to 59 minutes: 1,37360 to 89 minutes: 66790 or more minutes: 207
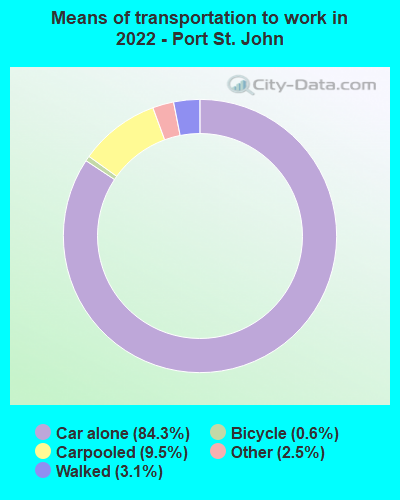
Means of transportation to work:
Drove a car alone: 1,640 (57.1%)Carpooled: 191 (6.6%)Taxi: 68 (2.4%)Bicycle: 10 (0.3%)Walked: 68 (2.4%)Worked at home: 1,098 (38.2%)
Unemployment by race in 2022
Unemployment rate for White non-Hispanic residents 4.7% Males6.2% FemalesUnemployment rate for two or more race residents 1.7% FemalesUnemployment rate for Hispanic or Latino residents 4.2% Males4.2% Females
Year of entry for the foreign-born population in Port St. John, Florida
338 2010 or later 224 2000 to 2009 87 1990 to 1999 68 1980 to 1989 92 1970 to 1979 127 Before 1970
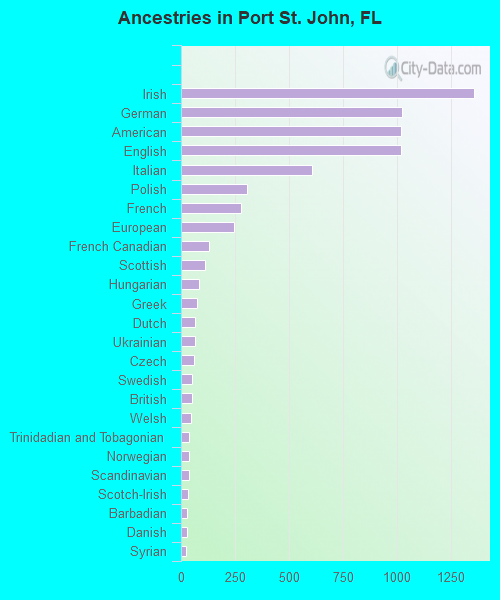
First ancestries reported:
Irish: 1,359 (13.6%)
German: 1,023 (10.2%)
American: 1,018 (10.2%)
English: 1,017 (10.2%)
Italian: 608 (6.1%)
Polish: 304 (3.0%)
French: 279 (2.8%)
European: 245 (2.5%)
French Canadian: 132 (1.3%)
Scottish: 111 (1.1%)
Hungarian: 83 (0.8%)
Greek: 75 (0.8%)
Dutch: 67 (0.7%)
Ukrainian: 64 (0.6%)
Czech: 60 (0.6%)
Swedish: 51 (0.5%)
British: 49 (0.5%)
Welsh: 47 (0.5%)
Trinidadian and Tobagonian: 39 (0.4%)
Norwegian: 38 (0.4%)
Scandinavian: 35 (0.4%)
Scotch-Irish: 33 (0.3%)
Barbadian: 29 (0.3%)
Danish: 26 (0.3%)
Syrian: 23 (0.2%)
Romanian: 20 (0.2%)
Macedonian: 16 (0.2%)
African: 16 (0.2%)
Russian: 12 (0.1%)
Belgian: 10 (0.1%)
Pennsylvania German: 8 (0.08%)
Finnish: 7 (0.07%)
Northern European: 3 (0.03%) Most common places of birth for foreign-born residents (%): El Salvador Port St. John:
22.7% (345)Florida:
1.1% (49,838)
France Port St. John:
13.4% (204)Florida:
0.4% (20,008)
Cuba Port St. John:
12.1% (183)Florida:
22.0% (1,006,576)
Trinidad and Tobago Port St. John:
7.6% (116)Florida:
1.0% (43,642)
Philippines Port St. John:
6.3% (96)Florida:
1.8% (84,403)
Mexico Port St. John:
4.9% (74)Florida:
5.6% (257,152)
Venezuela Port St. John:
4.9% (74)Florida:
5.7% (262,042)
Germany Port St. John:
4.2% (63)Florida:
1.2% (54,272)
China, excluding Hong Kong and Taiwan Port St. John:
3.4% (52)Florida:
1.2% (56,071)
Brazil Port St. John:
2.6% (39)Florida:
2.7% (122,906)
Poland Port St. John:
2.3% (35)Florida:
0.6% (25,219)
Canada Port St. John:
2.2% (33)Florida:
2.4% (109,132)
United Kingdom, excluding England and Scotland Port St. John:
2.1% (32)Florida:
0.7% (34,227)
Scotland Port St. John:
2.1% (32)Florida:
0.1% (5,920)
Place of birth for U.S.-born residents:
This state: 9,716Other state: 13,130Northeast: 5,124Midwest: 3,324South: 3,151West: 1,544 88.5% of Port St. John residents lived in the same house 1 years ago.
Out of people who lived in different houses, 36.3% lived in this county.
Out of people who lived in different counties, 18.8% lived in Florida.
Port St. John:
88.5%State average:
86.3%
Education attainment for males 25 years and older:
No schooling: 216Nursery to 4th grade: 05th and 6th grade: 07th and 8th grade: 189th grade: 5410th grade: 15711th grade: 13112th grade, no diploma: 235High school graduate (or equivalency): 2,700Less than 1 year of college: 728Some college more than 1 year, no degree: 1,790Associate degree: 1,306Bachelor's degree: 1,334Master's degree: 450Professional school degree: 21Doctorate degree: 89
Education attainment for females 25 years and older:
No schooling: 68Nursery to 4th grade: 05th and 6th grade: 07th and 8th grade: 219th grade: 4410th grade: 5011th grade: 8312th grade, no diploma: 196High school graduate (or equivalency): 2,558Less than 1 year of college: 892Some college more than 1 year, no degree: 1,652Associate degree: 1,057Bachelor's degree: 1,622Master's degree: 915Professional school degree: 71Doctorate degree: 57
Housing units in structures:
One, detached: 9,957One, attached: 533 or 4: 1205 to 9: 21010 to 19: 9020 to 49: 3350 or more: 20Mobile homes: 44Housing units lacking complete plumbing facilities in 2022: 0.3%Housing units lacking complete kitchen facilities in 2022: 0.2%House/condo owner moved in on average 14 years ago
Renter moved in on average 2 years ago
Private vs. public school enrollment:
Students in private schools in grades 1 to 8 (elementary and middle school): 259 Students in private schools in grades 9 to 12 (high school): 214 Students in private undergraduate colleges: 32