Port Charlotte, FL (Florida) Houses and Residents
| Port Charlotte: | $271,400 |
| Florida: | $354,100 |
Mean price in 2022:
Detached houses: $381,696
Here: $381,696 State: $500,941 Townhouses or other attached units: $1,029,103
Here: $1,029,103 State: $370,869 In 3-to-4-unit structures: $176,126
Here: $176,126 State: $309,944 In 5-or-more-unit structures: $132,259
Here: $132,259 State: $447,145 Mobile homes: $175,845
Here: $175,845 State: $113,202
Total population: 54,392 (Urban population: 46,406, Rural population: 63 (all nonfarm))
Houses: 31,930 (26,788 occupied: 22,301 owner occupied, 4,487 renter occupied)
| % of renters here: | 17% |
| State: | 33% |
Housing density: 1,434 houses/condos per square mile
Median price asked for vacant for-sale houses and condos in 2022: $196,444.
Median contract rent in 2022: $1,260 (lower quartile is $877, upper quartile is $1,665)
Median rent asked for vacant for-rent units in 2022: $1,576
Median gross rent in Port Charlotte, FL in 2022: $1,476
Housing units in Port Charlotte with a mortgage: 12,746 (1,224 second mortgage, 0 home equity loan, 1,116 both second mortgage and home equity loan)
Houses without a mortgage: 420
Median household income for houses/condos with a mortgage: $70,441
Median household income for apartments without a mortgage: $56,506
Median monthly housing costs: $1,097
Compare current foreclosures in Port Charlotte, FL:
| Photo | Address | Area | Beds / Baths | Price | Details |
|---|---|---|---|---|---|

|
#1
W Tarpon Blvd NW
Port Charlotte, FL 33952
|
1,167 sq. feet
|
2 baths 3 beds |
$460,000
|
show details |

|
#2
Foote Ave
Port Charlotte, FL 33952
|
1,316 sq. feet
|
2 baths 3 beds |
$190,000
|
show details |

|
#3
Morristown Ave
Port Charlotte, FL 33981
|
2,238 sq. feet
|
2 baths 4 beds |
show details | |

|
#4
Dowling Ave NE
Port Charlotte, FL 33952
|
2,300 sq. feet
|
3 baths 5 beds |
show details | |

|
#5
Coulton Ave
Port Charlotte, FL 33952
|
1,824 sq. feet
|
2 baths 4 beds |
show details | |

|
#6
River Bank Way
Port Charlotte, FL 33980
|
2,408 sq. feet
|
3 baths 4 beds |
show details | |

|
#7
Guild St
Port Charlotte, FL 33952
|
1,032 sq. feet
|
2 baths 3 beds |
show details | |

|
#8
Beverly Ave
Port Charlotte, FL 33952
|
888 sq. feet
|
1 baths 2 beds |
show details | |

|
#9
Baffin Ave
Port Charlotte, FL 33954
|
936 sq. feet
|
2 baths 3 beds |
show details | |

|
#10
Dalton Blvd
Port Charlotte, FL 33952
|
1,237 sq. feet
|
1 baths 2 beds |
show details |
| Photo | Address | Area | Beds / Baths | Price | Details |
|---|---|---|---|---|---|

|
#11
Chard Ter
Port Charlotte, FL 33981
|
1,370 sq. feet
|
2 baths 2 beds |
show details | |
|
|
#12
Jamestown St
Port Charlotte, FL 33952
|
1,519 sq. feet
|
2 baths 2 beds |
show details | |

|
#13
Richards Ave
Port Charlotte, FL 33981
|
1,564 sq. feet
|
2 baths 3 beds |
show details | |

|
#14
Congress St
Port Charlotte, FL 33952
|
925 sq. feet
|
2 baths 3 beds |
show details | |

|
#15
Forrest Nelson Blvd # B#b2
Port Charlotte, FL 33952
|
1,218 sq. feet
|
2 baths 2 beds |
show details | |

|
#16
Darden St
Port Charlotte, FL 33981
|
1,283 sq. feet
|
2 baths 3 beds |
show details | |

|
#17
Sun Vista Pl
Port Charlotte, FL 33980
|
2,072 sq. feet
|
2 baths 3 beds |
show details | |

|
#18
Xita Ave
Port Charlotte, FL 33952
|
1,681 sq. feet
|
2 baths 3 beds |
show details | |

|
#19
Norwood St NW
Port Charlotte, FL 33952
|
1,567 sq. feet
|
2 baths 3 beds |
show details | |

|
#20
Maracaibo St
Port Charlotte, FL 33980
|
3,449 sq. feet
|
4 baths 4 beds |
show details |
| Photo | Address | Area | Beds / Baths | Price | Details |
|---|---|---|---|---|---|

|
#21
Riverton Cir
Port Charlotte, FL 33981
|
1,452 sq. feet
|
2 baths 3 beds |
show details | |

|
#22
Verona St
Port Charlotte, FL 33948
|
1,774 sq. feet
|
2 baths 3 beds |
show details | |

|
#23
Thorman Rd
Port Charlotte, FL 33981
|
1,360 sq. feet
|
2 baths 3 beds |
show details | |

|
#24
Beacon Dr
Port Charlotte, FL 33952
|
1,643 sq. feet
|
2 baths 3 beds |
show details | |

|
#25
Melody Cir
Port Charlotte, FL 33981
|
2,858 sq. feet
|
3 baths 3 beds |
show details | |

|
#26
David Blvd
Port Charlotte, FL 33981
|
1,902 sq. feet
|
2 baths 3 beds |
show details | |

|
#27
Forrest Nelson Blvd Apt C8
Port Charlotte, FL 33952
|
- sq. feet
|
2 baths 2 beds |
show details | |

|
#28
Riverfront Dr
Port Charlotte, FL 33980
|
3,322 sq. feet
|
4 baths 5 beds |
show details | |

|
#29
Lockport Ave
Port Charlotte, FL 33952
|
1,689 sq. feet
|
2 baths 3 beds |
show details | |

|
#30
Loveland Blvd Unit 504
Port Charlotte, FL 33980
|
1,044 sq. feet
|
2 baths 2 beds |
show details |
| Photo | Address | Area | Beds / Baths | Price | Details |
|---|---|---|---|---|---|

|
#31
Atlas St
Port Charlotte, FL 33952
|
1,204 sq. feet
|
2 baths 2 beds |
show details | |

|
#32
Broad Ranch Dr
Port Charlotte, FL 33948
|
952 sq. feet
|
2 baths 3 beds |
show details | |

|
#33
Pellam Blvd
Port Charlotte, FL 33948
|
1,421 sq. feet
|
2 baths 2 beds |
show details | |

|
#34
Beeney Rd SE
Port Charlotte, FL 33952
|
1,936 sq. feet
|
3 baths 4 beds |
show details | |

|
#35
Conreid Dr NE
Port Charlotte, FL 33952
|
1,748 sq. feet
|
2 baths 3 beds |
show details | |

|
#36
Gillot Blvd
Port Charlotte, FL 33981
|
1,290 sq. feet
|
2 baths 2 beds |
show details | |

|
#37
Ranger Ave
Port Charlotte, FL 33954
|
2,493 sq. feet
|
2 baths 4 beds |
show details | |

|
#38
Beacon Dr
Port Charlotte, FL 33952
|
1,278 sq. feet
|
2 baths 2 beds |
show details | |

|
#39
Hartley Ave
Port Charlotte, FL 33954
|
2,174 sq. feet
|
2 baths 3 beds |
show details | |

|
#40
Banana St
Port Charlotte, FL 33980
|
1,235 sq. feet
|
1 baths 3 beds |
show details |
| Photo | Address | Area | Beds / Baths | Price | Details |
|---|---|---|---|---|---|

|
#41
Sunrise Trl
Port Charlotte, FL 33952
|
1,908 sq. feet
|
2 baths 3 beds |
show details | |

|
#42
Romford Ave
Port Charlotte, FL 33981
|
919 sq. feet
|
2 baths 2 beds |
show details | |

|
#43
Catherine Ave
Port Charlotte, FL 33952
|
1,075 sq. feet
|
2 baths 2 beds |
show details | |

|
#44
Beacon Dr
Port Charlotte, FL 33952
|
1,148 sq. feet
|
2 baths 2 beds |
show details | |

|
#45
Mccandless Ave
Port Charlotte, FL 33980
|
1,694 sq. feet
|
2 baths 3 beds |
show details | |

|
#46
Yarmouth St
Port Charlotte, FL 33952
|
878 sq. feet
|
2 baths 2 beds |
show details | |

|
#47
Lambert St
Port Charlotte, FL 33948
|
1,333 sq. feet
|
2 baths 3 beds |
show details | |

|
#48
La Playa Ln
Port Charlotte, FL 33953
|
2,035 sq. feet
|
2 baths 3 beds |
show details | |

|
#49
Webster Ave NW
Port Charlotte, FL 33948
|
1,421 sq. feet
|
1 baths 2 beds |
show details | |

|
Check over 1 million property listings on Foreclosure.com!
|
browse all offers | |||


 | Any Recommendations on Affordable Condos/Apartments for Rent? (2 replies) |
| Port Charlotte Condos - Pros and Cons (7 replies) |
| Average Home Taxes In Port Charlotte (15 replies) |
| Apartments that are NOT low income housing?? (12 replies) |
| So what's the catch with Port Charlotte Canal Homes? (17 replies) |
| Port Charlotte or Punta Gorda? (3 replies) |

Median year apartment built: 1984
Household type by relationship:
Households: 69,625- Male householders: 12,626 (2,833 living alone), Female householders: 14,162 (3,634 living alone)
13,020 spouses (12,953 opposite-sex spouses), 2,377 unmarried partners, (2,309 opposite-sex unmarried partners), 18,965 children (16,964 natural, 1,266 adopted, 735 stepchildren), 2,286 grandchildren, 767 brothers or sisters, 1,049 parents, 0 foster children, 1,711 other relatives, 1,861 non-relatives
- In group quarters: 801
Size of family households: 8,054 2-persons, 5,537 3-persons, 2,846 4-persons, 704 5-persons, 603 6-persons, 339 7-or-more-persons.
Size of nonfamily households: 6,467 1-person, 2,084 2-persons, 154 3-persons.
5,911 married couples with children.
3,290 single-parent households (1,119 men, 2,171 women).
85.1% of residents of Port Charlotte speak English at home.
9.2% of residents speak Spanish at home (63% speak English very well, 21% speak English well, 12% speak English not well, 4% don't speak English at all).
3.7% of residents speak other Indo-European language at home (72% speak English very well, 13% speak English well, 14% speak English not well, 1% don't speak English at all).
1.3% of residents speak Asian or Pacific Island language at home (77% speak English very well, 17% speak English well, 5% speak English not well).
0.8% of residents speak other language at home (73% speak English very well, 21% speak English well, 6% speak English not well).
Foreign born population: 8,786 (12.6%)
(74.0% of them are naturalized citizens)
| Here: | 5.6 |
| State: | 5.9 |
| Here: | 5.1 |
| State: | 4.2 |

- Bedrooms in owner-occupied houses and condos in Port Charlotte, Florida
- 153no bedroom
- 4981 bedroom
- 7,6772 bedrooms
- 10,6043 bedrooms
- 3,2994 bedrooms
- 705+ bedrooms

- Bedrooms in renter-occupied apartments in Port Charlotte, Florida
- 82no bedroom
- 3941 bedroom
- 1,2372 bedrooms
- 2,7213 bedrooms
- 534 bedrooms
- 05+ bedrooms

- Cars and other vehicles available in Port Charlotte in owner-occupied houses/condos
- 833no vehicle
- 7,1131 vehicle
- 9,9022 vehicles
- 3,4643 vehicles
- 8854 vehicles
- 1045+ vehicles

- Cars and other vehicles available in Port Charlotte in renter-occupied apartments
- 192no vehicle
- 1,8511 vehicle
- 1,6192 vehicles
- 7723 vehicles
- 534 vehicles
- 05+ vehicles

- Rooms in owner-occupied houses in Port Charlotte, Florida
- 1531 room
- 02 rooms
- 6133 rooms
- 3,8024 rooms
- 5,9605 rooms
- 5,3326 rooms
- 2,3087 rooms
- 2,4508 rooms
- 1,6839+ rooms

- Rooms in renter-occupied apartments in Port Charlotte, Florida
- 821 room
- 1332 rooms
- 5113 rooms
- 8184 rooms
- 1,2135 rooms
- 1,0736 rooms
- 2077 rooms
- 4028 rooms
- 489+ rooms


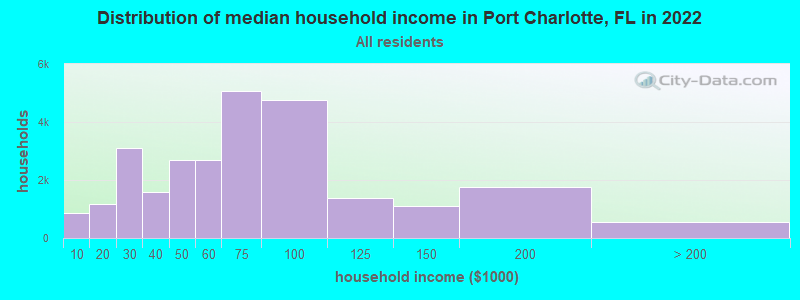
Port Charlotte, FL household income distribution

- 878Less than $10,000
- 1,170$10,000 to $19,999
- 3,119$20,000 to $29,999
- 1,592$30,000 to $39,999
- 2,689$40,000 to $49,999
- 2,681$50,000 to $59,999
- 5,085$60,000 to $74,999
- 4,774$75,000 to $99,999
- 1,392$100,000 to $124,999
- 1,097$125,000 to $149,999
- 1,768$150,000 to $199,999
- 543$200,000 or more
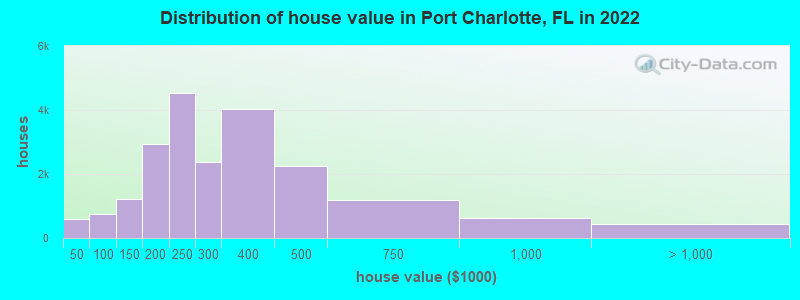
Home value of owner - occupied houses in 2022 in Port Charlotte, FL
-
- 121Less than $10,000
- 96$10,000 to $14,999
- 66$15,000 to $19,999
- 76$20,000 to $24,999
- 18$25,000 to $29,999
- 34$30,000 to $34,999
- 69$35,000 to $39,999
- 112$40,000 to $49,999
- 64$50,000 to $59,999
- 151$60,000 to $69,999
- 86$70,000 to $79,999
- 167$80,000 to $89,999
- 174$90,000 to $99,999
- 647$100,000 to $124,999
- 572$125,000 to $149,999
- 1,038$150,000 to $174,999
- 1,885$175,000 to $199,999
- 4,516$200,000 to $249,999
- 2,364$250,000 to $299,999
- 4,035$300,000 to $399,999
- 2,260$400,000 to $499,999
- 1,203$500,000 to $749,999
- 629$750,000 to $999,999
- 130$1,000,000 to $1,499,999
- 98$1,500,000 to $1,999,999
- 198$2,000,000 or more
Rent paid by renters in 2022 in Port Charlotte, FL
-
- 133$200 to $249
- 31$250 to $299
- 40$300 to $349
- 107$350 to $399
- 126$400 to $449
- 108$500 to $549
- 85$550 to $599
- 140$600 to $649
- 40$650 to $699
- 247$700 to $749
- 126$750 to $799
- 441$800 to $899
- 437$900 to $999
- 920$1,000 to $1,249
- 598$1,250 to $1,499
- 665$1,500 to $1,999
- 203$2,000 to $2,499
- 210$3,000 to $3,499
- 296No cash rent


Percentage of workers working in this county: 74.7%
Number of people working at home: 4,269 (16.5% of all workers)
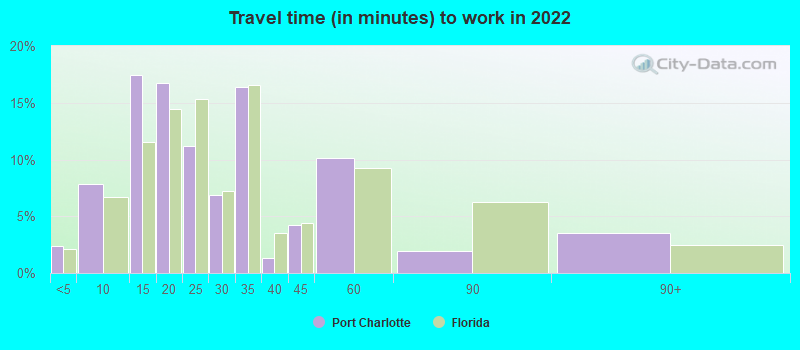
Travel time to work (commute)
- Less than 5 minutes: 684
- 5 to 9 minutes: 1,628
- 10 to 14 minutes: 4,930
- 15 to 19 minutes: 4,536
- 20 to 24 minutes: 4,218
- 25 to 29 minutes: 445
- 30 to 34 minutes: 3,258
- 35 to 39 minutes: 379
- 40 to 44 minutes: 1,160
- 45 to 59 minutes: 1,932
- 60 to 89 minutes: 1,012
- 90 or more minutes: 458
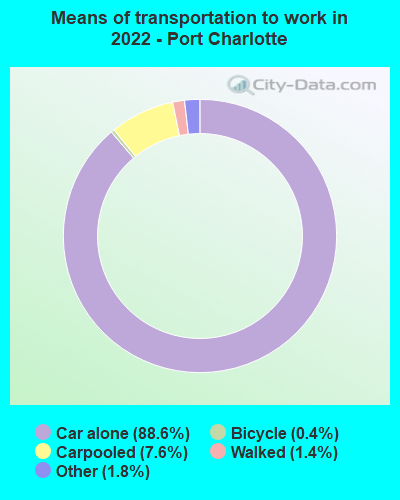
Means of transportation to work:
- Drove a car alone: 15,890 (71.6%)
- Carpooled: 1,450 (6.5%)
- Bus: 11 (0.0%)
- Ferryboat: 14 (0.1%)
- Taxi: 368 (1.7%)
- Bicycle: 66 (0.3%)
- Walked: 270 (1.2%)
- Worked at home: 4,269 (19.2%)

- Unemployment by race in 2022
- Unemployment rate for White non-Hispanic residents
- 4.0%Males
- 7.1%Females
- Unemployment rate for Black residents
- 8.6%Males
- 5.3%Females
- Unemployment rate for Asian residents
- 2.7%Females
- Unemployment rate for two or more race residents
- 2.9%Males
- 4.5%Females
- Unemployment rate for Hispanic or Latino residents
- 1.0%Males
- 6.7%Females

- Year of entry for the foreign-born population in Port Charlotte, Florida
- 1,9772010 or later
- 1,5672000 to 2009
- 1,1891990 to 1999
- 9111980 to 1989
- 7451970 to 1979
- 1,957Before 1970

First ancestries reported:
- American: 6,863 (20.2%)
- English: 3,821 (11.3%)
- German: 3,382 (10.0%)
- Italian: 2,662 (7.8%)
- Irish: 2,054 (6.0%)
- Jamaican: 1,007 (3.0%)
- Haitian: 827 (2.4%)
- Polish: 760 (2.2%)
- European: 660 (1.9%)
- West Indian: 422 (1.2%)
- Scottish: 358 (1.1%)
- Russian: 353 (1.0%)
- Dutch: 318 (0.9%)
- Scotch-Irish: 287 (0.8%)
- French Canadian: 282 (0.8%)
- French: 251 (0.7%)
- Guyanese: 250 (0.7%)
- Swedish: 184 (0.5%)
- Norwegian: 168 (0.5%)
- Czech: 166 (0.5%)
- British: 158 (0.5%)
- Canadian: 156 (0.5%)
- Cape Verdean: 141 (0.4%)
- Hungarian: 113 (0.3%)
- Palestinian: 106 (0.3%)
- Portuguese: 103 (0.3%)
- Greek: 101 (0.3%)
- Slovak: 81 (0.2%)
- Eastern European: 78 (0.2%)
- Latvian: 74 (0.2%)
- Iranian: 69 (0.2%)
- Welsh: 63 (0.2%)
- Barbadian: 63 (0.2%)
- Northern European: 62 (0.2%)
- Trinidadian and Tobagonian: 59 (0.2%)
- Belgian: 57 (0.2%)
- Scandinavian: 55 (0.2%)
- Serbian: 50 (0.1%)
- Danish: 49 (0.1%)
- Ukrainian: 49 (0.1%)
- Estonian: 40 (0.1%)
- Finnish: 39 (0.1%)
- Australian: 35 (0.1%)
- Maltese: 33 (0.10%)
- Czechoslovakian: 33 (0.10%)
- Nigerian: 32 (0.09%)
- Swiss: 31 (0.09%)
- Lithuanian: 27 (0.08%)
- Austrian: 22 (0.06%)
- Slovene: 15 (0.04%)
- British West Indian: 14 (0.04%)
- Lebanese: 11 (0.03%)
- Slavic: 6 (0.02%)
- Brazilian: 3 (0.01%)
Most common places of birth for foreign-born residents (%):
| Port Charlotte: | 13.1% (1,083) |
| Florida: | 5.0% (227,319) |
| Port Charlotte: | 11.6% (966) |
| Florida: | 7.5% (342,375) |
| Port Charlotte: | 8.2% (677) |
| Florida: | 22.0% (1,006,576) |
| Port Charlotte: | 6.3% (525) |
| Florida: | 3.0% (137,727) |
| Port Charlotte: | 5.3% (441) |
| Florida: | 5.6% (257,152) |
| Port Charlotte: | 4.7% (389) |
| Florida: | 2.4% (109,132) |
| Port Charlotte: | 4.5% (370) |
| Florida: | 1.8% (84,403) |
| Port Charlotte: | 4.1% (344) |
| Florida: | 5.7% (262,042) |
| Port Charlotte: | 3.7% (308) |
| Florida: | 0.7% (33,556) |
| Port Charlotte: | 3.4% (281) |
| Florida: | 1.1% (49,838) |
| Port Charlotte: | 2.5% (208) |
| Florida: | 2.1% (96,693) |
| Port Charlotte: | 2.4% (197) |
| Florida: | 0.7% (34,227) |
| Port Charlotte: | 2.3% (192) |
| Florida: | 1.2% (54,272) |
| Port Charlotte: | 2.3% (189) |
| Florida: | 0.8% (37,723) |
| Port Charlotte: | 2.2% (182) |
| Florida: | 1.3% (60,604) |
| Port Charlotte: | 2.0% (168) |
| Florida: | 0.5% (21,886) |
| Port Charlotte: | 2.0% (167) |
| Florida: | 0.7% (30,755) |
| Port Charlotte: | 1.8% (150) |
| Florida: | 0.7% (31,076) |
Place of birth for U.S.-born residents:
- This state: 17,176
- Other state: 41,722
- Northeast: 18,899
- Midwest: 14,314
- South: 6,149
- West: 2,360
86.5% of Port Charlotte residents lived in the same house 1 years ago.
Out of people who lived in different houses, 15.2% lived in this county.
Out of people who lived in different counties, 33.7% lived in Florida.
| Port Charlotte: | 86.5% |
| State average: | 86.3% |
Education attainment for males 25 years and older:
- No schooling: 165
- Nursery to 4th grade: 0
- 5th and 6th grade: 0
- 7th and 8th grade: 65
- 9th grade: 18
- 10th grade: 234
- 11th grade: 0
- 12th grade, no diploma: 742
- High school graduate (or equivalency): 10,234
- Less than 1 year of college: 2,377
- Some college more than 1 year, no degree: 3,642
- Associate degree: 2,828
- Bachelor's degree: 3,199
- Master's degree: 461
- Professional school degree: 246
- Doctorate degree: 481

Education attainment for females 25 years and older:
- No schooling: 128
- Nursery to 4th grade: 622
- 5th and 6th grade: 0
- 7th and 8th grade: 85
- 9th grade: 0
- 10th grade: 495
- 11th grade: 326
- 12th grade, no diploma: 550
- High school graduate (or equivalency): 10,050
- Less than 1 year of college: 2,369
- Some college more than 1 year, no degree: 5,243
- Associate degree: 2,324
- Bachelor's degree: 4,405
- Master's degree: 1,873
- Professional school degree: 143
- Doctorate degree: 84


Housing units in structures:
- One, detached: 27,381
- One, attached: 1,027
- 3 or 4: 436
- 5 to 9: 583
- 10 to 19: 426
- 20 to 49: 915
- 50 or more: 755
- Mobile homes: 407
Housing units lacking complete kitchen facilities in 2022: 1.1%
House/condo owner moved in on average 9 years ago
Renter moved in on average 2 years ago

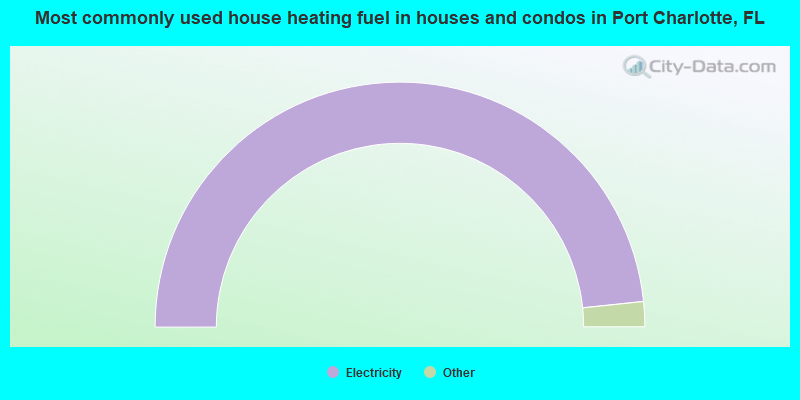
- 96.7%Electricity
- 1.6%Utility gas
- 1.0%No fuel used
- 0.3%Bottled, tank, or LP gas
- 0.3%Solar energy
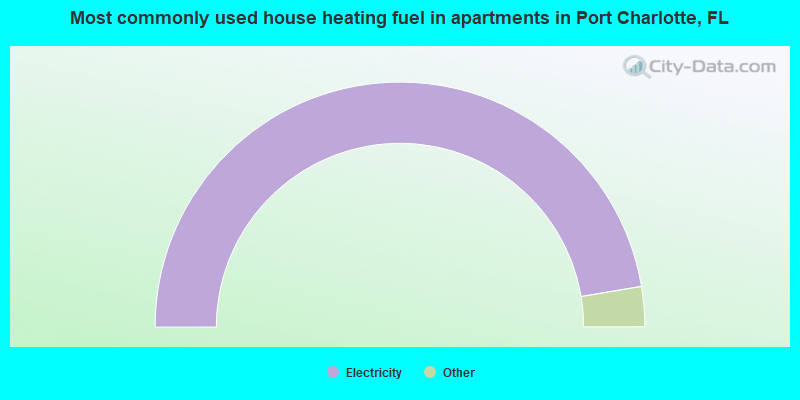
- 94.8%Electricity
- 2.9%Utility gas
- 2.3%No fuel used
Private vs. public school enrollment:
| Here: | 14.4% |
| Florida: | 15.8% |
| Here: | 13.2% |
| Florida: | 12.9% |
| Here: | 32.0% |
| Florida: | 23.6% |


