Point Pleasant, NJ (New Jersey) Houses and Residents
Estimated median house or condo value in 2022: $525,085 (it was $159,800 in 2000 )
Point Pleasant:
$525,085New Jersey:
$428,900
Lower value quartile - upper value quartile: $431,640 - $763,508Mean price in 2022: Detached houses: $532,551 Here:
$532,551State:
$537,591
Townhouses or other attached units: $820,076 Here:
$820,076State:
$381,113
In 2-unit structures: $1,071,985 Here:
$1,071,985State:
$444,476
In 5-or-more-unit structures: $695,200 Here:
$695,200State:
$368,745
Total population: 18,665 (All urban)
Houses: 8,428 (7,819 occupied: 6,352 owner occupied, 1,502 renter occupied )
% of renters here:
19%State:
35%
Housing density: 2,384 houses/condos per square mile
Median price asked for vacant for-sale houses and condos in 2022: $399,370.
Median contract rent in 2022: $1,708 (lower quartile is $1,350, upper quartile is over $2,000)
Median rent asked for vacant for-rent units in 2022: $2,503
Median gross rent in Point Pleasant, NJ in 2022: $1,869
Housing units in Point Pleasant with a mortgage: 4,502 (539 second mortgage, 13 home equity loan, 494 both second mortgage and home equity loan )Houses without a mortgage: 236
Median household income for houses/condos with a mortgage: $127,786
Median household income for apartments without a mortgage: $105,108
Median monthly housing costs: $2,019
Data:
Median house or condo value ($)
Median house or condo value ($ change since 2000)
Median house or condo value ($) - White
Median house or condo value ($) - Black or African American
Median house or condo value ($) - Asian
Median house or condo value ($) - Hispanic or Latino
Median house or condo value ($) - American Indian and Alaska Native
Median house or condo value ($) - Multirace
Median house or condo value ($) - Other Race
Median price asked for mobile homes ($)
Household density (households per square mile)
Mean house or condo value by units in structure - 1, detached ($)
Mean house or condo value by units in structure - 1, attached ($)
Mean house or condo value by units in structure - 2 ($)
Mean house or condo value by units in structure by units in structure - 3 or 4 ($)
Mean house or condo value by units in structure - 5 or more ($)
Mean house or condo value by units in structure - Boat, RV, van, etc. ($)
Mean house or condo value by units in structure - Mobile home ($)
Median contract rent ($)
Median contract rent - Lower quartile ($)
Median contract rent - Upper quartile ($)
Median gross rent ($)
Urban houses (%)
Rural houses (%)
Houses occupied (%)
Houses occupied (% change since 2000)
Houses owner occupied (%)
Houses owner occupied (% change since 2000)
Houses renter occupied (%)
Houses renter occupied (% change since 2000)
Vacant housing units - For rent (%)
Vacant housing units - For rent (% change since 2000)
Vacant housing units - For sale only (%)
Vacant housing units - For sale only (% change since 2000)
Vacant housing units - Rented or sold, not occupied (%)
Vacant housing units - Rented or sold, not occupied (% change since 2000)
Vacant housing units - For seasonal, recreational, or occasional use (%)
Vacant housing units - For seasonal, recreational, or occasional use (% change since 2000)
Vacant housing units - For migrant workers (%)
Vacant housing units - For migrant workers (% change since 2000)
Vacant housing units - Other vacant (%)
Vacant housing units - Other vacant (% change since 2000)
Median monthly housing costs ($)
Median household income for houses/condos with a mortgage ($)
Median household income for houses/condos without a mortgage ($)
Median household income ($)
Median household income ($) - White
Median household income ($) - Black or African American
Median household income ($) - Asian
Median household income ($) - Hispanic or Latino
Median household income ($) - American Indian and Alaska Native
Median household income ($) - Multirace
Median household income ($) - Other Race
Mortgage status - with mortgage (%)
Mortgage status - with second mortgage (%)
Mortgage status - with home equity loan (%)
Mortgage status - with both second mortgage and home equity loan (%)
Mortgage status - without a mortgage (%)
Median year house/condo built
Median year apartment built
Household type by relationship - Male householder living alone (%)
Household type by relationship - Male householder not living alone (%)
Household type by relationship - Female householder living alone (%)
Household type by relationship - Female householder not living alone (%)
Household type by relationship - Opposite-Sex spouse (%)
Household type by relationship - Same-Sex spouse (%)
Household type by relationship - Opposite-Sex unmarried partner (%)
Household type by relationship - Same-Sex unmarried partner (%)
Household type by relationship - In group quarters (%)
Size of family households - 2-person household (%)
Size of family households - 3-person household (%)
Size of family households - 4-person household (%)
Size of family households - 5-person household (%)
Size of family households - 6-person household (%)
Size of family households - 7-or-more-person household (%)
Size of nonfamily households - 1-person household (%)
Size of nonfamily households - 2-person household (%)
Size of nonfamily households - 3-person household (%)
Size of nonfamily households - 4-person household (%)
Size of nonfamily households - 5-person household (%)
Size of nonfamily households - 6-person household (%)
Size of nonfamily households - 7-or-moreperson household (%)
Year house built - Built 2010 or later (%)
Year house built - Built 2000 to 2009 (%)
Year house built - Built 1990 to 1999 (%)
Year house built - Built 1980 to 1989 (%)
Year house built - Built 1970 to 1979 (%)
Year house built - Built 1960 to 1969 (%)
Year house built - Built 1950 to 1959 (%)
Year house built - Built 1940 to 1949 (%)
Year house built - Built 1939 or earlier (%)
Median number of rooms in houses and condos
Median number of rooms in apartments
Median number of bedrooms in owner occupied houses
Mean number of bedrooms in owner occupied houses
Median number of bedrooms in renter occupied houses
Mean number of bedrooms in renter occupied houses
Median number of vehichles in owner occupied houses
Mean number of vehichles in owner occupied houses
Median number of vehichles in renter occupied houses
Mean number of vehichles in renter occupied houses
Rooms in owner-occupied houses - 1 room (%)
Rooms in owner-occupied houses - 2 rooms (%)
Rooms in owner-occupied houses - 3 rooms (%)
Rooms in owner-occupied houses - 4 rooms (%)
Rooms in owner-occupied houses - 5 rooms (%)
Rooms in owner-occupied houses - 6 rooms (%)
Rooms in owner-occupied houses - 7 rooms (%)
Rooms in owner-occupied houses - 8 rooms (%)
Rooms in owner-occupied houses - 9+ rooms (%)
Rooms in renter-occupied houses - 1 room (%)
Rooms in renter-occupied houses - 2 rooms (%)
Rooms in renter-occupied houses - 3 rooms (%)
Rooms in renter-occupied houses - 4 rooms (%)
Rooms in renter-occupied houses - 5 rooms (%)
Rooms in renter-occupied houses - 6 rooms (%)
Rooms in renter-occupied houses - 7 rooms (%)
Rooms in renter-occupied houses - 8 rooms (%)
Rooms in renter-occupied houses - 9+ rooms (%)
Bedrooms in owner-occupied houses - no bedrooms (%)
Bedrooms in owner-occupied houses - 1 bedroom (%)
Bedrooms in owner-occupied houses - 2 bedrooms (%)
Bedrooms in owner-occupied houses - 3 bedrooms (%)
Bedrooms in owner-occupied houses - 4 bedrooms (%)
Bedrooms in owner-occupied houses - 5+ bedrooms (%)
Bedrooms in renter-occupied houses - no bedrooms (%)
Bedrooms in renter-occupied houses - 1 bedroom (%)
Bedrooms in renter-occupied houses - 2 bedrooms (%)
Bedrooms in renter-occupied houses - 3 bedrooms (%)
Bedrooms in renter-occupied houses - 4 bedrooms (%)
Bedrooms in renter-occupied houses - 5+ bedrooms (%)
Vehicles available in owner-occupied houses - no vehicle available (%)
Vehicles available in owner-occupied houses - 1 vehicle available(%)
Vehicles available in owner-occupied houses - 2 Vehicles available (%)
Vehicles available in owner-occupied houses - 3 Vehicles available (%)
Vehicles available in owner-occupied houses - 4 Vehicles available (%)
Vehicles available in owner-occupied houses - 5+ Vehicles available (%)
Vehicles available in renter-occupied houses - no vehicle available (%)
Vehicles available in renter-occupied houses - 1 vehicle available (%)
Vehicles available in renter-occupied houses - 2 Vehicles available (%)
Vehicles available in renter-occupied houses - 3 Vehicles available (%)
Vehicles available in renter-occupied houses - 4 Vehicles available (%)
Vehicles available in renter-occupied houses - 5+ Vehicles available (%)
Housing units in structures - 1, detached (%)
Housing units in structures - 1, attached (%)
Housing units in structures - 2 (%)
Housing units in structures - 3 or 4 (%)
Housing units in structures - 5 to 9 (%)
Housing units in structures - 10 to 19 (%)
Housing units in structures - 20 to 49 (%)
Housing units in structures - 50 or more (%)
Housing units in structures - Mobile home (%)
Housing units in structures - Boat, RV, van, etc. (%)
Housing units in structures - Owners - 1, detached (%)
Housing units in structures - Owners - 1, attached (%)
Housing units in structures - Owners - 2 (%)
Housing units in structures - Owners - 3 or 4 (%)
Housing units in structures - Owners - 5 to 9 (%)
Housing units in structures - Owners - 10 to 19 (%)
Housing units in structures - Owners - 20 to 49 (%)
Housing units in structures - Owners - 50 or more (%)
Housing units in structures - Owners - Mobile home (%)
Housing units in structures - Owners - Boat, RV, van, etc. (%)
Housing units in structures - Renters - 1, detached (%)
Housing units in structures - Renters - 1, attached (%)
Housing units in structures - Renters - 2 (%)
Housing units in structures - Renters - 3 or 4 (%)
Housing units in structures - Renters - 5 to 9 (%)
Housing units in structures - Renters - 10 to 19 (%)
Housing units in structures - Renters - 20 to 49 (%)
Housing units in structures - Renters - 50 or more (%)
Housing units in structures - Renters - Mobile home (%)
Housing units in structures - Renters - Boat, RV, van, etc. (%)
House/condo owner moved in on average (years ago)
Renter moved in on average (years ago)
Year householder moved into unit - Moved in 1999 to March 2000 (%)
Year householder moved into unit - Moved in 1999 to March 2000 (%) - White
Year householder moved into unit - Moved in 1999 to March 2000 (%) - Black or African American
Year householder moved into unit - Moved in 1999 to March 2000 (%) - Asian
Year householder moved into unit - Moved in 1999 to March 2000 (%) - Hispanic or Latino
Year householder moved into unit - Moved in 1999 to March 2000 (%) - American Indian and Alaska Native
Year householder moved into unit - Moved in 1999 to March 2000 (%) - Multirace
Year householder moved into unit - Moved in 1999 to March 2000 (%) - Other Race
Year householder moved into unit - Moved in 1995 to 1998 (%)
Year householder moved into unit - Moved in 1995 to 1998 (%) - White
Year householder moved into unit - Moved in 1995 to 1998 (%) - Black or African American
Year householder moved into unit - Moved in 1995 to 1998 (%) - Asian
Year householder moved into unit - Moved in 1995 to 1998 (%) - Hispanic or Latino
Year householder moved into unit - Moved in 1995 to 1998 (%) - American Indian and Alaska Native
Year householder moved into unit - Moved in 1995 to 1998 (%) - Multirace
Year householder moved into unit - Moved in 1995 to 1998 (%) - Other Race
Year householder moved into unit - Moved in 1990 to 1994 (%)
Year householder moved into unit - Moved in 1990 to 1994 (%) - White
Year householder moved into unit - Moved in 1990 to 1994 (%) - Black or African American
Year householder moved into unit - Moved in 1990 to 1994 (%) - Asian
Year householder moved into unit - Moved in 1990 to 1994 (%) - Hispanic or Latino
Year householder moved into unit - Moved in 1990 to 1994 (%) - American Indian and Alaska Native
Year householder moved into unit - Moved in 1990 to 1994 (%) - Multirace
Year householder moved into unit - Moved in 1990 to 1994 (%) - Other Race
Year householder moved into unit - Moved in 1980 to 1989 (%)
Year householder moved into unit - Moved in 1980 to 1989 (%) - White
Year householder moved into unit - Moved in 1980 to 1989 (%) - Black or African American
Year householder moved into unit - Moved in 1980 to 1989 (%) - Asian
Year householder moved into unit - Moved in 1980 to 1989 (%) - Hispanic or Latino
Year householder moved into unit - Moved in 1980 to 1989 (%) - American Indian and Alaska Native
Year householder moved into unit - Moved in 1980 to 1989 (%) - Multirace
Year householder moved into unit - Moved in 1980 to 1989 (%) - Other Race
Year householder moved into unit - Moved in 1970 to 1979 (%)
Year householder moved into unit - Moved in 1970 to 1979 (%) - White
Year householder moved into unit - Moved in 1970 to 1979 (%) - Black or African American
Year householder moved into unit - Moved in 1970 to 1979 (%) - Asian
Year householder moved into unit - Moved in 1970 to 1979 (%) - Hispanic or Latino
Year householder moved into unit - Moved in 1970 to 1979 (%) - American Indian and Alaska Native
Year householder moved into unit - Moved in 1970 to 1979 (%) - Multirace
Year householder moved into unit - Moved in 1970 to 1979 (%) - Other Race
Year householder moved into unit - Moved in 1969 or earlier (%)
Year householder moved into unit - Moved in 1969 or earlier (%) - White
Year householder moved into unit - Moved in 1969 or earlier (%) - Black or African American
Year householder moved into unit - Moved in 1969 or earlier (%) - Asian
Year householder moved into unit - Moved in 1969 or earlier (%) - Hispanic or Latino
Year householder moved into unit - Moved in 1969 or earlier (%) - American Indian and Alaska Native
Year householder moved into unit - Moved in 1969 or earlier (%) - Multirace
Year householder moved into unit - Moved in 1969 or earlier (%) - Other Race
Housing units lacking complete plumbing facilities (%)
Housing units lacking complete kitchen facilities (%)
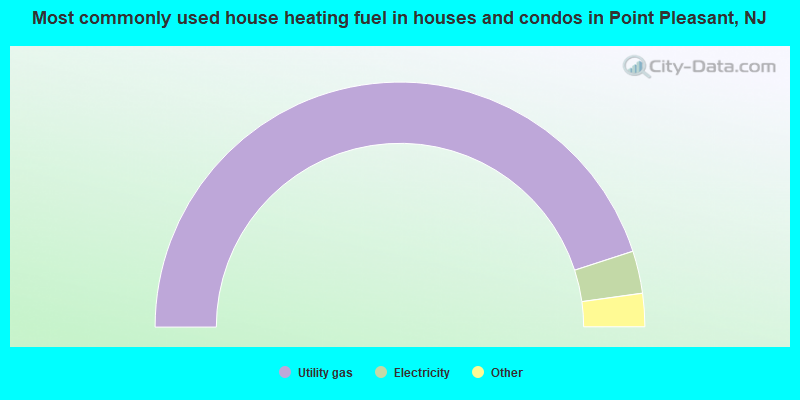
House heating fuel used in houses and condos - Utility gas (%)
House heating fuel used in houses and condos - Bottled, tank, or LP gas (%)
House heating fuel used in houses and condos - Electricity (%)
House heating fuel used in houses and condos - Fuel oil, kerosene, etc. (%)
House heating fuel used in houses and condos - Coal or coke (%)
House heating fuel used in houses and condos - Wood (%)
House heating fuel used in houses and condos - Solar energy (%)
House heating fuel used in houses and condos - Other fuel (%)
House heating fuel used in houses and condos - No fuel used (%)
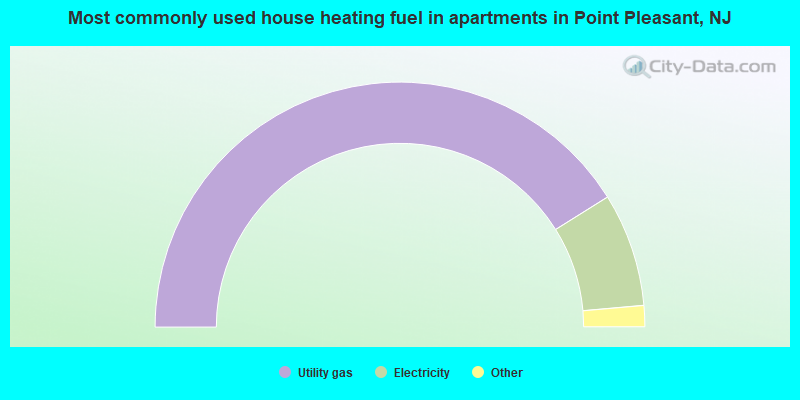
House heating fuel used in apartments - Utility gas (%)
House heating fuel used in apartments - Bottled, tank, or LP gas (%)
House heating fuel used in apartments - Electricity (%)
House heating fuel used in apartments - Fuel oil, kerosene, etc. (%)
House heating fuel used in apartments - Coal or coke (%)
House heating fuel used in apartments - Wood (%)
House heating fuel used in apartments - Solar energy (%)
House heating fuel used in apartments - Other fuel (%)
House heating fuel used in apartments - No fuel used (%)
Median year house/condo built: 1967Median year apartment built: 1971Household type by relationship:
Households: 19,531
Male householders: 4,204 (881 living alone ), Female householders: 3,776 (1,014 living alone )4,279 spouses (4,250 opposite-sex spouses ), 621 unmarried partners , (534 opposite-sex unmarried partners ), 5,245 children (5,047 natural , 93 adopted , 104 stepchildren ), 155 grandchildren , 173 brothers or sisters , 106 parents , 0 foster children , 242 other relatives , 612 non-relatives In group quarters: 114
Size of family households: 2,559 2-persons , 1,288 3-persons , 1,101 4-persons , 410 5-persons , 59 6-persons .
Size of nonfamily households: 1,756 1-person , 479 2-persons , 71 3-persons , 75 4-persons .
2,778 married couples with children. single-parent households (220 men , 567 women ).
89.7% of residents of Point Pleasant speak English at home. of residents speak Spanish at home (53% speak English very well , 12% speak English well , 25% speak English not well , 10% don't speak English at all ).of residents speak other Indo-European language at home (76% speak English very well , 24% speak English well ).of residents speak Asian or Pacific Island language at home (48% speak English very well , 50% speak English well , 3% speak English not well ).of residents speak other language at home (100% speak English very well ).
Foreign born population: 1,247 (6.4%)of them are naturalized citizens )
Median number of rooms in houses and condos:
Median number of rooms in apartments
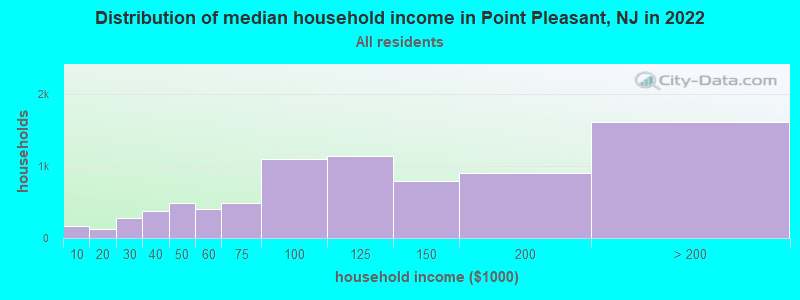
Point Pleasant, NJ household income distribution 161 Less than $10,000132 $10,000 to $19,999271 $20,000 to $29,999369 $30,000 to $39,999483 $40,000 to $49,999404 $50,000 to $59,999483 $60,000 to $74,9991,102 $75,000 to $99,9991,141 $100,000 to $124,999791 $125,000 to $149,999902 $150,000 to $199,9991,612 $200,000 or more
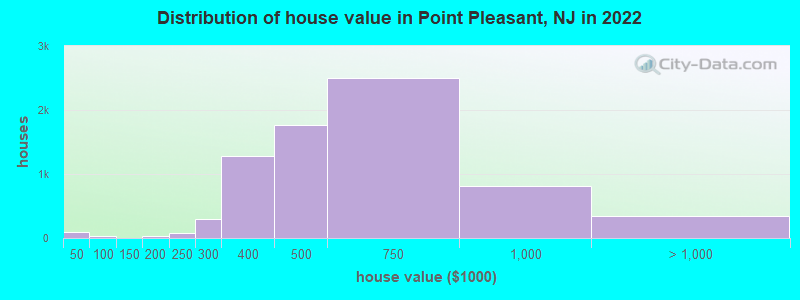
Home value of owner - occupied houses in 2022 in Point Pleasant, NJ 27 Less than $10,0007 $15,000 to $19,99913 $20,000 to $24,99924 $35,000 to $39,99917 $40,000 to $49,99910 $50,000 to $59,9995 $150,000 to $174,99918 $175,000 to $199,99985 $200,000 to $249,999296 $250,000 to $299,9991,283 $300,000 to $399,9991,770 $400,000 to $499,9992,499 $500,000 to $749,999809 $750,000 to $999,999275 $1,000,000 to $1,499,99942 $1,500,000 to $1,999,99925 $2,000,000 or moreRent paid by renters in 2022 in Point Pleasant, NJ 10 $350 to $39912 $650 to $699197 $1,000 to $1,249276 $1,250 to $1,499380 $1,500 to $1,999349 $2,000 to $2,49940 $2,500 to $2,9999 $3,000 to $3,49910 $3,500 or more101 No cash rent
Percentage of workers working in this county: 54.6%Number of people working at home: 1,197 (10.9% of all workers )
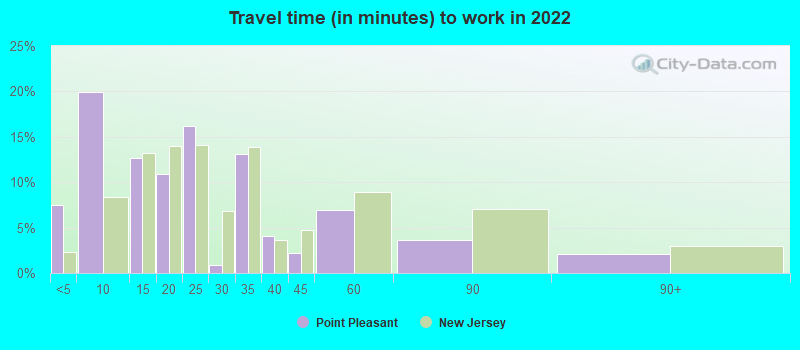
Travel time to work (commute)
Less than 5 minutes: 4315 to 9 minutes: 1,10110 to 14 minutes: 1,06415 to 19 minutes: 1,05420 to 24 minutes: 1,20025 to 29 minutes: 62030 to 34 minutes: 98035 to 39 minutes: 35340 to 44 minutes: 44345 to 59 minutes: 75560 to 89 minutes: 1,23690 or more minutes: 510
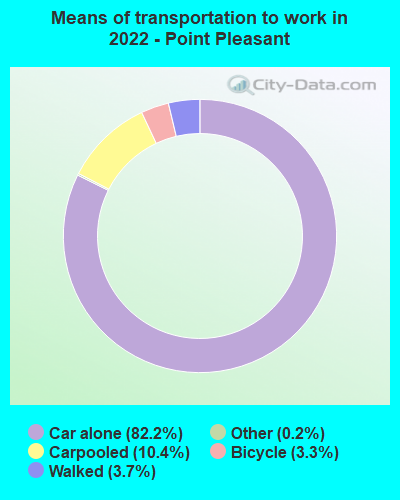
Means of transportation to work:
Drove a car alone: 3,504 (64.1%)Carpooled: 505 (9.2%)Light rail, streetcar or trolley : 1 (0.0%)Taxi: 9 (0.2%)Bicycle: 175 (3.2%)Walked: 203 (3.7%)Worked at home: 1,197 (21.9%)
Unemployment by race in 2022
Unemployment rate for White non-Hispanic residents 3.3% Males2.2% Females
Year of entry for the foreign-born population in Point Pleasant, New Jersey
642 2010 or later 254 2000 to 2009 127 1990 to 1999 89 1980 to 1989 58 1970 to 1979 319 Before 1970
First ancestries reported:
Italian: 1,528 (20.7%)
Irish: 1,477 (20.0%)
American: 765 (10.4%)
German: 572 (7.7%)
Polish: 462 (6.3%)
English: 227 (3.1%)
European: 154 (2.1%)
Russian: 151 (2.0%)
Norwegian: 106 (1.4%)
Scottish: 105 (1.4%)
Hungarian: 84 (1.1%)
Scotch-Irish: 51 (0.7%)
Lithuanian: 45 (0.6%)
Dutch: 41 (0.6%)
Northern European: 34 (0.5%)
Welsh: 30 (0.4%)
Ukrainian: 28 (0.4%)
Moroccan: 26 (0.4%)
Greek: 26 (0.4%)
Egyptian: 25 (0.3%)
Eastern European: 24 (0.3%)
Syrian: 16 (0.2%)
Portuguese: 16 (0.2%)
Austrian: 15 (0.2%)
Slovak: 15 (0.2%)
Lebanese: 14 (0.2%)
Brazilian: 14 (0.2%)
French: 14 (0.2%)
Scandinavian: 13 (0.2%)
British: 13 (0.2%)
Armenian: 12 (0.2%)
Czechoslovakian: 11 (0.1%)
African: 6 (0.08%)
Swedish: 5 (0.07%)
Swiss: 3 (0.04%) Most common places of birth for foreign-born residents (%): Mexico Point Pleasant:
42.1% (527)New Jersey:
4.8% (102,527)
Ecuador Point Pleasant:
6.5% (82)New Jersey:
4.4% (95,275)
Poland Point Pleasant:
6.2% (77)New Jersey:
2.3% (48,811)
Costa Rica Point Pleasant:
5.6% (70)New Jersey:
0.7% (14,848)
Philippines Point Pleasant:
5.1% (64)New Jersey:
4.0% (85,934)
Guatemala Point Pleasant:
4.4% (55)New Jersey:
2.2% (46,813)
Scotland Point Pleasant:
4.0% (50)New Jersey:
0.1% (2,470)
Brazil Point Pleasant:
4.0% (50)New Jersey:
2.1% (46,020)
Colombia Point Pleasant:
3.9% (49)New Jersey:
4.2% (90,817)
Cuba Point Pleasant:
2.9% (36)New Jersey:
2.1% (45,435)
Morocco Point Pleasant:
2.2% (28)New Jersey:
0.3% (5,621)
Peru Point Pleasant:
2.2% (28)New Jersey:
2.7% (58,563)
Dominican Republic Point Pleasant:
1.6% (20)New Jersey:
9.7% (209,055)
Place of birth for U.S.-born residents:
This state: 14,377Other state: 3,833Northeast: 2,538Midwest: 252South: 768West: 217 90.9% of Point Pleasant residents lived in the same house 1 years ago.
Out of people who lived in different houses, 38.6% lived in this county.
Out of people who lived in different counties, 82.2% lived in New Jersey.
Point Pleasant:
90.9%State average:
90.4%
Education attainment for males 25 years and older:
No schooling: 72Nursery to 4th grade: 05th and 6th grade: 247th and 8th grade: 39th grade: 010th grade: 5611th grade: 812th grade, no diploma: 75High school graduate (or equivalency): 1,812Less than 1 year of college: 599Some college more than 1 year, no degree: 795Associate degree: 514Bachelor's degree: 2,418Master's degree: 770Professional school degree: 93Doctorate degree: 38
Education attainment for females 25 years and older:
No schooling: 25Nursery to 4th grade: 155th and 6th grade: 167th and 8th grade: 299th grade: 1710th grade: 2311th grade: 2012th grade, no diploma: 59High school graduate (or equivalency): 1,501Less than 1 year of college: 652Some college more than 1 year, no degree: 823Associate degree: 643Bachelor's degree: 2,347Master's degree: 1,262Professional school degree: 69Doctorate degree: 121
Housing units in structures:
One, detached: 6,800One, attached: 522Two: 2733 or 4: 1115 to 9: 16610 to 19: 33120 to 49: 19150 or more: 8Boats, RVs, vans, etc.: 23Housing units lacking complete plumbing facilities in 2022: 0.4%Housing units lacking complete kitchen facilities in 2022: 0.4%House/condo owner moved in on average 15 years ago
Renter moved in on average 4 years ago
Private vs. public school enrollment:
Students in private schools in grades 1 to 8 (elementary and middle school): 92 Here:
5.8%New Jersey:
12.3%
Students in private schools in grades 9 to 12 (high school): 81 Here:
9.3%New Jersey:
13.1%
Students in private undergraduate colleges: 275 Here:
34.7%New Jersey:
33.2%