Piqua, OH (Ohio) Houses and Residents
| Piqua: | $115,925 |
| Ohio: | $204,100 |
Mean price in 2022:
Detached houses: $153,000
Here: $153,000 State: $254,366 Townhouses or other attached units: $146,403
Here: $146,403 State: $225,733 In 2-unit structures: $113,744
Here: $113,744 State: $144,384 Mobile homes: $7,818
Here: $7,818 State: $62,719
Total population: 20,759 (Urban population: 20,557 (all inside urban clusters), Rural population: 266 (all nonfarm))
Houses: 9,388 (8,758 occupied: 5,716 owner occupied, 3,296 renter occupied)
| % of renters here: | 37% |
| State: | 33% |
Housing density: 878 houses/condos per square mile
Median price asked for vacant for-sale houses and condos in 2022: $111,024.
Median contract rent in 2022: $670 (lower quartile is $513, upper quartile is $728)
Median rent asked for vacant for-rent units in 2022: $6,570
Median gross rent in Piqua, OH in 2022: $856
Housing units in Piqua with a mortgage: 3,795 (274 second mortgage, 0 home equity loan, 252 both second mortgage and home equity loan)
Houses without a mortgage: 32
Median household income for houses/condos with a mortgage: $76,216
Median household income for apartments without a mortgage: $63,534
Median monthly housing costs: $809
Compare current foreclosures in Piqua, OH:
| Photo | Address | Area | Beds / Baths | Price | Details |
|---|---|---|---|---|---|

|
#1
Madison Ave
Piqua, OH 45356
|
866 sq. feet
|
1 baths 2 beds |
show details | |

|
#2
Fairfax Ave
Piqua, OH 45356
|
1,262 sq. feet
|
2 baths 3 beds |
show details | |

|
#3
Carol Dr
Piqua, OH 45356
|
1,792 sq. feet
|
1 baths 4 beds |
show details | |

|
#4
Caldwell St
Piqua, OH 45356
|
2,894 sq. feet
|
1 baths 4 beds |
show details | |

|
#5
S Downing St
Piqua, OH 45356
|
1,862 sq. feet
|
1 baths 3 beds |
show details | |

|
#6
Glenwood Ave
Piqua, OH 45356
|
1,008 sq. feet
|
1 baths 2 beds |
show details | |

|
#7
Robinson Ave
Piqua, OH 45356
|
996 sq. feet
|
2 baths 3 beds |
show details | |

|
#8
South St
Piqua, OH 45356
|
1,748 sq. feet
|
1 baths 3 beds |
show details | |

|
#9
Caldwell St
Piqua, OH 45356
|
1,516 sq. feet
|
1 baths 4 beds |
show details | |

|
#10
W State Route 185
Piqua, OH 45356
|
1,186 sq. feet
|
1 baths 3 beds |
show details |
| Photo | Address | Area | Beds / Baths | Price | Details |
|---|---|---|---|---|---|

|
#11
W Greene St
Piqua, OH 45356
|
1,598 sq. feet
|
1 baths 4 beds |
show details | |

|
#12
Washington Ave
Piqua, OH 45356
|
886 sq. feet
|
1 baths 2 beds |
show details | |

|
#13
Ann St
Piqua, OH 45356
|
1,416 sq. feet
|
1 baths 3 beds |
show details | |

|
#14
Pinewood Ave
Piqua, OH 45356
|
1,026 sq. feet
|
1 baths 3 beds |
show details | |

|
#15
Garfield St
Piqua, OH 45356
|
875 sq. feet
|
1 baths 3 beds |
show details | |

|
#16
Lambert Dr
Piqua, OH 45356
|
1,316 sq. feet
|
2 baths 3 beds |
show details | |

|
#17
Wood St
Piqua, OH 45356
|
1,076 sq. feet
|
1 baths 3 beds |
show details | |

|
#18
Spotted Doe Ct
Piqua, OH 45356
|
1,267 sq. feet
|
2 baths 2 beds |
show details | |

|
#19
Brook St
Piqua, OH 45356
|
775 sq. feet
|
1 baths 2 beds |
show details | |

|
#20
S Wayne St
Piqua, OH 45356
|
900 sq. feet
|
1 baths 3 beds |
show details |
| Photo | Address | Area | Beds / Baths | Price | Details |
|---|---|---|---|---|---|

|
#21
Staunton St
Piqua, OH 45356
|
4,009 sq. feet
|
1 baths 8 beds |
show details | |

|
#22
Caldwell St
Piqua, OH 45356
|
1,456 sq. feet
|
1 baths 3 beds |
show details | |

|
#23
Springwood Dr
Piqua, OH 45356
|
2,175 sq. feet
|
2 baths 4 beds |
show details | |

|
#24
N Main St
Piqua, OH 45356
|
1,496 sq. feet
|
1 baths 3 beds |
show details | |

|
#25
N Sunset Dr
Piqua, OH 45356
|
1,980 sq. feet
|
2 baths 3 beds |
show details | |

|
#26
Sweetbriar Ave
Piqua, OH 45356
|
1,227 sq. feet
|
1 baths 3 beds |
show details | |

|
#27
Caldwell St
Piqua, OH 45356
|
1,237 sq. feet
|
1 baths 3 beds |
show details | |

|
#28
Robinson Ave
Piqua, OH 45356
|
1,082 sq. feet
|
1 baths 3 beds |
show details | |

|
#29
3rd St
Piqua, OH 45356
|
1,281 sq. feet
|
1 baths 3 beds |
show details | |

|
#30
Covington Ave
Piqua, OH 45356
|
1,440 sq. feet
|
1 baths 3 beds |
show details |
| Photo | Address | Area | Beds / Baths | Price | Details |
|---|---|---|---|---|---|

|
#31
Robinson Ave
Piqua, OH 45356
|
- sq. feet
|
- baths - beds |
show details | |

|
#32
Gordon St
Piqua, OH 45356
|
- sq. feet
|
- baths - beds |
show details | |

|
#33
Garbry Rd
Piqua, OH 45356
|
- sq. feet
|
- baths - beds |
show details | |

|
#34
Deerfield Xing
Piqua, OH 45356
|
- sq. feet
|
- baths - beds |
show details | |

|
#35
E Greene St
Piqua, OH 45356
|
- sq. feet
|
- baths - beds |
show details | |

|
#36
Deerfield Xing
Piqua, OH 45356
|
- sq. feet
|
- baths - beds |
show details | |

|
#37
S Wayne St
Piqua, OH 45356
|
- sq. feet
|
- baths - beds |
show details | |

|
#38
Madison Ave
Piqua, OH 45356
|
- sq. feet
|
- baths - beds |
show details | |

|
#39
Gordon St
Piqua, OH 45356
|
- sq. feet
|
- baths - beds |
show details | |

|
#40
Forest Ave
Piqua, OH 45356
|
- sq. feet
|
- baths - beds |
show details |
| Photo | Address | Area | Beds / Baths | Price | Details |
|---|---|---|---|---|---|

|
#41
Kiowa Ct
Piqua, OH 45356
|
- sq. feet
|
- baths - beds |
show details | |

|
#42
S Main St
Piqua, OH 45356
|
- sq. feet
|
- baths - beds |
show details | |

|
#43
And 1/2 Brice Ave
Piqua, OH 45356
|
- sq. feet
|
- baths - beds |
show details | |

|
#44
Jed Way
Piqua, OH 45356
|
- sq. feet
|
- baths - beds |
show details | |

|
Check over 1 million property listings on Foreclosure.com!
|
browse all offers | |||

Latest news about housing in Piqua, OH collected exclusively by city-data.com from local newspapers, TV, and radio stations

 | Suggest Apartment communities in Dayton for rental (work location will be Sidney) (16 replies) |
| Apartments in Troy, Oh (2 replies) |
| Maybe relocating to Piqua (14 replies) |
| Flooding on I-75 between Troy and Piqua (9 replies) |
| OHIO move (9 replies) |
| Whatever happened to the Industrialist families of Dayton? (151 replies) |

Median year apartment built: 1955
Household type by relationship:
Households: 20,709- Male householders: 4,451 (1,708 living alone), Female householders: 4,334 (1,617 living alone)
3,430 spouses (3,420 opposite-sex spouses), 796 unmarried partners, (748 opposite-sex unmarried partners), 5,861 children (5,458 natural, 33 adopted, 369 stepchildren), 296 grandchildren, 285 brothers or sisters, 157 parents, 19 foster children, 248 other relatives, 537 non-relatives
- In group quarters: 289
Size of family households: 2,461 2-persons, 858 3-persons, 843 4-persons, 582 5-persons, 77 6-persons, 214 7-or-more-persons.
Size of nonfamily households: 3,281 1-person, 566 2-persons, 146 3-persons, 12 5-persons.
2,632 married couples with children.
1,822 single-parent households (421 men, 1,401 women).
98.0% of residents of Piqua speak English at home.
0.7% of residents speak Spanish at home (67% speak English very well, 33% speak English well).
0.2% of residents speak other Indo-European language at home (100% speak English very well).
0.7% of residents speak Asian or Pacific Island language at home (100% speak English very well).
Foreign born population: 192 (0.9%)
(59.4% of them are naturalized citizens)
| Here: | 6.6 |
| State: | 6.7 |
| Here: | 4.4 |
| State: | 4.4 |

- Bedrooms in owner-occupied houses and condos in Piqua, Ohio
- 0no bedroom
- 1011 bedroom
- 1,3892 bedrooms
- 2,8233 bedrooms
- 1,2054 bedrooms
- 2005+ bedrooms

- Bedrooms in renter-occupied apartments in Piqua, Ohio
- 36no bedroom
- 5831 bedroom
- 1,6952 bedrooms
- 8393 bedrooms
- 1434 bedrooms
- 05+ bedrooms

- Cars and other vehicles available in Piqua in owner-occupied houses/condos
- 68no vehicle
- 1,4181 vehicle
- 2,5882 vehicles
- 8883 vehicles
- 4914 vehicles
- 2655+ vehicles

- Cars and other vehicles available in Piqua in renter-occupied apartments
- 474no vehicle
- 1,5861 vehicle
- 9962 vehicles
- 2413 vehicles
- 04 vehicles
- 05+ vehicles

- Rooms in owner-occupied houses in Piqua, Ohio
- 01 room
- 02 rooms
- 2043 rooms
- 2204 rooms
- 1,2235 rooms
- 1,2406 rooms
- 1,0677 rooms
- 5508 rooms
- 1,2129+ rooms

- Rooms in renter-occupied apartments in Piqua, Ohio
- 361 room
- 712 rooms
- 3253 rooms
- 1,0904 rooms
- 7905 rooms
- 4896 rooms
- 3257 rooms
- 1178 rooms
- 539+ rooms


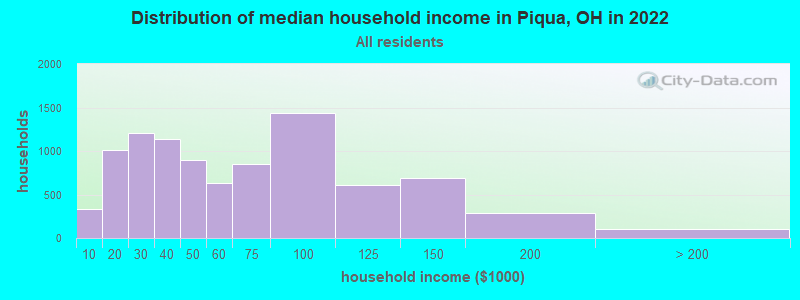
Piqua, OH household income distribution

- 332Less than $10,000
- 1,012$10,000 to $19,999
- 1,205$20,000 to $29,999
- 1,143$30,000 to $39,999
- 897$40,000 to $49,999
- 636$50,000 to $59,999
- 856$60,000 to $74,999
- 1,436$75,000 to $99,999
- 609$100,000 to $124,999
- 687$125,000 to $149,999
- 287$150,000 to $199,999
- 101$200,000 or more
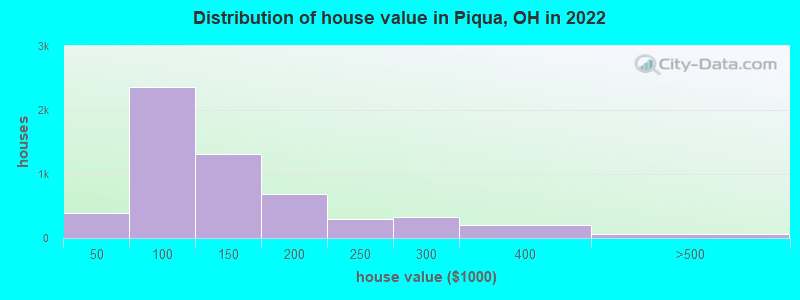
Home value of owner - occupied houses in 2022 in Piqua, OH
-
- 36Less than $10,000
- 17$10,000 to $14,999
- 28$25,000 to $29,999
- 20$30,000 to $34,999
- 77$35,000 to $39,999
- 209$40,000 to $49,999
- 352$50,000 to $59,999
- 440$60,000 to $69,999
- 285$70,000 to $79,999
- 388$80,000 to $89,999
- 680$90,000 to $99,999
- 688$100,000 to $124,999
- 621$125,000 to $149,999
- 360$150,000 to $174,999
- 320$175,000 to $199,999
- 292$200,000 to $249,999
- 328$250,000 to $299,999
- 197$300,000 to $399,999
- 30$400,000 to $499,999
- 24$500,000 to $749,999
- 8$1,000,000 to $1,499,999
Rent paid by renters in 2022 in Piqua, OH
-
- 61Less than $100
- 30$150 to $199
- 67$200 to $249
- 126$250 to $299
- 67$300 to $349
- 20$350 to $399
- 126$400 to $449
- 128$450 to $499
- 158$500 to $549
- 291$550 to $599
- 437$600 to $649
- 554$650 to $699
- 260$700 to $749
- 219$750 to $799
- 201$800 to $899
- 88$900 to $999
- 64$1,000 to $1,249
- 7$1,250 to $1,499
- 200No cash rent


Percentage of workers working in this county: 70.0%
Number of people working at home: 515 (5.1% of all workers)
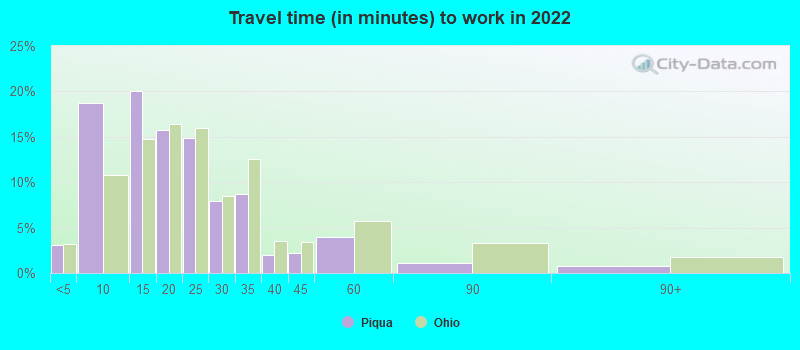
Travel time to work (commute)
- Less than 5 minutes: 340
- 5 to 9 minutes: 2,034
- 10 to 14 minutes: 1,974
- 15 to 19 minutes: 1,763
- 20 to 24 minutes: 1,582
- 25 to 29 minutes: 459
- 30 to 34 minutes: 476
- 35 to 39 minutes: 474
- 40 to 44 minutes: 193
- 45 to 59 minutes: 272
- 60 to 89 minutes: 164
- 90 or more minutes: 66
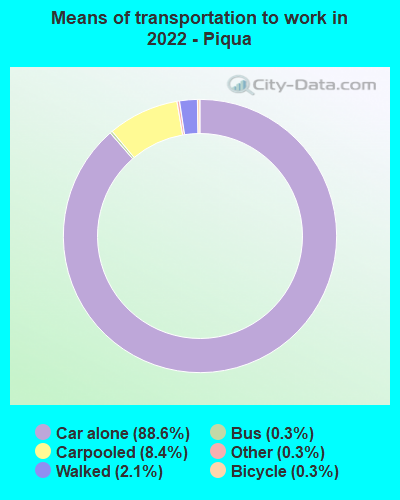
Means of transportation to work:
- Drove a car alone: 7,162 (81.1%)
- Carpooled: 726 (8.2%)
- Bus: 18 (0.2%)
- Taxi: 27 (0.3%)
- Bicycle: 30 (0.3%)
- Walked: 173 (2.0%)
- Worked at home: 515 (5.8%)

- Unemployment by race in 2022
- Unemployment rate for White non-Hispanic residents
- 2.5%Males
- 2.6%Females
- Unemployment rate for Black residents
- 59.2%Males
- Unemployment rate for other race residents
- 37.4%Females
- Unemployment rate for two or more race residents
- 9.2%Males
- 9.6%Females

- Year of entry for the foreign-born population in Piqua, Ohio
- 1192010 or later
- 862000 to 2009
- 01990 to 1999
- 611980 to 1989
- 881970 to 1979
- 71Before 1970

First ancestries reported:
- German: 2,557 (28.0%)
- American: 2,234 (24.5%)
- English: 996 (10.9%)
- Irish: 582 (6.4%)
- European: 209 (2.3%)
- Italian: 101 (1.1%)
- British: 91 (1.0%)
- Welsh: 85 (0.9%)
- French: 76 (0.8%)
- Dutch: 70 (0.8%)
- Polish: 59 (0.6%)
- Scottish: 53 (0.6%)
- Swedish: 16 (0.2%)
- Scotch-Irish: 15 (0.2%)
- Macedonian: 8 (0.09%)
- Romanian: 5 (0.05%)
- Swiss: 3 (0.03%)
Most common places of birth for foreign-born residents (%):
| Piqua: | 45.4% (98) |
| Ohio: | 3.1% (17,818) |
| Piqua: | 13.9% (30) |
| Ohio: | 1.1% (6,549) |
| Piqua: | 13.4% (29) |
| Ohio: | 1.0% (5,553) |
| Piqua: | 7.9% (17) |
| Ohio: | 2.0% (11,398) |
| Piqua: | 6.0% (13) |
| Ohio: | 0.0% (192) |
| Piqua: | 3.2% (7) |
| Ohio: | 2.2% (12,846) |
Place of birth for U.S.-born residents:
- This state: 17,948
- Other state: 2,473
- Northeast: 465
- Midwest: 457
- South: 1,183
- West: 394
82.5% of Piqua residents lived in the same house 1 years ago.
Out of people who lived in different houses, 41.9% lived in this county.
Out of people who lived in different counties, 57.3% lived in Ohio.
| Piqua: | 82.5% |
| State average: | 87.8% |
Education attainment for males 25 years and older:
- No schooling: 99
- Nursery to 4th grade: 48
- 5th and 6th grade: 0
- 7th and 8th grade: 115
- 9th grade: 96
- 10th grade: 14
- 11th grade: 230
- 12th grade, no diploma: 148
- High school graduate (or equivalency): 2,971
- Less than 1 year of college: 445
- Some college more than 1 year, no degree: 886
- Associate degree: 767
- Bachelor's degree: 953
- Master's degree: 298
- Professional school degree: 27
- Doctorate degree: 14

Education attainment for females 25 years and older:
- No schooling: 11
- Nursery to 4th grade: 19
- 5th and 6th grade: 14
- 7th and 8th grade: 46
- 9th grade: 34
- 10th grade: 308
- 11th grade: 468
- 12th grade, no diploma: 214
- High school graduate (or equivalency): 2,326
- Less than 1 year of college: 769
- Some college more than 1 year, no degree: 839
- Associate degree: 762
- Bachelor's degree: 530
- Master's degree: 335
- Professional school degree: 8
- Doctorate degree: 17


Housing units in structures:
- One, detached: 6,895
- One, attached: 439
- Two: 570
- 3 or 4: 764
- 5 to 9: 214
- 10 to 19: 256
- 20 to 49: 80
- 50 or more: 150
- Mobile homes: 16
Housing units lacking complete kitchen facilities in 2022: 5.0%
House/condo owner moved in on average 14 years ago
Renter moved in on average 3 years ago

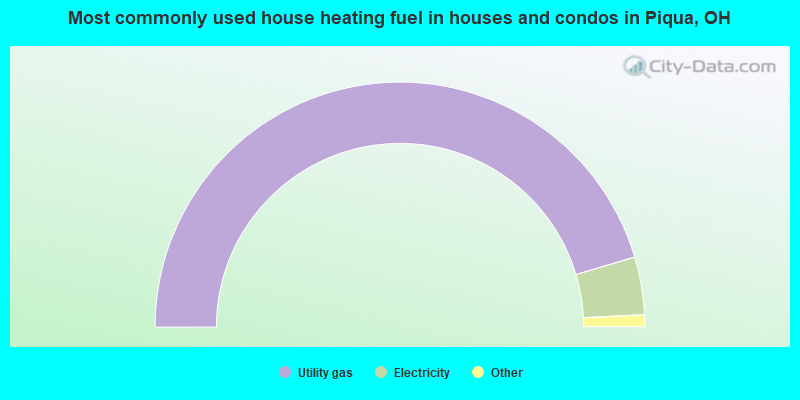
- 90.8%Utility gas
- 7.6%Electricity
- 1.2%Bottled, tank, or LP gas
- 0.2%Wood
- 0.2%Fuel oil, kerosene, etc.
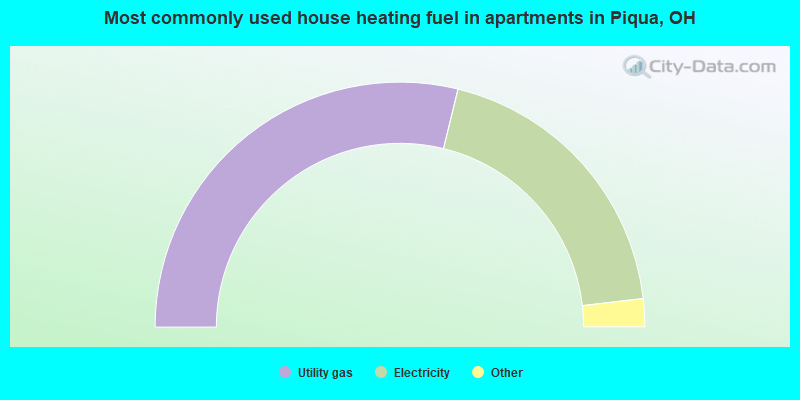
- 57.7%Utility gas
- 38.7%Electricity
- 2.8%Bottled, tank, or LP gas
- 0.4%Other fuel
- 0.4%No fuel used
Private vs. public school enrollment:
| Here: | 3.1% |
| Ohio: | 16.0% |
| Here: | 2.7% |
| Ohio: | 13.1% |
| Here: | 30.5% |
| Ohio: | 22.3% |


