Petal, MS (Mississippi) Houses and Residents
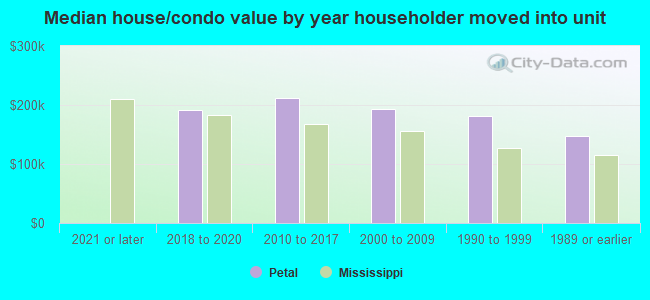
| Petal: | $192,653 |
| Mississippi: | $162,500 |
Total population: 10,727 (Urban population: 6,919, Rural population: 747 (all nonfarm))
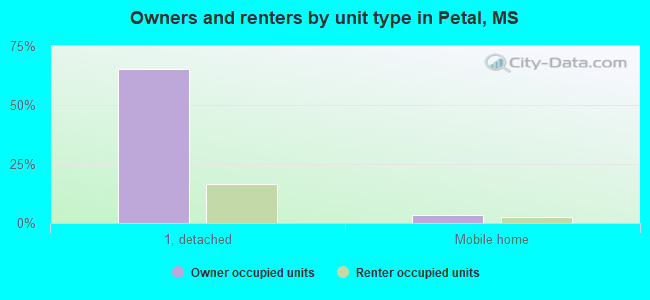
Houses: 4,475 (4,026 occupied: 2,871 owner occupied, 1,295 renter occupied)
| % of renters here: | 31% |
| State: | 30% |
Housing density: 463 houses/condos per square mile
Median price asked for vacant for-sale houses and condos in 2022 in this county: $219,229.
Median contract rent in 2022: $633 (lower quartile is $537, upper quartile is $877)
Median rent asked for vacant for-rent units in 2022: $3,562
Median gross rent in Petal, MS in 2022: $834
Housing units in Petal with a mortgage: 1,945 (168 second mortgage, 9 home equity loan, 137 both second mortgage and home equity loan)
Houses without a mortgage: 88
Median household income for houses/condos with a mortgage: $81,280
Median household income for apartments without a mortgage: $57,449
Median monthly housing costs: $939
Compare current foreclosures in Petal, MS:
| Photo | Address | Area | Beds / Baths | Price | Details |
|---|---|---|---|---|---|

|
#1
Eastover Blvd
Petal, MS 39465
|
2,407 sq. feet
|
2 baths - beds |
show details | |

|
#2
Twin Lakes Rd
Petal, MS 39465
|
2,128 sq. feet
|
3 baths - beds |
show details | |

|
#3
Stephens Rd
Petal, MS 39465
|
1,262 sq. feet
|
1 baths - beds |
show details | |

|
#4
Green Bay Dr
Petal, MS 39465
|
1,430 sq. feet
|
2 baths - beds |
show details | |

|
#5
Keystone Dr
Petal, MS 39465
|
1,583 sq. feet
|
2 baths - beds |
show details | |

|
#6
Norman Dr
Petal, MS 39465
|
1,036 sq. feet
|
1 baths - beds |
show details | |

|
#7
Margaret Ave
Petal, MS 39465
|
1,160 sq. feet
|
1 baths - beds |
show details | |

|
#8
Highway 29
Petal, MS 39465
|
1,316 sq. feet
|
- baths 2 beds |
show details | |

|
#9
Macedonia Rd
Petal, MS 39465
|
1,141 sq. feet
|
1 baths - beds |
show details | |

|
#10
Shoreline Dr
Petal, MS 39465
|
1,580 sq. feet
|
2 baths - beds |
show details |
| Photo | Address | Area | Beds / Baths | Price | Details |
|---|---|---|---|---|---|

|
#11
Smith St
Petal, MS 39465
|
1,786 sq. feet
|
1 baths - beds |
show details | |

|
#12
Trailwood Cir
Petal, MS 39465
|
1,280 sq. feet
|
1 baths - beds |
show details | |

|
#13
Southgate Dr
Petal, MS 39465
|
1,480 sq. feet
|
1 baths - beds |
show details | |

|
#14
Cochran St
Petal, MS 39465
|
1,370 sq. feet
|
1 baths - beds |
show details | |

|
#15
Hillcrest Cir
Petal, MS 39465
|
1,066 sq. feet
|
1 baths - beds |
show details | |

|
#16
Country Park Dr
Petal, MS 39465
|
1,321 sq. feet
|
1 baths - beds |
show details | |

|
#17
W Fourth Ave
Petal, MS 39465
|
704 sq. feet
|
1 baths - beds |
show details | |

|
#18
Pumping Station Rd
Petal, MS 39465
|
944 sq. feet
|
- baths 1 beds |
show details | |

|
#19
Charles St
Petal, MS 39465
|
1,260 sq. feet
|
1 baths - beds |
show details | |

|
#20
Smith St
Petal, MS 39465
|
1,391 sq. feet
|
1 baths - beds |
show details |
| Photo | Address | Area | Beds / Baths | Price | Details |
|---|---|---|---|---|---|

|
#21
Lynn Ray Rd
Petal, MS 39465
|
1,487 sq. feet
|
2 baths - beds |
show details | |

|
#22
Willow St
Petal, MS 39465
|
1,404 sq. feet
|
1 baths - beds |
show details | |

|
#23
Ogilsvie St
Petal, MS 39465
|
1,472 sq. feet
|
1 baths - beds |
show details | |

|
#24
Melissa Loop
Petal, MS 39465
|
1,617 sq. feet
|
2 baths - beds |
show details | |

|
#25
Hillside Dr
Petal, MS 39465
|
1,000 sq. feet
|
1 baths - beds |
show details | |

|
#26
Maple Dr
Petal, MS 39465
|
1,716 sq. feet
|
1 baths - beds |
show details | |

|
#27
Courtney Rd
Petal, MS 39465
|
1,796 sq. feet
|
1 baths - beds |
show details | |

|
#28
Keystone Dr
Petal, MS 39465
|
1,540 sq. feet
|
2 baths - beds |
show details | |

|
#29
Old Richton Rd
Petal, MS 39465
|
2,354 sq. feet
|
2 baths - beds |
show details | |

|
#30
Smith St
Petal, MS 39465
|
1,412 sq. feet
|
1 baths - beds |
show details |
| Photo | Address | Area | Beds / Baths | Price | Details |
|---|---|---|---|---|---|

|
#31
Archel St
Petal, MS 39465
|
- sq. feet
|
- baths - beds |
show details | |

|
#32
Dixie Ave Apt 27
Petal, MS 39465
|
- sq. feet
|
- baths - beds |
show details | |

|
#33
Anne St
Petal, MS 39465
|
- sq. feet
|
- baths - beds |
show details | |

|
#34
King Blvd
Petal, MS 39465
|
- sq. feet
|
- baths - beds |
show details | |

|
#35
Sunrise Rd # 4
Petal, MS 39465
|
- sq. feet
|
- baths - beds |
show details | |

|
#36
Luther Carter Rd
Petal, MS 39465
|
- sq. feet
|
- baths - beds |
show details | |

|
#37
Holly Dr
Petal, MS 39465
|
- sq. feet
|
- baths - beds |
show details | |

|
#38
Mcinnis St
Petal, MS 39465
|
- sq. feet
|
- baths - beds |
show details | |

|
#39
Colby Ln
Petal, MS 39465
|
1,344 sq. feet
|
- baths - beds |
show details | |

|
#40
Lakeland Cir
Petal, MS 39465
|
- sq. feet
|
- baths - beds |
show details |
| Photo | Address | Area | Beds / Baths | Price | Details |
|---|---|---|---|---|---|

|
#41
Charles St # B
Petal, MS 39465
|
- sq. feet
|
- baths - beds |
show details | |

|
#42
Carterville Rd
Petal, MS 39465
|
1,096 sq. feet
|
- baths - beds |
show details | |

|
#43
Old River Rd
Petal, MS 39465
|
- sq. feet
|
- baths - beds |
show details | |

|
#44
Old River Rd
Petal, MS 39465
|
- sq. feet
|
- baths - beds |
show details | |

|
#45
Bennett St
Petal, MS 39465
|
1,442 sq. feet
|
- baths - beds |
show details | |

|
#46
Mcinnis St
Petal, MS 39465
|
- sq. feet
|
- baths - beds |
show details | |

|
#47
Charles St Apt 1
Petal, MS 39465
|
- sq. feet
|
- baths - beds |
show details | |

|
#48
S Main St
Petal, MS 39465
|
- sq. feet
|
- baths - beds |
show details | |

|
#49
S George Ave
Petal, MS 39465
|
- sq. feet
|
- baths - beds |
show details | |

|
Check over 1 million property listings on Foreclosure.com!
|
browse all offers | |||

Latest news about housing in Petal, MS collected exclusively by city-data.com from local newspapers, TV, and radio stations

 | rental homes in the Petal area? (1 reply) |
| Hattiesburg or Brandon (17 replies) |
| Tornado strikes Hattiesburg, Petal (2 replies) |
| Maybe thinking of moving to Mississippi. (26 replies) |
| Moving to MS.... Advice?, Info? etc (20 replies) |
| If you had $150,000 to spend on a house, where would you live in MS? (120 replies) |

Median year apartment built: 1976
Household type by relationship:
Households: 11,074- Male householders: 1,691 (288 living alone), Female householders: 2,310 (640 living alone)
1,991 spouses (1,991 opposite-sex spouses), 166 unmarried partners, (166 opposite-sex unmarried partners), 3,552 children (3,182 natural, 38 adopted, 331 stepchildren), 446 grandchildren, 78 brothers or sisters, 123 parents, 0 foster children, 270 other relatives, 362 non-relatives
- In group quarters: 80
Size of family households: 1,203 2-persons, 753 3-persons, 459 4-persons, 254 5-persons, 94 6-persons.
Size of nonfamily households: 1,024 1-person, 280 2-persons, 8 3-persons.
1,995 married couples with children.
552 single-parent households (106 men, 446 women).
96.6% of residents of Petal speak English at home.
3.0% of residents speak Spanish at home (56% speak English very well, 24% speak English well, 17% speak English not well, 3% don't speak English at all).
Foreign born population: 138 (1.2%)
(15.2% of them are naturalized citizens)
| Here: | 7.1 |
| State: | 6.3 |
| Here: | 4.5 |
| State: | 4.8 |
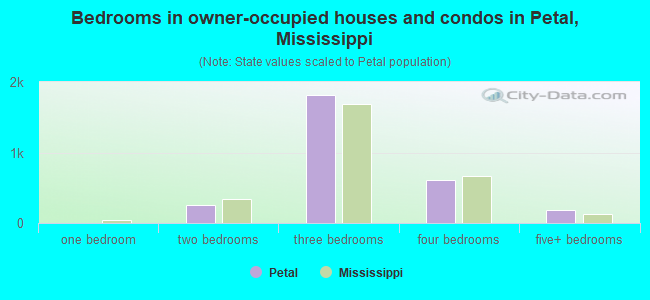
- Bedrooms in owner-occupied houses and condos in Petal, Mississippi
- 0no bedroom
- 01 bedroom
- 2572 bedrooms
- 1,8213 bedrooms
- 6044 bedrooms
- 1895+ bedrooms
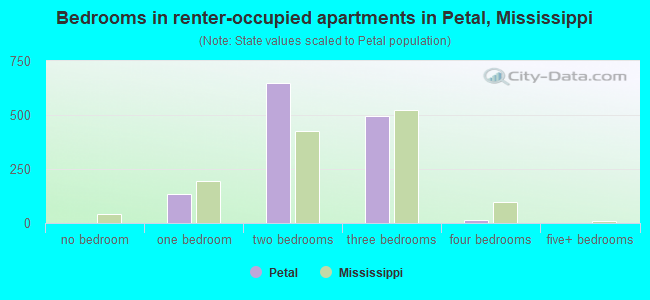
- Bedrooms in renter-occupied apartments in Petal, Mississippi
- 0no bedroom
- 1351 bedroom
- 6492 bedrooms
- 4943 bedrooms
- 164 bedrooms
- 25+ bedrooms
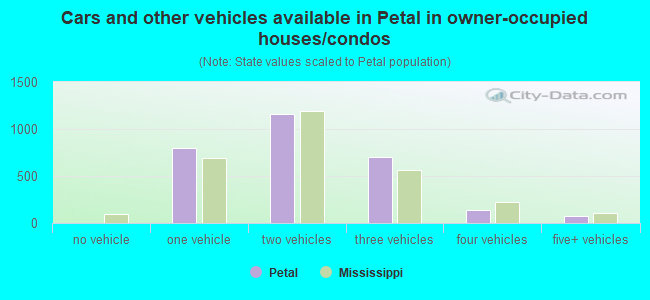
- Cars and other vehicles available in Petal in owner-occupied houses/condos
- 0no vehicle
- 7961 vehicle
- 1,1642 vehicles
- 7033 vehicles
- 1364 vehicles
- 725+ vehicles
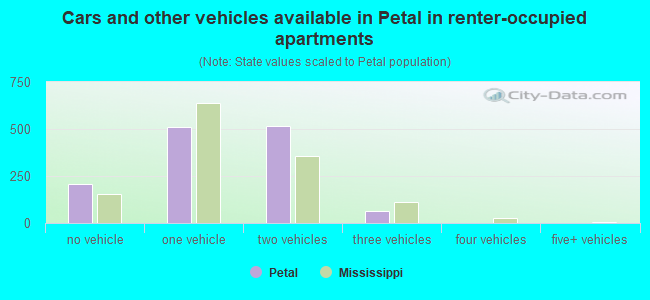
- Cars and other vehicles available in Petal in renter-occupied apartments
- 207no vehicle
- 5111 vehicle
- 5142 vehicles
- 643 vehicles
- 04 vehicles
- 05+ vehicles
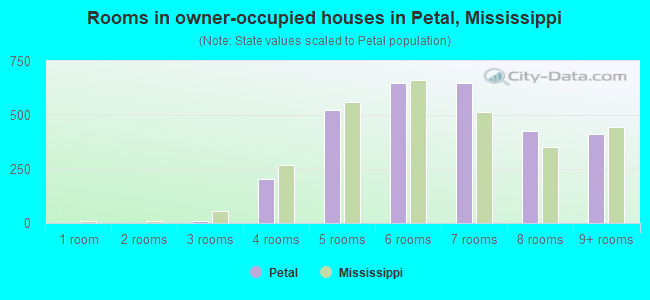
- Rooms in owner-occupied houses in Petal, Mississippi
- 01 room
- 02 rooms
- 113 rooms
- 2024 rooms
- 5225 rooms
- 6506 rooms
- 6477 rooms
- 4258 rooms
- 4139+ rooms
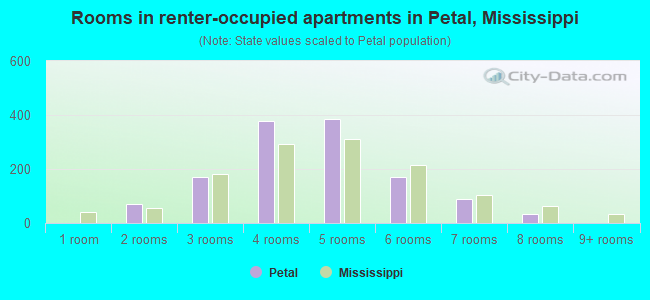
- Rooms in renter-occupied apartments in Petal, Mississippi
- 01 room
- 702 rooms
- 1713 rooms
- 3794 rooms
- 3845 rooms
- 1696 rooms
- 907 rooms
- 328 rooms
- 09+ rooms
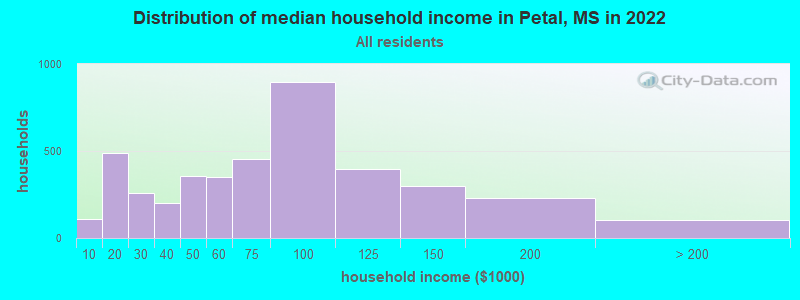
Petal, MS household income distribution

- 112Less than $10,000
- 487$10,000 to $19,999
- 258$20,000 to $29,999
- 201$30,000 to $39,999
- 356$40,000 to $49,999
- 351$50,000 to $59,999
- 456$60,000 to $74,999
- 895$75,000 to $99,999
- 396$100,000 to $124,999
- 301$125,000 to $149,999
- 229$150,000 to $199,999
- 105$200,000 or more
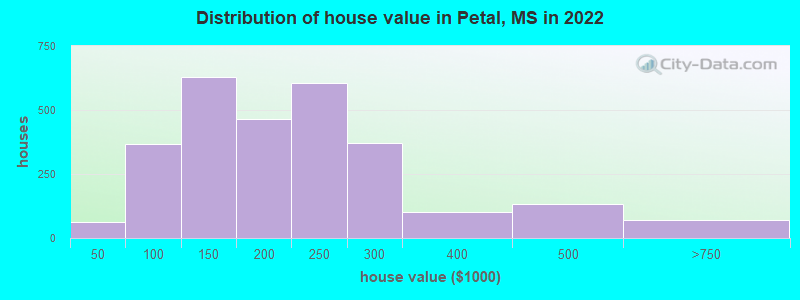
Home value of owner - occupied houses in 2022 in Petal, MS
-
- 30$10,000 to $14,999
- 3$25,000 to $29,999
- 28$35,000 to $39,999
- 63$50,000 to $59,999
- 75$60,000 to $69,999
- 74$70,000 to $79,999
- 48$80,000 to $89,999
- 103$90,000 to $99,999
- 461$100,000 to $124,999
- 169$125,000 to $149,999
- 304$150,000 to $174,999
- 159$175,000 to $199,999
- 605$200,000 to $249,999
- 369$250,000 to $299,999
- 100$300,000 to $399,999
- 130$400,000 to $499,999
- 70$500,000 to $749,999
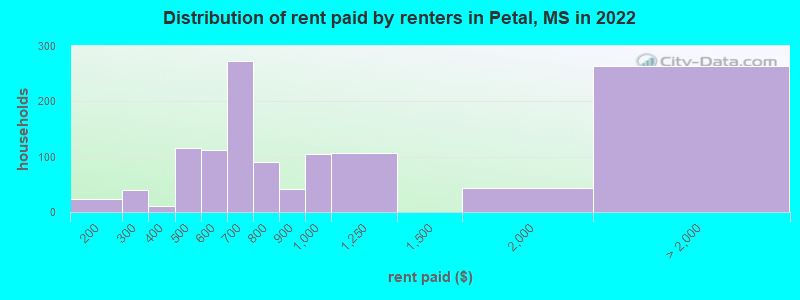
Rent paid by renters in 2022 in Petal, MS
-
- 23$150 to $199
- 39$200 to $249
- 9$300 to $349
- 24$400 to $449
- 91$450 to $499
- 60$500 to $549
- 51$550 to $599
- 162$600 to $649
- 110$650 to $699
- 44$700 to $749
- 45$750 to $799
- 40$800 to $899
- 105$900 to $999
- 106$1,000 to $1,249
- 43$1,500 to $1,999
- 263No cash rent
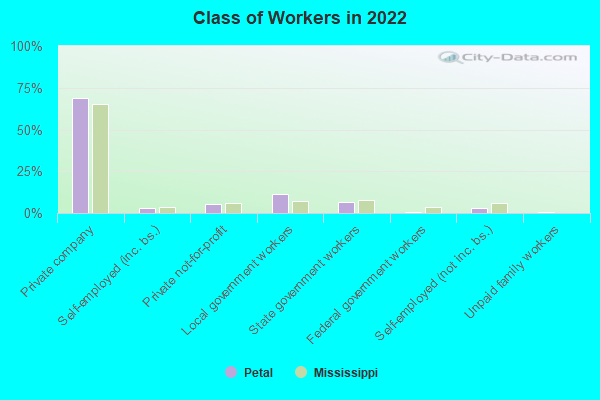
Percentage of workers working in this county: 62.9%
Number of people working at home: 238 (4.8% of all workers)
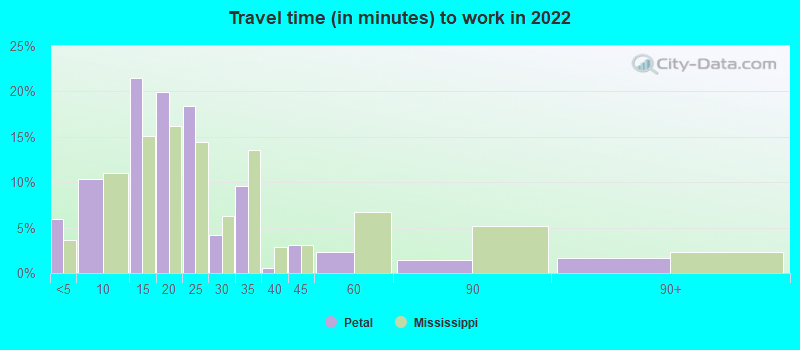
Travel time to work (commute)
- Less than 5 minutes: 172
- 5 to 9 minutes: 511
- 10 to 14 minutes: 640
- 15 to 19 minutes: 696
- 20 to 24 minutes: 879
- 25 to 29 minutes: 224
- 30 to 34 minutes: 600
- 35 to 39 minutes: 97
- 40 to 44 minutes: 231
- 45 to 59 minutes: 47
- 60 to 89 minutes: 61
- 90 or more minutes: 162
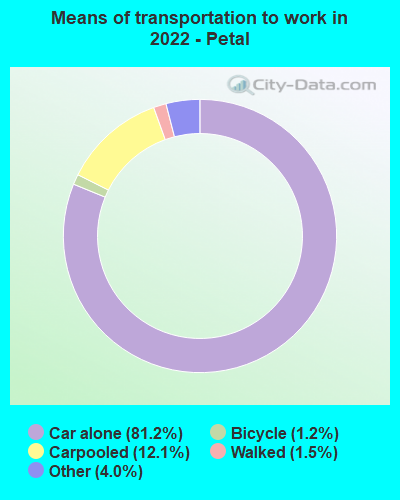
Means of transportation to work:
- Drove a car alone: 2,819 (75.2%)
- Carpooled: 467 (12.5%)
- Taxi: 113 (3.0%)
- Bicycle: 34 (0.9%)
- Walked: 64 (1.7%)
- Worked at home: 238 (6.4%)
- Unemployment by race in 2022
- Unemployment rate for White non-Hispanic residents
- 5.9%Males
- 16.9%Females
- Unemployment rate for Black residents
- 11.3%Females
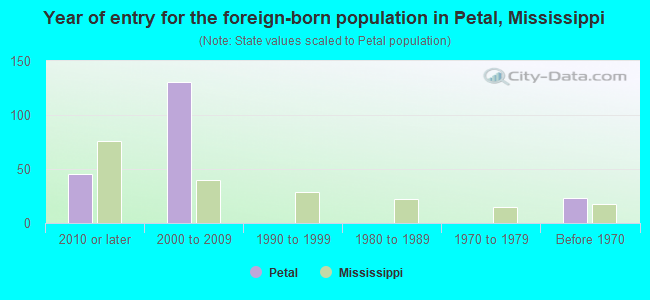
- Year of entry for the foreign-born population in Petal, Mississippi
- 452010 or later
- 1312000 to 2009
- 01990 to 1999
- 01980 to 1989
- 01970 to 1979
- 23Before 1970
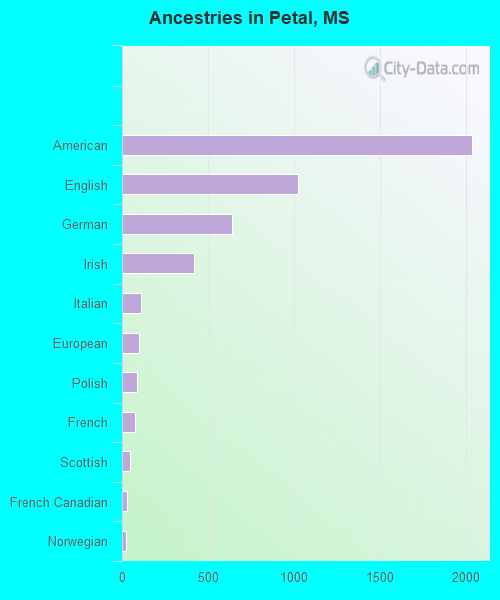
First ancestries reported:
- American: 2,035 (30.5%)
- English: 1,022 (15.3%)
- German: 638 (9.5%)
- Irish: 422 (6.3%)
- Italian: 113 (1.7%)
- European: 97 (1.5%)
- Polish: 87 (1.3%)
- French: 74 (1.1%)
- Scottish: 45 (0.7%)
- French Canadian: 27 (0.4%)
- Norwegian: 22 (0.3%)
- Austrian: 12 (0.2%)
- African: 11 (0.2%)
- Dutch: 10 (0.1%)
- Swedish: 9 (0.1%)
- Scotch-Irish: 3 (0.04%)
Most common places of birth for foreign-born residents (%):
| Petal: | 86.0% (184) |
| Mississippi: | 25.4% (17,354) |
| Petal: | 7.0% (15) |
| Mississippi: | 1.3% (870) |
| Petal: | 3.7% (8) |
| Mississippi: | 4.7% (3,211) |
Place of birth for U.S.-born residents:
- This state: 7,795
- Other state: 3,011
- Northeast: 88
- Midwest: 333
- South: 2,438
- West: 229
92.1% of Petal residents lived in the same house 1 years ago.
Out of people who lived in different houses, 30.8% lived in this county.
Out of people who lived in different counties, 18.2% lived in Mississippi.
| Petal: | 92.1% |
| State average: | 88.9% |
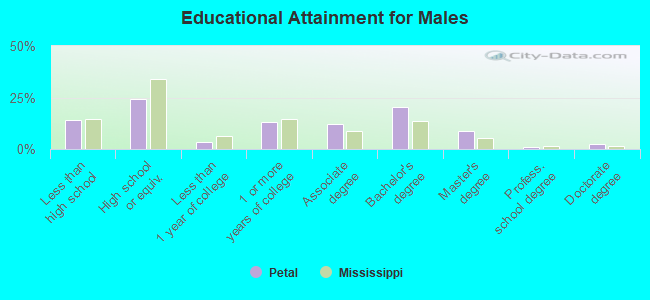
Education attainment for males 25 years and older:
- No schooling: 59
- Nursery to 4th grade: 3
- 5th and 6th grade: 17
- 7th and 8th grade: 6
- 9th grade: 121
- 10th grade: 0
- 11th grade: 189
- 12th grade, no diploma: 44
- High school graduate (or equivalency): 743
- Less than 1 year of college: 100
- Some college more than 1 year, no degree: 409
- Associate degree: 377
- Bachelor's degree: 636
- Master's degree: 275
- Professional school degree: 33
- Doctorate degree: 74
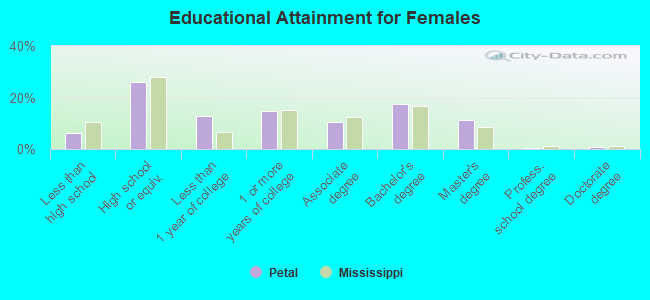
Education attainment for females 25 years and older:
- No schooling: 13
- Nursery to 4th grade: 0
- 5th and 6th grade: 7
- 7th and 8th grade: 56
- 9th grade: 20
- 10th grade: 17
- 11th grade: 77
- 12th grade, no diploma: 65
- High school graduate (or equivalency): 1,103
- Less than 1 year of college: 544
- Some college more than 1 year, no degree: 627
- Associate degree: 436
- Bachelor's degree: 743
- Master's degree: 476
- Professional school degree: 21
- Doctorate degree: 28


Housing units in structures:
- One, detached: 3,731
- One, attached: 20
- Two: 107
- 3 or 4: 135
- 5 to 9: 33
- 10 to 19: 149
- 20 to 49: 56
- Mobile homes: 241
Housing units lacking complete kitchen facilities in 2022: 2.6%
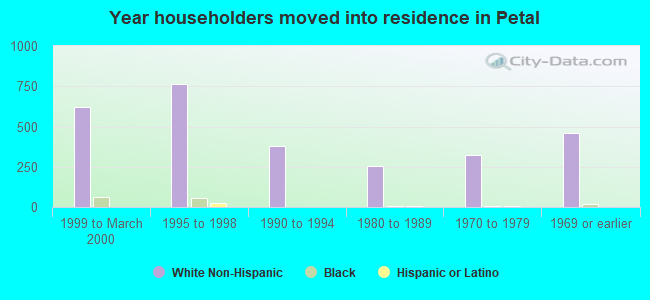
House/condo owner moved in on average 10 years ago
Renter moved in on average 3 years ago
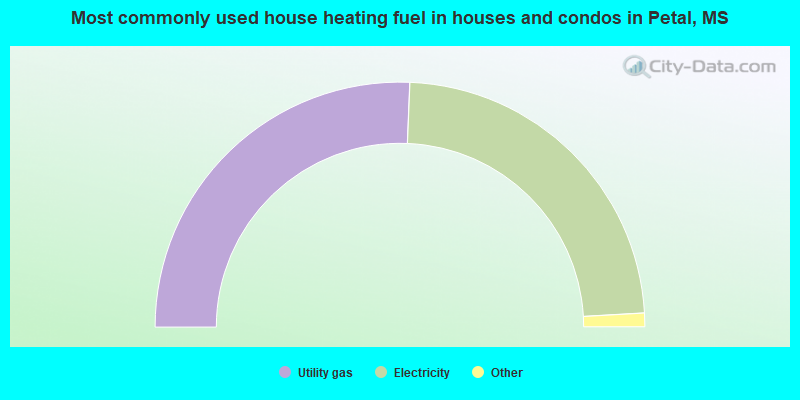
- 51.3%Utility gas
- 46.9%Electricity
- 1.3%Bottled, tank, or LP gas
- 0.5%No fuel used
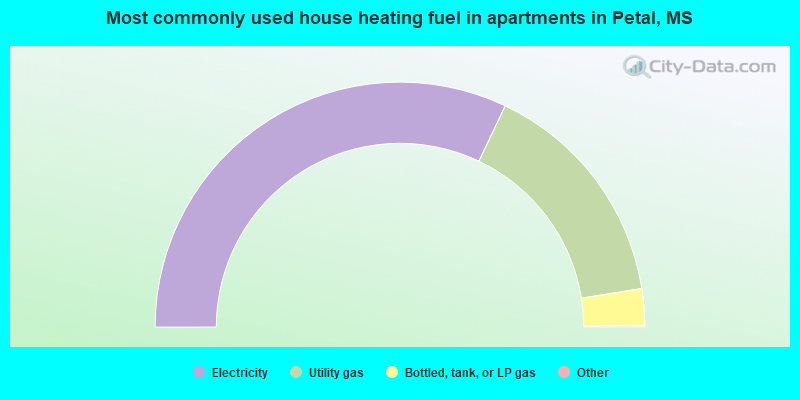
- 64.3%Electricity
- 30.9%Utility gas
- 4.8%Bottled, tank, or LP gas
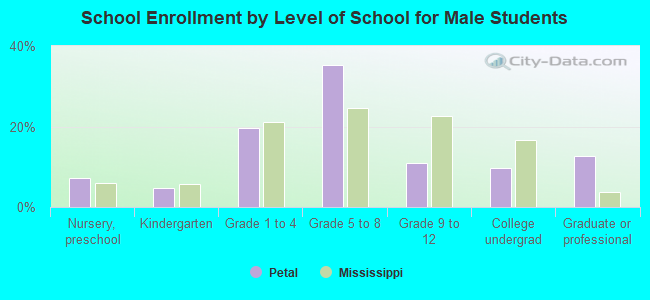
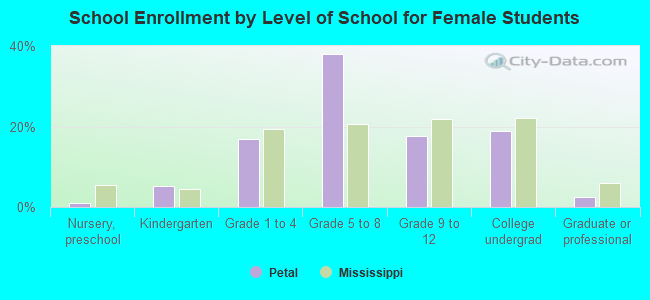
Private vs. public school enrollment:
| Here: | 10.5% |
| Mississippi: | 16.1% |
| Here: | 4.0% |
| Mississippi: | 14.6% |
| Here: | 8.7% |
| Mississippi: | 12.8% |