Housing density: 529 houses/condos per square mile
Median price asked for vacant for-sale houses and condos in 2022 in this county: $131,871.
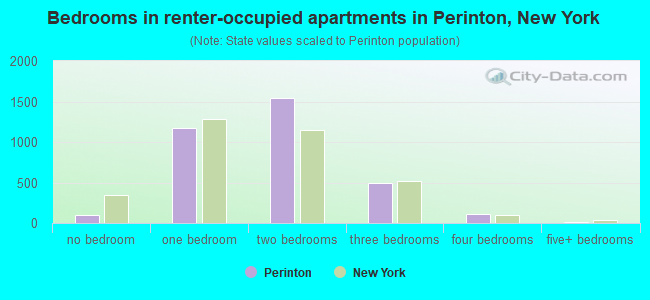
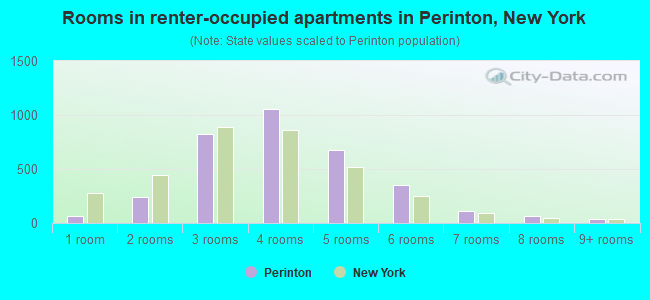
Median contract rent in 2022: $1,166 (lower quartile is $871, upper quartile is $1,429)
Median rent asked for vacant for-rent units in 2022: $1,260
Median gross rent in Perinton, NY in 2022: $1,262
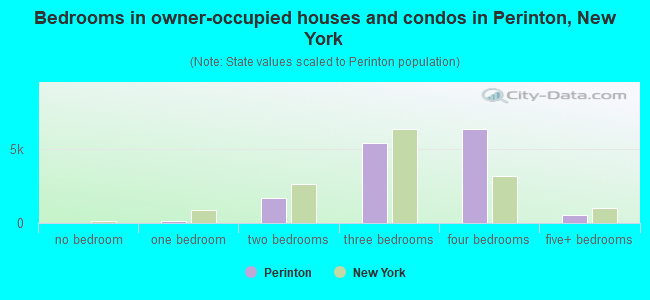
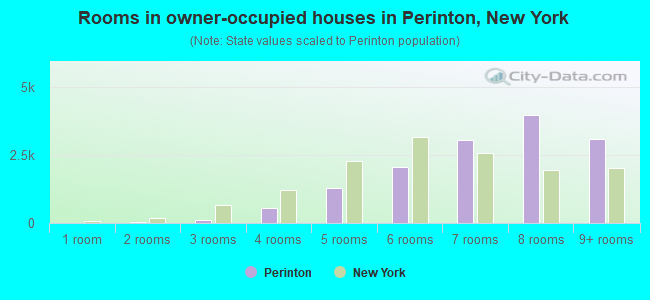
Housing units in Perinton with a mortgage: 10,683 (754 second mortgage, 1,953 home equity loan, 35 both second mortgage and home equity loan) Houses without a mortgage: 2,543
In family households: 570,195 (118,793 male householders, 65,460 female householders)
129,638 spouses, 208,825 children (196,800 natural, 4,967 adopted, 7,058 stepchildren), 12,314 grandchildren, 5,890 brothers or sisters, 5,273 parents, foster children, 6,253 other relatives, 14,824 non-relatives
In nonfamily households: 147,866 (53,529 male householders (39,699 living alone)), 62,640 female householders (51,939 living alone)), 31,697 nonrelatives
In group quarters: 26,283 (7,361 institutionalized population)
118,130 married couples with children.
54,341 single-parent households (8,323 men, 46,018 women).
91.4% of residents of Perinton speak English at home.
1.6% of residents speak Spanish at home (76% speak English very well, 11% speak English well, 13% speak English not well).
5.0% of residents speak other Indo-European language at home (74% speak English very well, 16% speak English well, 8% speak English not well, 2% don't speak English at all).
1.7% of residents speak Asian or Pacific Island language at home (57% speak English very well, 23% speak English well, 19% speak English not well, 1% don't speak English at all).
0.3% of residents speak other language at home (57% speak English very well, 25% speak English well, 18% speak English not well).
Foreign born population: 3,174 (6.7%)
(68.9% of them are naturalized citizens)
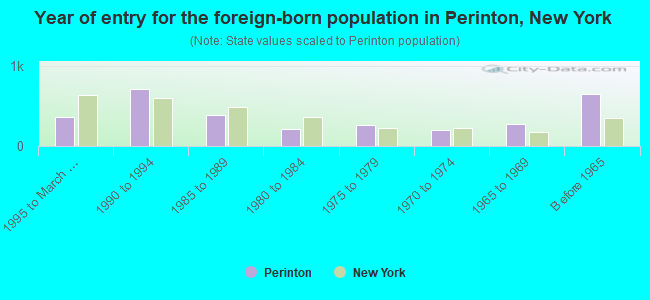
Year of entry for the foreign-born population in Perinton, New York
3641995 to March 2000
7051990 to 1994
3871985 to 1989
2131980 to 1984
2651975 to 1979
1971970 to 1974
2791965 to 1969
647Before 1965
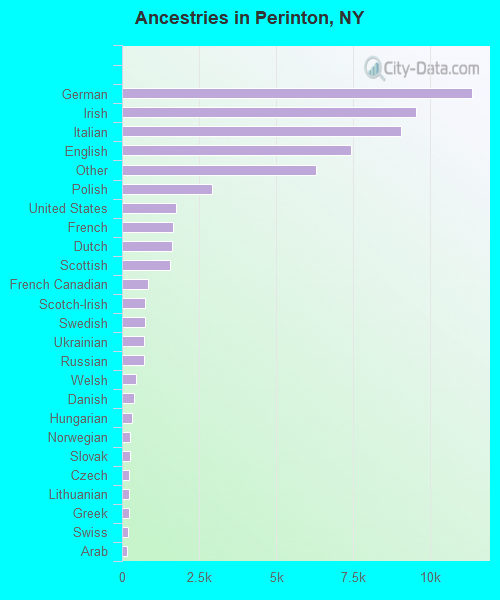
First ancestries reported:
German: 11,338 (19.0%)
Irish: 9,536 (15.9%)
Italian: 9,046 (15.1%)
English: 7,417 (12.4%)
Other: 6,303 (10.5%)
Polish: 2,924 (4.9%)
United States: 1,754 (2.9%)
French: 1,662 (2.8%)
Dutch: 1,612 (2.7%)
Scottish: 1,543 (2.6%)
French Canadian: 838 (1.4%)
Scotch-Irish: 762 (1.3%)
Swedish: 740 (1.2%)
Ukrainian: 709 (1.2%)
Russian: 703 (1.2%)
Welsh: 446 (0.7%)
Danish: 377 (0.6%)
Hungarian: 323 (0.5%)
Norwegian: 253 (0.4%)
Slovak: 247 (0.4%)
Czech: 239 (0.4%)
Lithuanian: 228 (0.4%)
Greek: 216 (0.4%)
Swiss: 185 (0.3%)
Arab: 178 (0.3%)
Portuguese: 102 (0.2%)
West Indian: 72 (0.1%)
Subsaharan African: 50 (0.08%)
Most common places of birth for foreign-born residents (%):
Canada
Perinton:
11.7% (359)
New York:
1.4% (54,876)
Korea
Perinton:
9.5% (291)
New York:
2.5% (97,933)
India
Perinton:
8.0% (244)
New York:
3.0% (117,238)
Italy
Perinton:
6.9% (211)
New York:
3.8% (147,729)
United Kingdom
Perinton:
6.7% (206)
New York:
1.6% (62,237)
Ukraine
Perinton:
6.6% (202)
New York:
2.1% (82,238)
Vietnam
Perinton:
5.6% (170)
New York:
0.6% (25,141)
Germany
Perinton:
4.8% (146)
New York:
1.8% (69,327)
China, excluding Hong Kong and Taiwan
Perinton:
3.8% (117)
New York:
6.0% (233,766)
Laos
Perinton:
3.2% (97)
New York:
0.1% (3,170)
Brazil
Perinton:
2.3% (69)
New York:
0.6% (22,265)
Russia
Perinton:
2.2% (67)
New York:
2.4% (94,595)
Armenia
Perinton:
1.7% (52)
New York:
0.1% (1,981)
Poland
Perinton:
1.7% (51)
New York:
2.4% (93,187)
Pakistan
Perinton:
1.5% (46)
New York:
1.3% (51,055)
Taiwan
Perinton:
1.5% (46)
New York:
0.8% (30,473)
Place of birth for U.S.-born residents:
This state: 33,423
Other state: 9,317
Northeast: 3,869
Midwest: 2,695
South: 1,795
West: 958
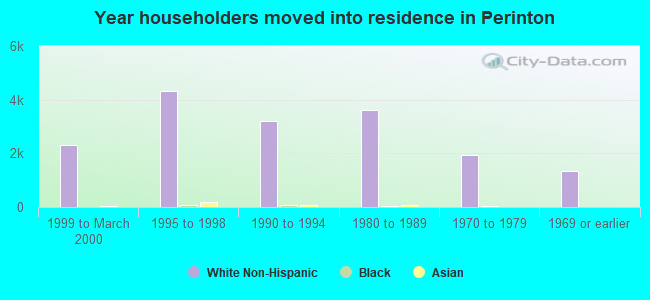
62% of Perinton residents lived in the same house 5 years ago. Out of people who lived in different houses, 67% lived in this county. Out of people who lived in different counties, 52% lived in New York.
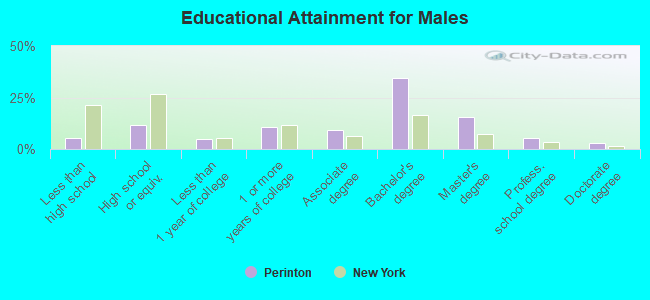
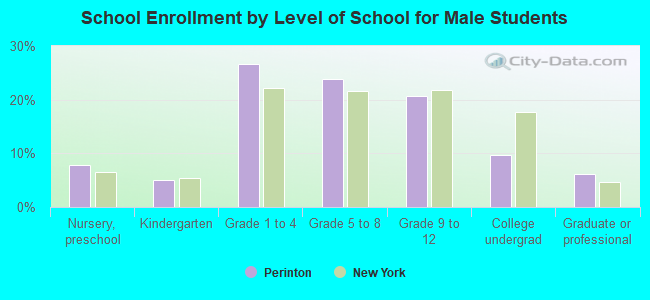
Education attainment for males 25 years and older:
No schooling: 13
Nursery to 4th grade: 26
5th and 6th grade: 102
7th and 8th grade: 76
9th grade: 104
10th grade: 120
11th grade: 150
12th grade, no diploma: 180
High school graduate (or equivalency): 1,735
Less than 1 year of college: 732
Some college more than 1 year, no degree: 1,562
Associate degree: 1,390
Bachelor's degree: 5,074
Master's degree: 2,334
Professional school degree: 773
Doctorate degree: 427
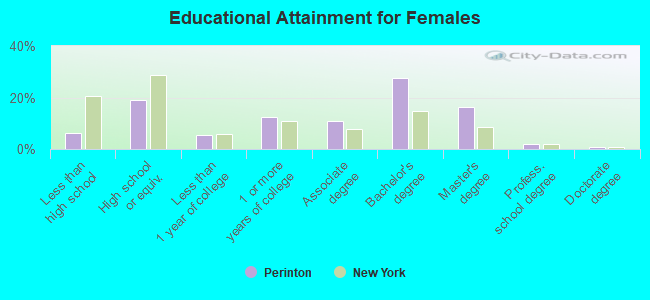
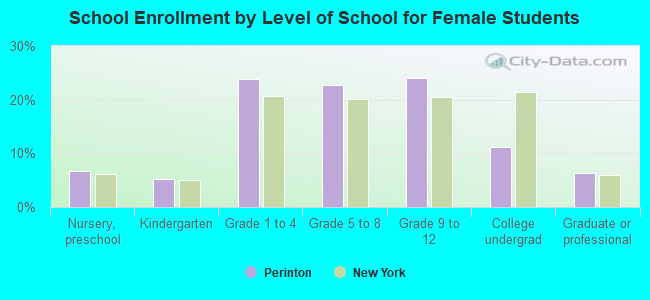
Education attainment for females 25 years and older:
No schooling: 55
Nursery to 4th grade: 31
5th and 6th grade: 52
7th and 8th grade: 200
9th grade: 155
10th grade: 192
11th grade: 130
12th grade, no diploma: 208
High school graduate (or equivalency): 3,163
Less than 1 year of college: 924
Some college more than 1 year, no degree: 2,051
Associate degree: 1,791
Bachelor's degree: 4,572
Master's degree: 2,734
Professional school degree: 292
Doctorate degree: 148
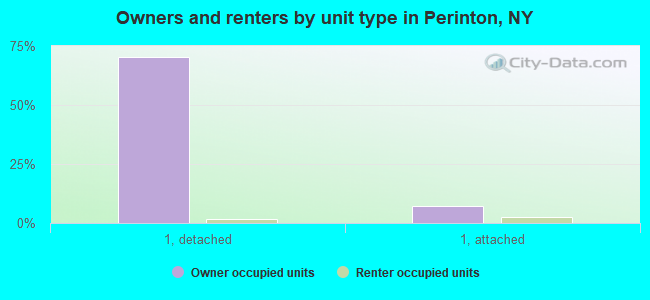
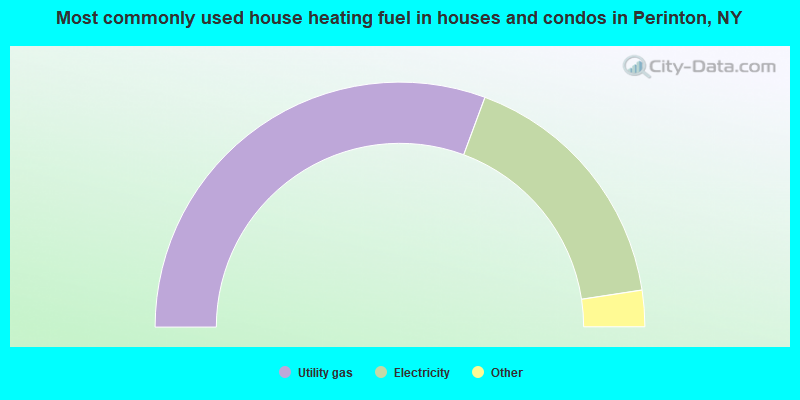
Housing units in structures:
One, detached: 12,846
One, attached: 1,785
Two: 661
3 or 4: 591
5 to 9: 1,207
10 to 19: 394
20 to 49: 92
50 or more: 449
Mobile homes: 7
Boats, RVs, vans, etc.: 9
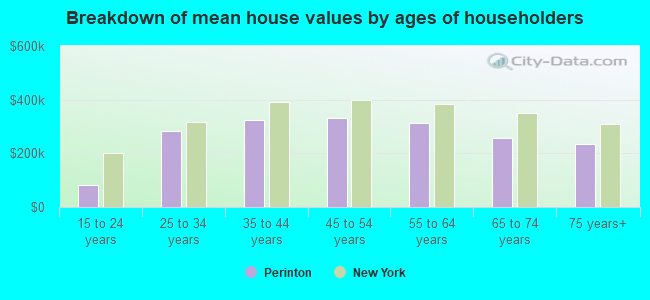
Median worth of mobile homes: $348,699
Housing units lacking complete plumbing facilities: 0.1%
Housing units lacking complete kitchen facilities: 0.0%