Peoria, AZ (Arizona) Houses and Residents
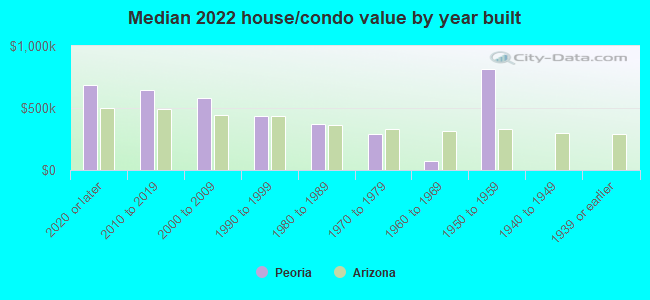
| Peoria: | $493,400 |
| Arizona: | $402,800 |
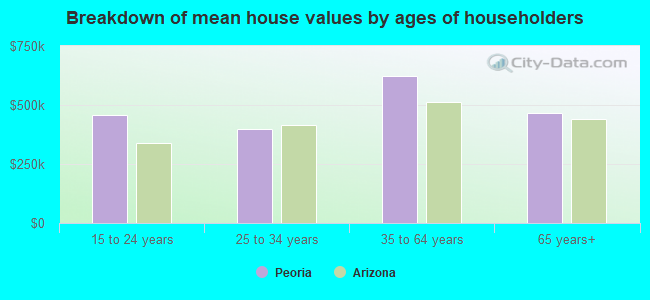
Mean price in 2022:
Detached houses: $563,426
Here: $563,426 State: $521,408 Townhouses or other attached units: $509,293
Here: $509,293 State: $387,465 In 2-unit structures: $261,754
Here: $261,754 State: $1,060,724 In 3-to-4-unit structures: $242,893
Here: $242,893 State: $342,505 In 5-or-more-unit structures: $248,567
Here: $248,567 State: $371,286 Mobile homes: $56,592
Here: $56,592 State: $141,516 Occupied boats, RVs, vans, etc.: $35,223
Here: $35,223 State: $60,504
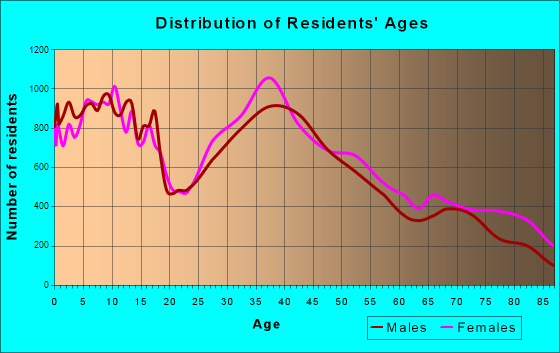
Total population: 166,934 (Urban population: 108,056, Rural population: 406 (all nonfarm))
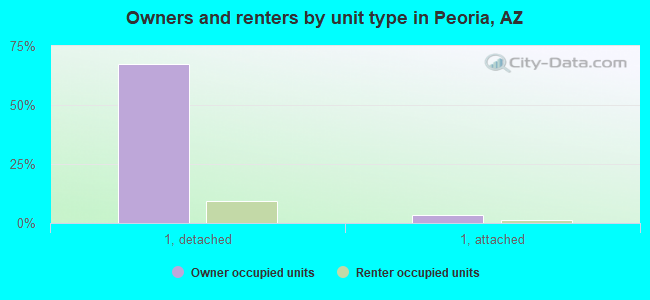
Houses: 79,443 (73,700 occupied: 55,486 owner occupied, 18,214 renter occupied)
| % of renters here: | 25% |
| State: | 33% |
Housing density: 575 houses/condos per square mile
Median price asked for vacant for-sale houses and condos in 2022: $520,501.
Median contract rent in 2022: $1,710 (lower quartile is $1,355, upper quartile is over $2,000)
Median rent asked for vacant for-rent units in 2022: $2,757
Median gross rent in Peoria, AZ in 2022: $1,860
Housing units in Peoria with a mortgage: 37,707 (4,513 second mortgage, 62 home equity loan, 3,625 both second mortgage and home equity loan)
Houses without a mortgage: 381
Median household income for houses/condos with a mortgage: $120,010
Median household income for apartments without a mortgage: $78,317
Median monthly housing costs: $1,589
Compare current foreclosures in Peoria, AZ:
| Photo | Address | Area | Beds / Baths | Price | Details |
|---|---|---|---|---|---|

|
#1
W Townley Ave
Peoria, AZ 85345
|
1,472 sq. feet
|
2 baths 3 beds |
show details | |

|
#2
N 85th Dr
Peoria, AZ 85345
|
1,936 sq. feet
|
2 baths 4 beds |
show details | |

|
#3
W Mescal St
Peoria, AZ 85345
|
1,382 sq. feet
|
1 baths 3 beds |
show details | |

|
#4
W Red Hawk Dr
Peoria, AZ 85383
|
2,882 sq. feet
|
3 baths 3 beds |
show details | |

|
#5
W Paso Trl
Peoria, AZ 85383
|
3,376 sq. feet
|
3 baths 5 beds |
show details | |

|
#6
W Via Del Sol
Peoria, AZ 85383
|
1,735 sq. feet
|
2 baths 3 beds |
show details | |

|
#7
N 69th Ave
Peoria, AZ 85382
|
2,304 sq. feet
|
2 baths 4 beds |
show details | |

|
#8
W Eva St
Peoria, AZ 85345
|
1,378 sq. feet
|
2 baths 3 beds |
show details | |

|
#9
W Seldon Ln
Peoria, AZ 85345
|
1,968 sq. feet
|
2 baths 3 beds |
show details | |

|
#10
W Ironwood Dr Apt B
Peoria, AZ 85345
|
1,144 sq. feet
|
1 baths - beds |
show details |
| Photo | Address | Area | Beds / Baths | Price | Details |
|---|---|---|---|---|---|

|
#11
W Vogel Ave
Peoria, AZ 85345
|
1,704 sq. feet
|
3 baths 3 beds |
show details | |

|
#12
N 75th Dr
Peoria, AZ 85381
|
2,644 sq. feet
|
4 baths 4 beds |
show details | |

|
#13
W Irma Ln
Peoria, AZ 85382
|
1,554 sq. feet
|
2 baths 3 beds |
show details | |

|
#14
N 81st Ave
Peoria, AZ 85345
|
1,501 sq. feet
|
2 baths 4 beds |
show details | |

|
#15
W Alex Ave
Peoria, AZ 85382
|
2,481 sq. feet
|
4 baths 4 beds |
show details | |

|
#16
W Deanna Dr
Peoria, AZ 85382
|
- sq. feet
|
2 baths 3 beds |
show details | |

|
#17
W Oberlin Way
Peoria, AZ 85383
|
2,602 sq. feet
|
3 baths 4 beds |
show details | |

|
#18
N 81st Dr
Peoria, AZ 85345
|
1,401 sq. feet
|
3 baths 3 beds |
show details | |

|
#19
W Yucca St
Peoria, AZ 85345
|
1,461 sq. feet
|
2 baths 3 beds |
show details | |

|
#20
W Sweetwater Ave
Peoria, AZ 85381
|
2,009 sq. feet
|
2 baths - beds |
show details |
| Photo | Address | Area | Beds / Baths | Price | Details |
|---|---|---|---|---|---|

|
#21
N 126th Ave
Peoria, AZ 85383
|
4,516 sq. feet
|
5 baths - beds |
show details | |

|
#22
W Echo Ln
Peoria, AZ 85345
|
1,646 sq. feet
|
2 baths - beds |
show details | |

|
#23
W Grovers Ave
Peoria, AZ 85382
|
1,115 sq. feet
|
2 baths - beds |
show details | |

|
#24
W Yucca St
Peoria, AZ 85345
|
1,429 sq. feet
|
2 baths - beds |
show details | |

|
#25
W Remuda Dr
Peoria, AZ 85383
|
2,804 sq. feet
|
3 baths - beds |
show details | |

|
#26
W Hearn Rd
Peoria, AZ 85381
|
2,493 sq. feet
|
3 baths - beds |
show details | |

|
#27
N 98th Dr
Peoria, AZ 85383
|
2,646 sq. feet
|
3 baths - beds |
show details | |

|
#28
North 98th Drive
Peoria, AZ 85383
|
2,646 sq. feet
|
3 baths - beds |
show details | |

|
#29
W Remuda Dr
Peoria, AZ 85383
|
1,888 sq. feet
|
3 baths - beds |
show details | |

|
#30
N 80th Ave
Peoria, AZ 85345
|
1,024 sq. feet
|
1 baths - beds |
show details |
| Photo | Address | Area | Beds / Baths | Price | Details |
|---|---|---|---|---|---|

|
#31
W Bajada Rd
Peoria, AZ 85383
|
3,115 sq. feet
|
4 baths - beds |
show details | |

|
#32
N 91st Dr
Peoria, AZ 85382
|
2,310 sq. feet
|
3 baths - beds |
show details | |

|
#33
W Loma Ln
Peoria, AZ 85345
|
810 sq. feet
|
1 baths - beds |
show details | |

|
#34
N 72nd Ln
Peoria, AZ 85383
|
3,884 sq. feet
|
4 baths - beds |
show details | |

|
#35
W Cheryl Dr
Peoria, AZ 85345
|
1,852 sq. feet
|
2 baths - beds |
show details | |

|
#36
W Oraibi Dr
Peoria, AZ 85382
|
1,858 sq. feet
|
2 baths - beds |
show details | |

|
#37
W Paso Trl
Peoria, AZ 85383
|
3,099 sq. feet
|
3 baths - beds |
show details | |

|
#38
N 88th Ave
Peoria, AZ 85382
|
1,228 sq. feet
|
2 baths - beds |
show details | |

|
#39
W Kings Ave
Peoria, AZ 85382
|
1,873 sq. feet
|
2 baths - beds |
show details | |

|
#40
W El Cortez Pl Apt 3169
Peoria, AZ 85383
|
- sq. feet
|
- baths - beds |
show details |
| Photo | Address | Area | Beds / Baths | Price | Details |
|---|---|---|---|---|---|

|
#41
W Paradise Dr
Peoria, AZ 85345
|
1,380 sq. feet
|
- baths - beds |
show details | |

|
#42
W Tether Trl
Peoria, AZ 85383
|
- sq. feet
|
- baths - beds |
show details | |

|
#43
W Rock Springs Dr
Peoria, AZ 85383
|
4,023 sq. feet
|
- baths - beds |
show details | |

|
#44
N 109th Dr
Peoria, AZ 85345
|
1,500 sq. feet
|
- baths - beds |
show details | |

|
#45
N 83rd Gln
Peoria, AZ 85383
|
1,942 sq. feet
|
- baths - beds |
show details | |

|
#46
W Fallen Leaf Ln
Peoria, AZ 85383
|
- sq. feet
|
- baths - beds |
show details | |

|
#47
W Fullam St
Peoria, AZ 85382
|
1,515 sq. feet
|
- baths - beds |
show details | |

|
#48
W Olive Ave # 1246
Peoria, AZ 85345
|
- sq. feet
|
- baths - beds |
show details | |

|
#49
N 85th Ln
Peoria, AZ 85382
|
1,491 sq. feet
|
- baths - beds |
show details | |

|
Check over 1 million property listings on Foreclosure.com!
|
browse all offers | |||

Latest news about housing in Peoria, AZ collected exclusively by city-data.com from local newspapers, TV, and radio stations

 | Why does the cost of houses in Peoria vary so much? (8 replies) |
| Cave Creek Homes (27 replies) |
| Is 85032 A Good Area for Homes? (16 replies) |
| Any options to prerent a house in Peoria before we move from Oklahoma? (8 replies) |
| Need recommendations for apartment rental under $1K/mo in NW valley (4 replies) |
| Gilbert, Arizona is #3 best place to buy a home (127 replies) |
Median year apartment built: 1998
Household type by relationship:
Households: 197,862- Male householders: 38,602 (6,960 living alone), Female householders: 35,098 (9,262 living alone)
42,276 spouses (41,786 opposite-sex spouses), 4,859 unmarried partners, (4,754 opposite-sex unmarried partners), 54,194 children (50,335 natural, 1,386 adopted, 2,473 stepchildren), 5,011 grandchildren, 2,604 brothers or sisters, 4,867 parents, 143 foster children, 3,035 other relatives, 4,882 non-relatives
- In group quarters: 2,291
Size of family households: 23,245 2-persons, 11,650 3-persons, 9,970 4-persons, 5,018 5-persons, 2,120 6-persons, 1,163 7-or-more-persons.
Size of nonfamily households: 16,222 1-person, 3,763 2-persons, 381 3-persons, 58 4-persons, 110 5-persons.
29,645 married couples with children.
6,472 single-parent households (1,772 men, 4,700 women).
82.8% of residents of Peoria speak English at home.
9.7% of residents speak Spanish at home (73% speak English very well, 16% speak English well, 8% speak English not well, 3% don't speak English at all).
2.6% of residents speak other Indo-European language at home (77% speak English very well, 17% speak English well, 5% speak English not well, 1% don't speak English at all).
3.6% of residents speak Asian or Pacific Island language at home (60% speak English very well, 25% speak English well, 12% speak English not well, 3% don't speak English at all).
1.4% of residents speak other language at home (66% speak English very well, 23% speak English well, 11% speak English not well, 1% don't speak English at all).
Foreign born population: 23,379 (11.8%)
(69.4% of them are naturalized citizens)
| Here: | 6.3 |
| State: | 6.0 |
| Here: | 4.3 |
| State: | 4.1 |
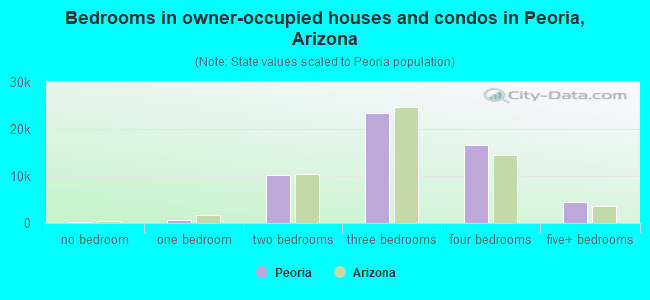
- Bedrooms in owner-occupied houses and condos in Peoria, Arizona
- 121no bedroom
- 6861 bedroom
- 10,3042 bedrooms
- 23,4363 bedrooms
- 16,5134 bedrooms
- 4,4265+ bedrooms
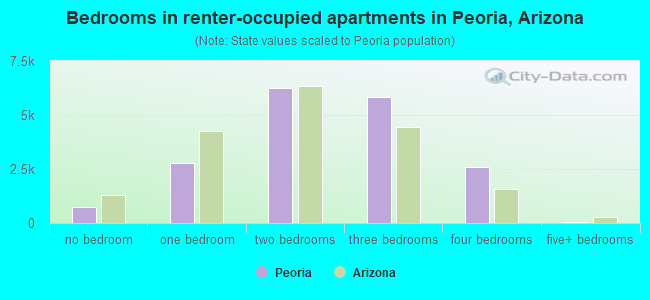
- Bedrooms in renter-occupied apartments in Peoria, Arizona
- 718no bedroom
- 2,7871 bedroom
- 6,2562 bedrooms
- 5,8193 bedrooms
- 2,5774 bedrooms
- 575+ bedrooms
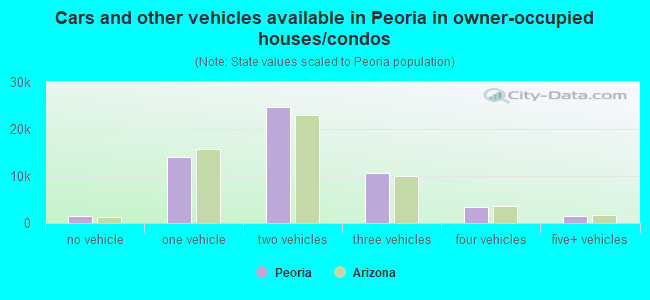
- Cars and other vehicles available in Peoria in owner-occupied houses/condos
- 1,390no vehicle
- 13,9651 vehicle
- 24,7772 vehicles
- 10,5733 vehicles
- 3,3304 vehicles
- 1,4515+ vehicles
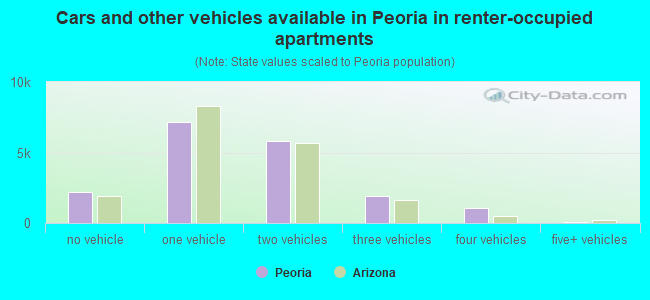
- Cars and other vehicles available in Peoria in renter-occupied apartments
- 2,183no vehicle
- 7,1721 vehicle
- 5,8212 vehicles
- 1,8943 vehicles
- 1,0474 vehicles
- 975+ vehicles
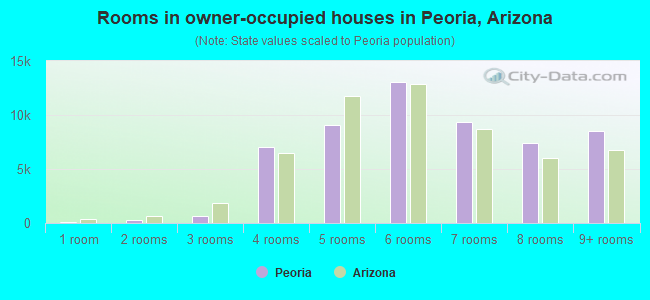
- Rooms in owner-occupied houses in Peoria, Arizona
- 1211 room
- 2442 rooms
- 6833 rooms
- 7,0424 rooms
- 9,0745 rooms
- 13,0556 rooms
- 9,3147 rooms
- 7,4048 rooms
- 8,5499+ rooms
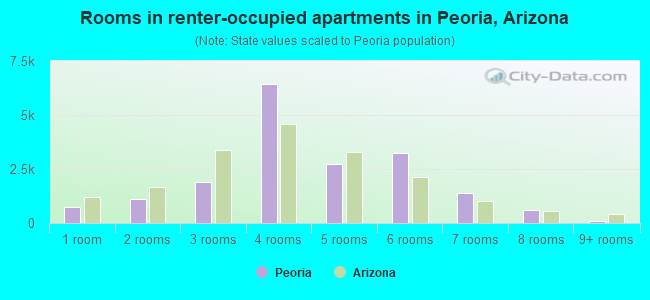
- Rooms in renter-occupied apartments in Peoria, Arizona
- 7181 room
- 1,1192 rooms
- 1,8803 rooms
- 6,4144 rooms
- 2,7455 rooms
- 3,2296 rooms
- 1,4097 rooms
- 5968 rooms
- 1049+ rooms
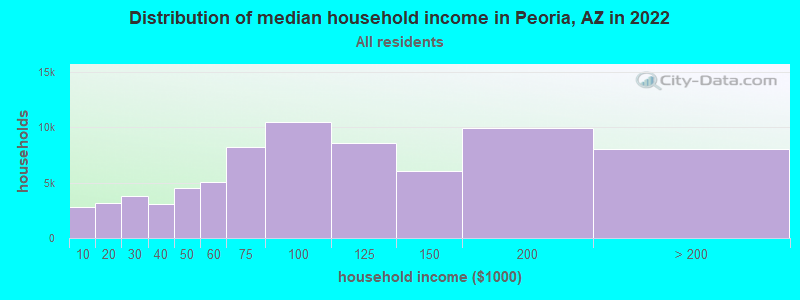
Peoria, AZ household income distribution

- 2,788Less than $10,000
- 3,125$10,000 to $19,999
- 3,813$20,000 to $29,999
- 3,077$30,000 to $39,999
- 4,560$40,000 to $49,999
- 5,089$50,000 to $59,999
- 8,192$60,000 to $74,999
- 10,484$75,000 to $99,999
- 8,570$100,000 to $124,999
- 6,067$125,000 to $149,999
- 9,924$150,000 to $199,999
- 8,011$200,000 or more
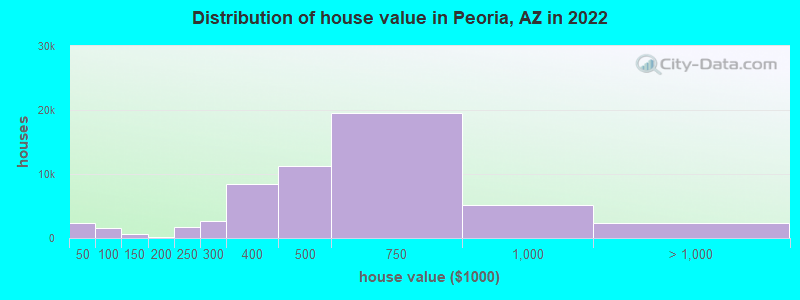
Home value of owner - occupied houses in 2022 in Peoria, AZ
-
- 592Less than $10,000
- 288$10,000 to $14,999
- 69$15,000 to $19,999
- 51$20,000 to $24,999
- 73$25,000 to $29,999
- 613$30,000 to $34,999
- 223$35,000 to $39,999
- 360$40,000 to $49,999
- 491$50,000 to $59,999
- 689$60,000 to $69,999
- 697$100,000 to $124,999
- 54$150,000 to $174,999
- 156$175,000 to $199,999
- 1,711$200,000 to $249,999
- 2,710$250,000 to $299,999
- 8,509$300,000 to $399,999
- 11,194$400,000 to $499,999
- 19,455$500,000 to $749,999
- 5,176$750,000 to $999,999
- 1,438$1,000,000 to $1,499,999
- 290$1,500,000 to $1,999,999
- 647$2,000,000 or more
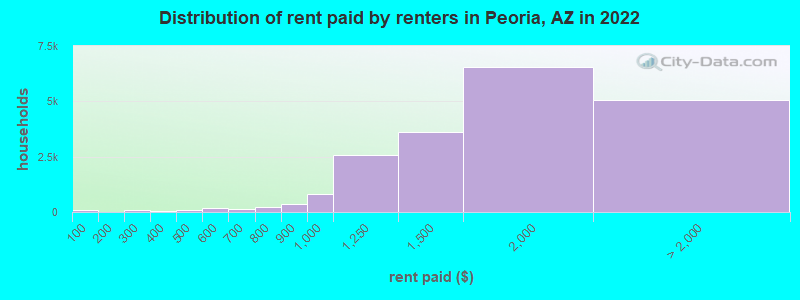
Rent paid by renters in 2022 in Peoria, AZ
-
- 77Less than $100
- 9$100 to $149
- 100$250 to $299
- 13$300 to $349
- 9$350 to $399
- 51$400 to $449
- 53$450 to $499
- 145$500 to $549
- 21$550 to $599
- 82$600 to $649
- 61$650 to $699
- 120$700 to $749
- 102$750 to $799
- 381$800 to $899
- 795$900 to $999
- 2,578$1,000 to $1,249
- 3,613$1,250 to $1,499
- 6,569$1,500 to $1,999
- 2,878$2,000 to $2,499
- 1,031$2,500 to $2,999
- 307$3,000 to $3,499
- 483$3,500 or more
- 363No cash rent
Percentage of workers working in this county: 98.9%
Number of people working at home: 18,969 (20.0% of all workers)
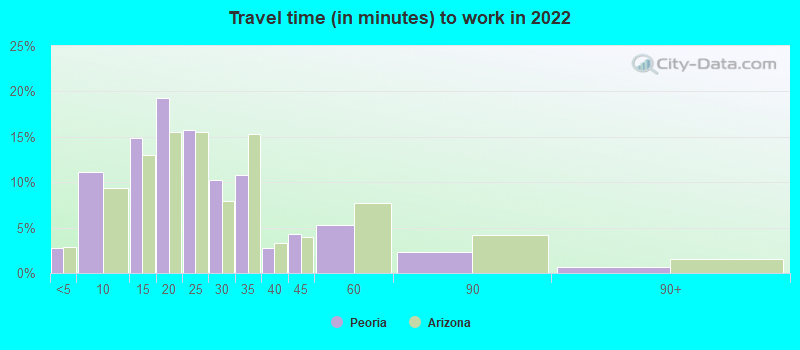
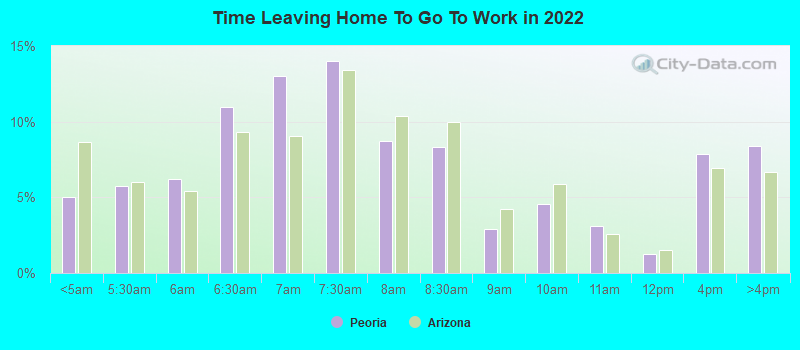
Travel time to work (commute)
- Less than 5 minutes: 1,184
- 5 to 9 minutes: 6,772
- 10 to 14 minutes: 6,335
- 15 to 19 minutes: 10,408
- 20 to 24 minutes: 13,651
- 25 to 29 minutes: 6,516
- 30 to 34 minutes: 10,759
- 35 to 39 minutes: 2,972
- 40 to 44 minutes: 2,875
- 45 to 59 minutes: 9,173
- 60 to 89 minutes: 4,388
- 90 or more minutes: 659
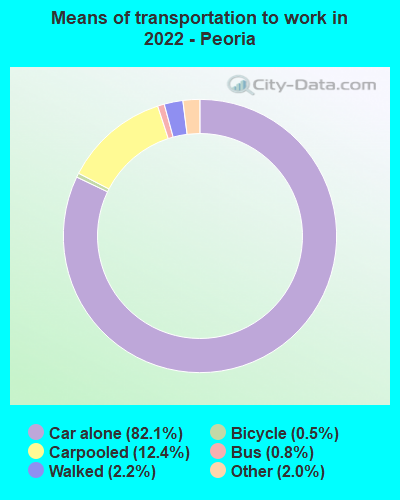
Means of transportation to work:
- Drove a car alone: 42,930 (60.2%)
- Carpooled: 6,489 (9.1%)
- Bus: 406 (0.6%)
- Taxi: 1,039 (1.5%)
- Bicycle: 267 (0.4%)
- Walked: 1,157 (1.6%)
- Worked at home: 18,969 (26.6%)
- Unemployment by race in 2022
- Unemployment rate for White non-Hispanic residents
- 3.4%Males
- 1.9%Females
- Unemployment rate for Black residents
- 8.6%Males
- 8.7%Females
- Unemployment rate for American Indian and Alaska Native residents
- 2.0%Males
- 2.7%Females
- Unemployment rate for Asian residents
- 1.3%Males
- 2.5%Females
- Unemployment rate for other race residents
- 0.8%Males
- 3.1%Females
- Unemployment rate for two or more race residents
- 2.5%Males
- 4.0%Females
- Unemployment rate for Hispanic or Latino residents
- 1.9%Males
- 3.6%Females
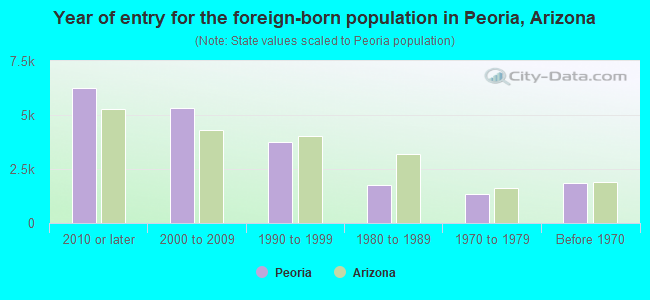
- Year of entry for the foreign-born population in Peoria, Arizona
- 6,2522010 or later
- 5,3442000 to 2009
- 3,7721990 to 1999
- 1,7371980 to 1989
- 1,3221970 to 1979
- 1,855Before 1970
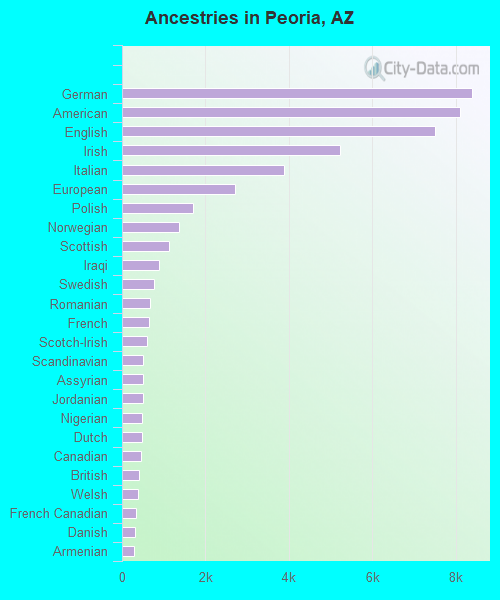
First ancestries reported:
- German: 8,379 (9.2%)
- American: 8,099 (8.9%)
- English: 7,515 (8.2%)
- Irish: 5,234 (5.7%)
- Italian: 3,878 (4.2%)
- European: 2,718 (3.0%)
- Polish: 1,705 (1.9%)
- Norwegian: 1,374 (1.5%)
- Scottish: 1,120 (1.2%)
- Iraqi: 885 (1.0%)
- Swedish: 779 (0.9%)
- Romanian: 661 (0.7%)
- French: 643 (0.7%)
- Scotch-Irish: 592 (0.6%)
- Scandinavian: 514 (0.6%)
- Assyrian: 504 (0.6%)
- Jordanian: 503 (0.6%)
- Nigerian: 472 (0.5%)
- Dutch: 469 (0.5%)
- Canadian: 446 (0.5%)
- British: 418 (0.5%)
- Welsh: 385 (0.4%)
- French Canadian: 338 (0.4%)
- Danish: 312 (0.3%)
- Armenian: 283 (0.3%)
- Greek: 275 (0.3%)
- Finnish: 273 (0.3%)
- Portuguese: 244 (0.3%)
- Eastern European: 244 (0.3%)
- Haitian: 238 (0.3%)
- African: 210 (0.2%)
- Hungarian: 183 (0.2%)
- Russian: 173 (0.2%)
- Yugoslavian: 170 (0.2%)
- Afghan: 167 (0.2%)
- Egyptian: 166 (0.2%)
- Lebanese: 153 (0.2%)
- Ethiopian: 145 (0.2%)
- Ukrainian: 134 (0.1%)
- Arab: 131 (0.1%)
- Slavic: 125 (0.1%)
- Serbian: 121 (0.1%)
- Northern European: 121 (0.1%)
- Macedonian: 109 (0.1%)
- Croatian: 101 (0.1%)
- Czech: 101 (0.1%)
- Swiss: 85 (0.09%)
- Slovak: 77 (0.08%)
- Turkish: 75 (0.08%)
- Austrian: 68 (0.07%)
- Lithuanian: 61 (0.07%)
- Estonian: 59 (0.06%)
- Albanian: 48 (0.05%)
- South African: 46 (0.05%)
- Trinidadian and Tobagonian: 45 (0.05%)
- Czechoslovakian: 44 (0.05%)
- Pennsylvania German: 42 (0.05%)
- Australian: 35 (0.04%)
- Belgian: 35 (0.04%)
- Iranian: 33 (0.04%)
- Palestinian: 31 (0.03%)
- Carpatho Rusyn: 27 (0.03%)
- Sudanese: 26 (0.03%)
- Syrian: 26 (0.03%)
- Cape Verdean: 24 (0.03%)
- Moroccan: 21 (0.02%)
- Slovene: 14 (0.02%)
- Bulgarian: 13 (0.01%)
- Jamaican: 12 (0.01%)
- Maltese: 11 (0.01%)
- Ghanaian: 10 (0.01%)
- Somali: 9 (0.01%)
- Luxembourger: 8 (0.01%)
- Zimbabwean: 7 (0.01%)
- Brazilian: 6 (0.01%)
Most common places of birth for foreign-born residents (%):
| Peoria: | 23.6% (5,083) |
| Arizona: | 53.4% (500,086) |
| Peoria: | 14.1% (3,045) |
| Arizona: | 4.5% (41,719) |
| Peoria: | 7.7% (1,650) |
| Arizona: | 1.0% (9,335) |
| Peoria: | 5.7% (1,227) |
| Arizona: | 2.1% (19,199) |
| Peoria: | 5.3% (1,139) |
| Arizona: | 3.2% (30,378) |
| Peoria: | 3.8% (812) |
| Arizona: | 4.3% (40,102) |
| Peoria: | 3.2% (690) |
| Arizona: | 1.0% (8,899) |
| Peoria: | 2.6% (562) |
| Arizona: | 1.2% (11,275) |
| Peoria: | 2.4% (510) |
| Arizona: | 2.3% (21,275) |
| Peoria: | 2.3% (506) |
| Arizona: | 0.6% (5,792) |
| Peoria: | 1.8% (386) |
| Arizona: | 0.2% (1,716) |
| Peoria: | 1.7% (369) |
| Arizona: | 1.5% (14,058) |
| Peoria: | 1.5% (330) |
| Arizona: | 0.3% (2,420) |
Place of birth for U.S.-born residents:
- This state: 75,478
- Other state: 95,519
- Northeast: 14,848
- Midwest: 33,315
- South: 13,349
- West: 34,007
88.1% of Peoria residents lived in the same house 1 years ago.
Out of people who lived in different houses, 43.7% lived in this county.
Out of people who lived in different counties, 10.5% lived in Arizona.
| Peoria: | 88.1% |
| State average: | 86.0% |
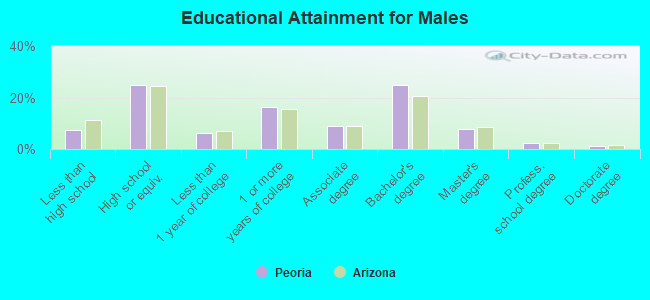
Education attainment for males 25 years and older:
- No schooling: 1,355
- Nursery to 4th grade: 173
- 5th and 6th grade: 429
- 7th and 8th grade: 385
- 9th grade: 0
- 10th grade: 705
- 11th grade: 630
- 12th grade, no diploma: 1,347
- High school graduate (or equivalency): 16,874
- Less than 1 year of college: 4,097
- Some college more than 1 year, no degree: 11,137
- Associate degree: 6,103
- Bachelor's degree: 16,693
- Master's degree: 5,195
- Professional school degree: 1,667
- Doctorate degree: 710
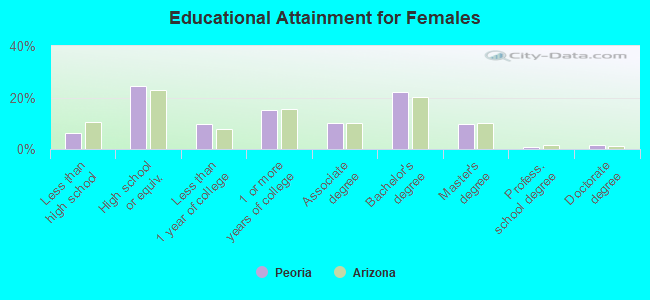
Education attainment for females 25 years and older:
- No schooling: 979
- Nursery to 4th grade: 328
- 5th and 6th grade: 160
- 7th and 8th grade: 174
- 9th grade: 133
- 10th grade: 1,085
- 11th grade: 563
- 12th grade, no diploma: 1,002
- High school graduate (or equivalency): 17,306
- Less than 1 year of college: 7,015
- Some college more than 1 year, no degree: 10,769
- Associate degree: 7,081
- Bachelor's degree: 15,813
- Master's degree: 7,009
- Professional school degree: 598
- Doctorate degree: 1,168
Housing units in structures:
- One, detached: 59,339
- One, attached: 4,246
- Two: 406
- 3 or 4: 477
- 5 to 9: 1,386
- 10 to 19: 3,051
- 20 to 49: 1,195
- 50 or more: 5,580
- Mobile homes: 3,763
Median worth of mobile homes: $46,300
Housing units lacking complete kitchen facilities in 2022: 1.3%
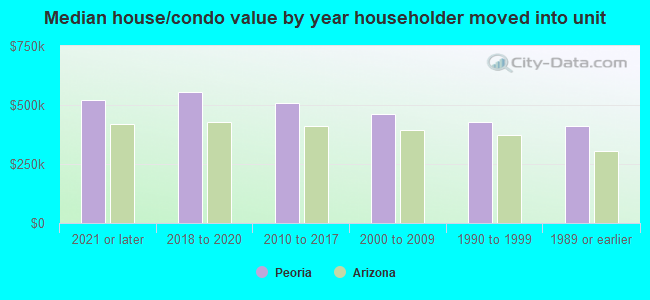
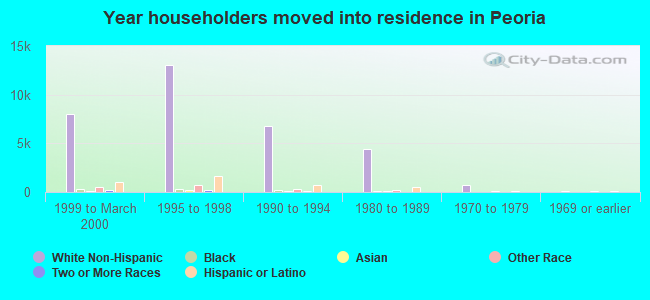
House/condo owner moved in on average 7 years ago
Renter moved in on average 2 years ago
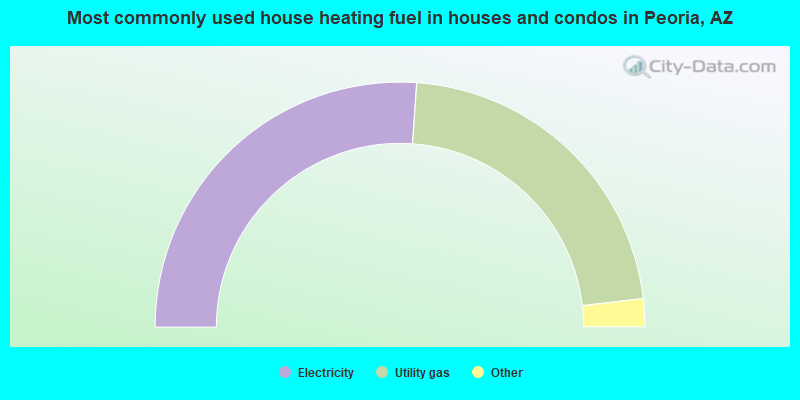
- 52.2%Electricity
- 44.1%Utility gas
- 1.6%Solar energy
- 1.3%Bottled, tank, or LP gas
- 0.5%No fuel used
- 0.3%Other fuel
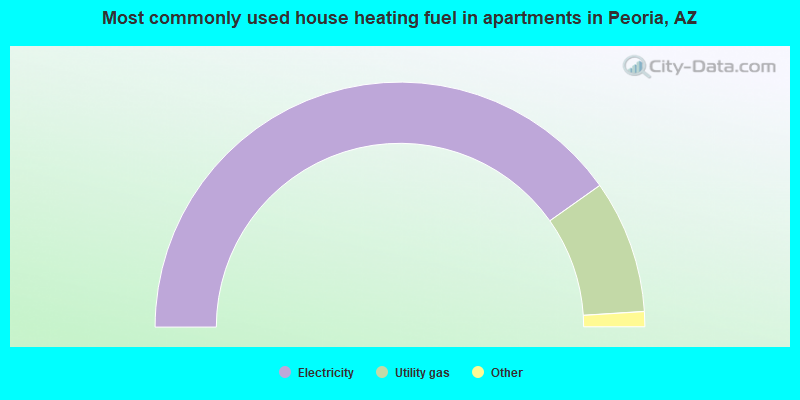
- 80.4%Electricity
- 17.6%Utility gas
- 1.4%No fuel used
- 0.4%Bottled, tank, or LP gas
- 0.1%Solar energy
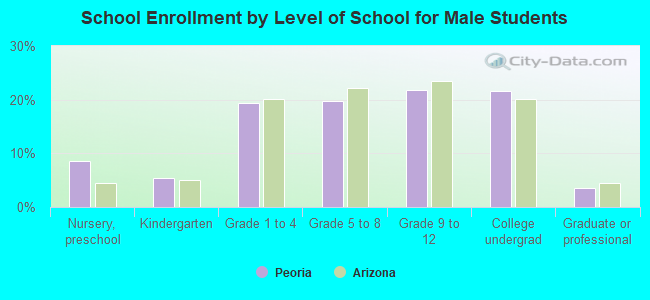
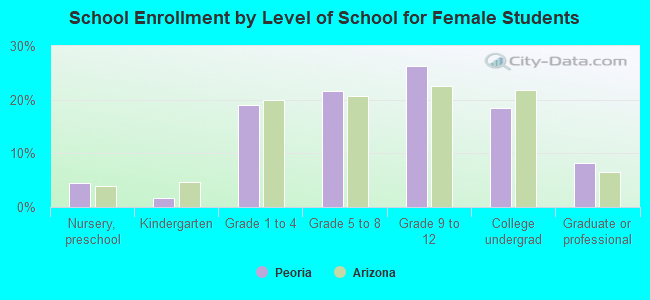
Private vs. public school enrollment:
| Here: | 16.7% |
| Arizona: | 10.4% |
| Here: | 6.8% |
| Arizona: | 8.8% |
| Here: | 21.4% |
| Arizona: | 13.1% |