Pendleton, OR (Oregon) Houses and Residents
| Pendleton: | $296,134 |
| Oregon: | $475,600 |
Total population: 16,904 (Urban population: 16,131 (all inside urban clusters), Rural population: 131 (all nonfarm))
Houses: 7,139 (6,111 occupied: 3,558 owner occupied, 2,968 renter occupied)
| % of renters here: | 45% |
| State: | 37% |
Housing density: 710 houses/condos per square mile
Median price asked for vacant for-sale houses and condos in 2022: $232,240.
Median contract rent in 2022: $740 (lower quartile is $617, upper quartile is $977)
Median rent asked for vacant for-rent units in 2022: $988
Median gross rent in Pendleton, OR in 2022: $948
Housing units in Pendleton with a mortgage: 2,215 (230 second mortgage, 0 home equity loan, 149 both second mortgage and home equity loan)
Houses without a mortgage: 23
Median household income for houses/condos with a mortgage: $112,153
Median household income for apartments without a mortgage: $85,896
Median monthly housing costs: $1,029
Compare current foreclosures near Pendleton, OR:
| Photo | Address | Area | Beds / Baths | Price | Details |
|---|---|---|---|---|---|

|
#1
SW 4th St
Pendleton, OR 97801
|
1,340 sq. feet
|
1 baths 3 beds |
show details | |

|
#2
SW 8th St
Pendleton, OR 97801
|
1,360 sq. feet
|
2 baths 3 beds |
show details | |

|
#3
SW 24th St
Pendleton, OR 97801
|
1,414 sq. feet
|
1 baths 3 beds |
show details | |

|
#4
SW Hailey Ave
Pendleton, OR 97801
|
1,399 sq. feet
|
1 baths 2 beds |
show details | |

|
#5
SW 30th St
Pendleton, OR 97801
|
1,059 sq. feet
|
1 baths 2 beds |
show details | |

|
#6
SW Court Ave
Pendleton, OR 97801
|
1,416 sq. feet
|
2 baths 3 beds |
show details | |

|
#7
SW Perkins Ave
Pendleton, OR 97801
|
1,560 sq. feet
|
2 baths 3 beds |
show details | |

|
#8
NE Nelson Dr
Pendleton, OR 97801
|
1,784 sq. feet
|
2 baths 3 beds |
show details | |

|
#9
Poverty Flat Rd
Pendleton, OR 97801
|
801 sq. feet
|
1 baths 3 beds |
show details | |

|
#10
NE Riverside Ave
Pendleton, OR 97801
|
- sq. feet
|
- baths - beds |
show details |
| Photo | Address | Area | Beds / Baths | Price | Details |
|---|---|---|---|---|---|

|
#11
SW Perkins Ave
Pendleton, OR 97801
|
- sq. feet
|
- baths - beds |
show details | |

|
#12
SW Kepley Cir
Pendleton, OR 97801
|
- sq. feet
|
- baths - beds |
show details | |

|
#13
SE Byers Ave Apt 1
Pendleton, OR 97801
|
- sq. feet
|
- baths - beds |
show details | |

|
#14
SW 12th Dr
Pendleton, OR 97801
|
- sq. feet
|
- baths - beds |
show details | |

|
#15
SE 10th St
Pendleton, OR 97801
|
- sq. feet
|
- baths - beds |
show details | |

|
#16
NW 11th St
Pendleton, OR 97801
|
- sq. feet
|
- baths - beds |
show details | |

|
#17
SW Nye Ave
Pendleton, OR 97801
|
- sq. feet
|
- baths - beds |
show details | |

|
#18
SW 3rd St # B
Pendleton, OR 97801
|
- sq. feet
|
- baths - beds |
show details | |

|
#19
NW 3rd Dr Apt B
Pendleton, OR 97801
|
- sq. feet
|
- baths - beds |
show details | |

|
#20
SE 7th St
Pendleton, OR 97801
|
- sq. feet
|
- baths - beds |
show details |
| Photo | Address | Area | Beds / Baths | Price | Details |
|---|---|---|---|---|---|

|
#21
SW Nye Ave
Pendleton, OR 97801
|
- sq. feet
|
- baths - beds |
show details | |

|
#22
SE Isaac Ave Apt 4
Pendleton, OR 97801
|
- sq. feet
|
- baths - beds |
show details | |

|
#23
SE Court Ave # 1
Pendleton, OR 97801
|
- sq. feet
|
- baths - beds |
show details | |

|
#24
SW Birch St
Pilot Rock, OR 97868
|
1,644 sq. feet
|
1 baths 3 beds |
show details | |

|
#25
SW 4th St
Pilot Rock, OR 97868
|
- sq. feet
|
- baths - beds |
show details | |

|
#26
SW 4th St
Pilot Rock, OR 97868
|
- sq. feet
|
- baths - beds |
show details | |

|
Check over 1 million property listings on Foreclosure.com!
|
browse all offers | |||

Latest news about housing in Pendleton, OR collected exclusively by city-data.com from local newspapers, TV, and radio stations

 | How do you heat your homes in the winter? (8 replies) |
| Anything new to say about Pendleton? (11 replies) |
| SUV for pulling 25 foot trailer (12 replies) |
| I wish I had the means to buy a house.... (48 replies) |
| Virginian looking to be close to family in Eastern Oregon/Treasure Valley (5 replies) |
| Prescott vs Bend vs Spokane vs Colorado Springs :) (64 replies) |

Median year apartment built: 1969
Household type by relationship:
Households: 17,071- Male householders: 2,955 (754 living alone), Female householders: 3,017 (939 living alone)
2,631 spouses (2,622 opposite-sex spouses), 453 unmarried partners, (436 opposite-sex unmarried partners), 4,658 children (4,358 natural, 105 adopted, 193 stepchildren), 408 grandchildren, 219 brothers or sisters, 145 parents, 62 foster children, 254 other relatives, 491 non-relatives
- In group quarters: 1,771
Size of family households: 1,512 2-persons, 711 3-persons, 940 4-persons, 460 5-persons, 339 6-persons, 123 7-or-more-persons.
Size of nonfamily households: 1,873 1-person, 569 2-persons, 64 3-persons.
2,556 married couples with children.
863 single-parent households (215 men, 648 women).
91.6% of residents of Pendleton speak English at home.
7.6% of residents speak Spanish at home (73% speak English very well, 12% speak English well, 14% speak English not well, 1% don't speak English at all).
0.3% of residents speak Asian or Pacific Island language at home (56% speak English very well, 22% speak English not well, 22% don't speak English at all).
0.3% of residents speak other language at home (17% speak English very well, 83% speak English well).
Foreign born population: 684 (4.0%)
(38.2% of them are naturalized citizens)
| Here: | 6.7 |
| State: | 6.2 |
| Here: | 4.6 |
| State: | 4.0 |

- Bedrooms in owner-occupied houses and condos in Pendleton, Oregon
- 11no bedroom
- 381 bedroom
- 5672 bedrooms
- 1,8333 bedrooms
- 7554 bedrooms
- 3545+ bedrooms

- Bedrooms in renter-occupied apartments in Pendleton, Oregon
- 83no bedroom
- 8261 bedroom
- 1,2032 bedrooms
- 7393 bedrooms
- 394 bedrooms
- 775+ bedrooms

- Cars and other vehicles available in Pendleton in owner-occupied houses/condos
- 44no vehicle
- 5751 vehicle
- 1,5532 vehicles
- 1,0873 vehicles
- 1784 vehicles
- 1225+ vehicles

- Cars and other vehicles available in Pendleton in renter-occupied apartments
- 331no vehicle
- 1,4521 vehicle
- 9022 vehicles
- 2833 vehicles
- 04 vehicles
- 05+ vehicles

- Rooms in owner-occupied houses in Pendleton, Oregon
- 111 room
- 02 rooms
- 573 rooms
- 2554 rooms
- 4735 rooms
- 9506 rooms
- 4867 rooms
- 5088 rooms
- 8199+ rooms

- Rooms in renter-occupied apartments in Pendleton, Oregon
- 531 room
- 3682 rooms
- 5343 rooms
- 7034 rooms
- 6585 rooms
- 3696 rooms
- 1367 rooms
- 938 rooms
- 559+ rooms


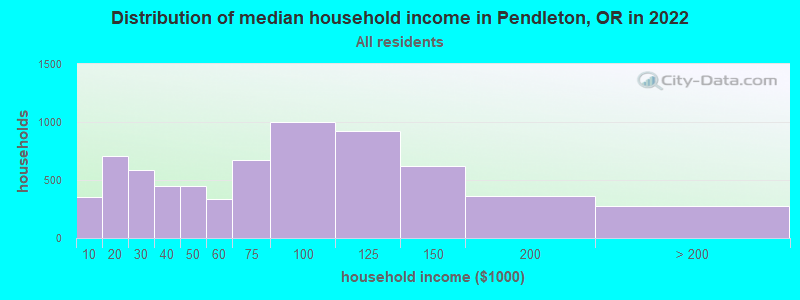
Pendleton, OR household income distribution

- 350Less than $10,000
- 704$10,000 to $19,999
- 590$20,000 to $29,999
- 448$30,000 to $39,999
- 445$40,000 to $49,999
- 334$50,000 to $59,999
- 670$60,000 to $74,999
- 1,004$75,000 to $99,999
- 924$100,000 to $124,999
- 620$125,000 to $149,999
- 361$150,000 to $199,999
- 277$200,000 or more
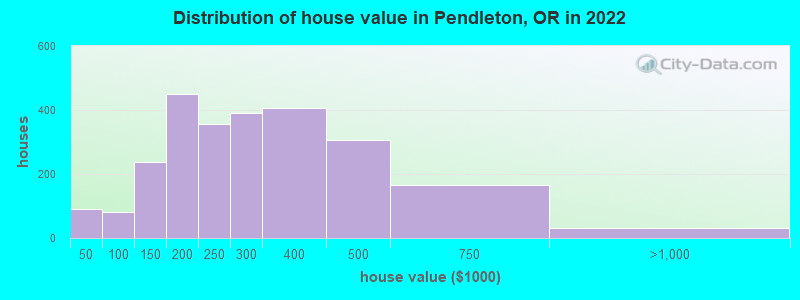
Home value of owner - occupied houses in 2022 in Pendleton, OR
-
- 53Less than $10,000
- 14$15,000 to $19,999
- 13$20,000 to $24,999
- 9$25,000 to $29,999
- 10$50,000 to $59,999
- 11$60,000 to $69,999
- 10$70,000 to $79,999
- 37$80,000 to $89,999
- 10$90,000 to $99,999
- 132$100,000 to $124,999
- 105$125,000 to $149,999
- 273$150,000 to $174,999
- 176$175,000 to $199,999
- 355$200,000 to $249,999
- 392$250,000 to $299,999
- 405$300,000 to $399,999
- 305$400,000 to $499,999
- 165$500,000 to $749,999
- 25$750,000 to $999,999
- 5$1,000,000 to $1,499,999
Rent paid by renters in 2022 in Pendleton, OR
-
- 17Less than $100
- 67$100 to $149
- 7$150 to $199
- 13$200 to $249
- 28$250 to $299
- 29$300 to $349
- 45$350 to $399
- 47$400 to $449
- 159$450 to $499
- 73$500 to $549
- 138$550 to $599
- 464$600 to $649
- 130$650 to $699
- 213$700 to $749
- 96$750 to $799
- 179$800 to $899
- 335$900 to $999
- 302$1,000 to $1,249
- 151$1,250 to $1,499
- 16$1,500 to $1,999
- 35$2,000 to $2,499
- 10$2,500 to $2,999
- 28$3,000 to $3,499
- 65No cash rent


Percentage of workers working in this county: 95.2%
Number of people working at home: 451 (6.5% of all workers)
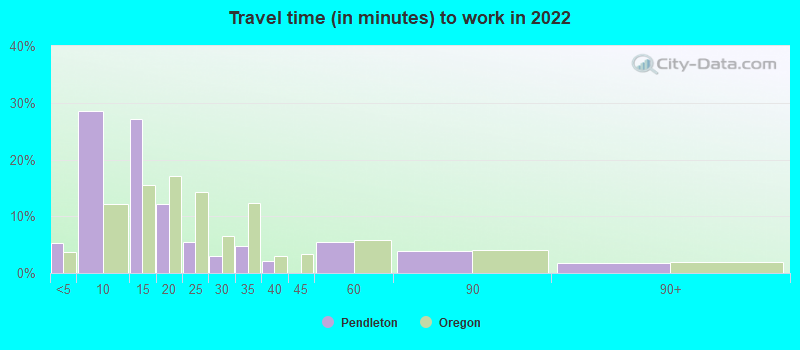
Travel time to work (commute)
- Less than 5 minutes: 650
- 5 to 9 minutes: 2,590
- 10 to 14 minutes: 2,031
- 15 to 19 minutes: 787
- 20 to 24 minutes: 145
- 25 to 29 minutes: 49
- 30 to 34 minutes: 366
- 35 to 39 minutes: 132
- 40 to 44 minutes: 30
- 45 to 59 minutes: 254
- 60 to 89 minutes: 82
- 90 or more minutes: 28
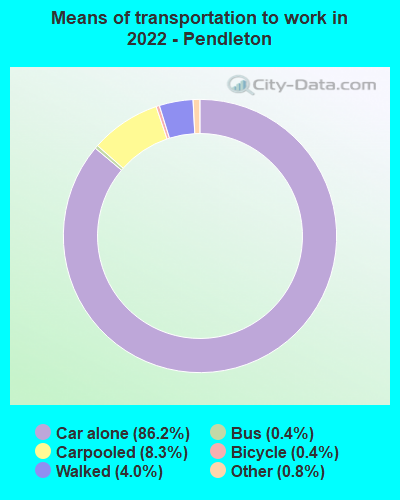
Means of transportation to work:
- Drove a car alone: 7,062 (79.3%)
- Carpooled: 693 (7.8%)
- Bus: 23 (0.3%)
- Taxi: 73 (0.8%)
- Bicycle: 27 (0.3%)
- Walked: 361 (4.1%)
- Worked at home: 451 (5.1%)

- Unemployment by race in 2022
- Unemployment rate for White non-Hispanic residents
- 5.5%Males
- 1.7%Females
- Unemployment rate for Black residents
- 100.0%Males
- Unemployment rate for American Indian and Alaska Native residents
- 7.1%Males
- Unemployment rate for other race residents
- 5.9%Females
- Unemployment rate for two or more race residents
- 26.3%Males
- 6.3%Females
- Unemployment rate for Hispanic or Latino residents
- 2.2%Males
- 6.5%Females

- Year of entry for the foreign-born population in Pendleton, Oregon
- 1112010 or later
- 2202000 to 2009
- 1161990 to 1999
- 1151980 to 1989
- 771970 to 1979
- 58Before 1970

First ancestries reported:
- English: 700 (10.9%)
- German: 586 (9.2%)
- European: 566 (8.9%)
- Irish: 422 (6.6%)
- American: 268 (4.2%)
- Norwegian: 237 (3.7%)
- Italian: 218 (3.4%)
- Scottish: 208 (3.3%)
- Scandinavian: 161 (2.5%)
- Danish: 102 (1.6%)
- Scotch-Irish: 71 (1.1%)
- British: 66 (1.0%)
- Polish: 59 (0.9%)
- Swedish: 53 (0.8%)
- Eastern European: 52 (0.8%)
- Northern European: 51 (0.8%)
- Finnish: 26 (0.4%)
- French: 25 (0.4%)
- Liberian: 25 (0.4%)
- Dutch: 19 (0.3%)
- Welsh: 17 (0.3%)
- Russian: 16 (0.3%)
- Austrian: 10 (0.2%)
- Slavic: 10 (0.2%)
- Lebanese: 7 (0.1%)
- Canadian: 6 (0.09%)
- Greek: 2 (0.03%)
Most common places of birth for foreign-born residents (%):
| Pendleton: | 67.9% (409) |
| Oregon: | 33.9% (140,109) |
| Pendleton: | 6.1% (37) |
| Oregon: | 5.5% (22,563) |
| Pendleton: | 6.1% (37) |
| Oregon: | 3.7% (15,229) |
| Pendleton: | 5.5% (33) |
| Oregon: | 0.2% (625) |
| Pendleton: | 4.5% (27) |
| Oregon: | 0.1% (451) |
| Pendleton: | 4.5% (27) |
| Oregon: | 0.3% (1,378) |
| Pendleton: | 3.8% (23) |
| Oregon: | 0.2% (794) |
| Pendleton: | 3.0% (18) |
| Oregon: | 0.4% (1,762) |
| Pendleton: | 1.8% (11) |
| Oregon: | 1.9% (8,005) |
Place of birth for U.S.-born residents:
- This state: 9,924
- Other state: 6,276
- Northeast: 70
- Midwest: 916
- South: 845
- West: 4,420
89.5% of Pendleton residents lived in the same house 1 years ago.
Out of people who lived in different houses, 41.7% lived in this county.
Out of people who lived in different counties, 78.9% lived in Oregon.
| Pendleton: | 89.5% |
| State average: | 85.5% |
Education attainment for males 25 years and older:
- No schooling: 33
- Nursery to 4th grade: 24
- 5th and 6th grade: 39
- 7th and 8th grade: 124
- 9th grade: 21
- 10th grade: 249
- 11th grade: 108
- 12th grade, no diploma: 160
- High school graduate (or equivalency): 2,378
- Less than 1 year of college: 512
- Some college more than 1 year, no degree: 852
- Associate degree: 542
- Bachelor's degree: 731
- Master's degree: 371
- Professional school degree: 69
- Doctorate degree: 46

Education attainment for females 25 years and older:
- No schooling: 88
- Nursery to 4th grade: 0
- 5th and 6th grade: 6
- 7th and 8th grade: 48
- 9th grade: 59
- 10th grade: 22
- 11th grade: 42
- 12th grade, no diploma: 51
- High school graduate (or equivalency): 1,676
- Less than 1 year of college: 610
- Some college more than 1 year, no degree: 860
- Associate degree: 428
- Bachelor's degree: 914
- Master's degree: 456
- Professional school degree: 185
- Doctorate degree: 13


Housing units in structures:
- One, detached: 4,535
- One, attached: 359
- Two: 402
- 3 or 4: 245
- 5 to 9: 472
- 10 to 19: 134
- 20 to 49: 485
- 50 or more: 43
- Mobile homes: 460
Median worth of mobile homes: $215,737
Housing units lacking complete kitchen facilities in 2022: 3.5%
House/condo owner moved in on average 9 years ago
Renter moved in on average 3 years ago

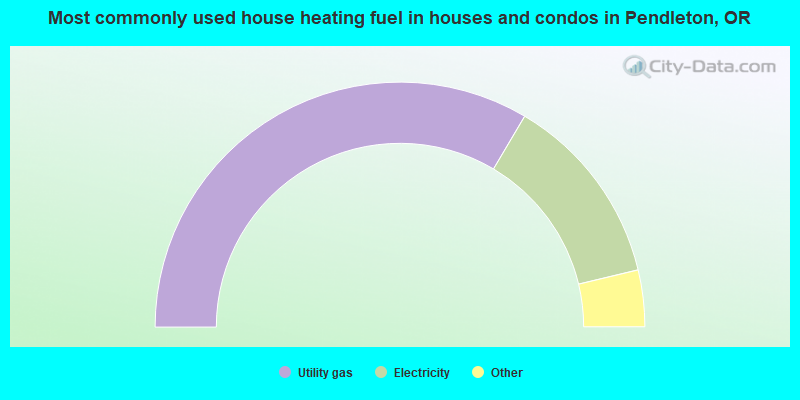
- 67.1%Utility gas
- 25.5%Electricity
- 2.7%Wood
- 1.6%No fuel used
- 1.4%Bottled, tank, or LP gas
- 1.2%Fuel oil, kerosene, etc.
- 0.4%Other fuel
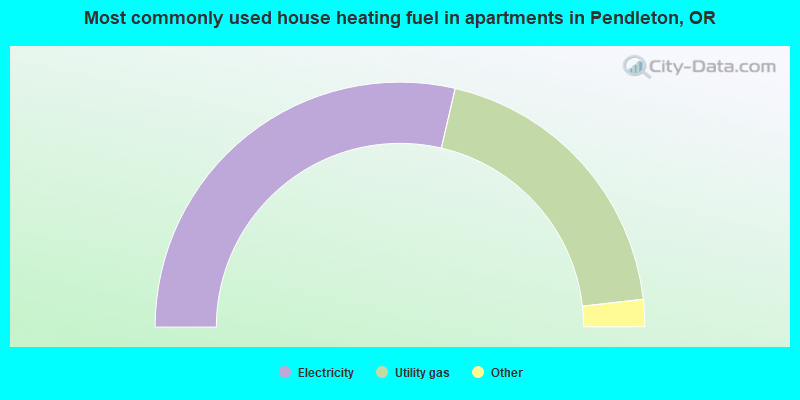
- 57.3%Electricity
- 39.2%Utility gas
- 2.1%Bottled, tank, or LP gas
- 0.7%Wood
- 0.5%Other fuel
- 0.3%Fuel oil, kerosene, etc.
Private vs. public school enrollment:
| Here: | 6.9% |
| Oregon: | 13.7% |
| Here: | 4.0% |
| Oregon: | 8.8% |
| Here: | 16.9% |
| Oregon: | 17.7% |


