Pearl, MS (Mississippi) Houses and Residents
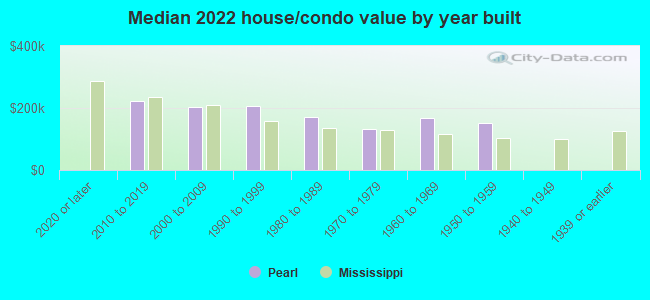
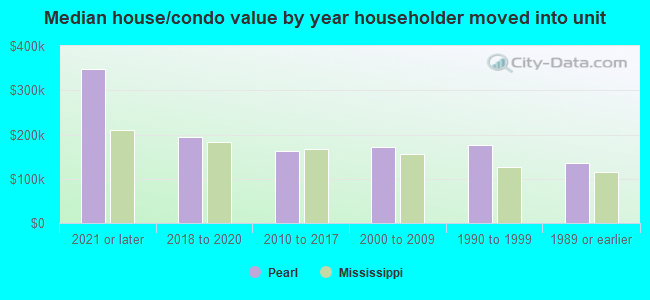
Estimated median house or condo value in 2022: $171,473 (it was $68,800 in 2000 )
Pearl:
$171,473Mississippi:
$162,500
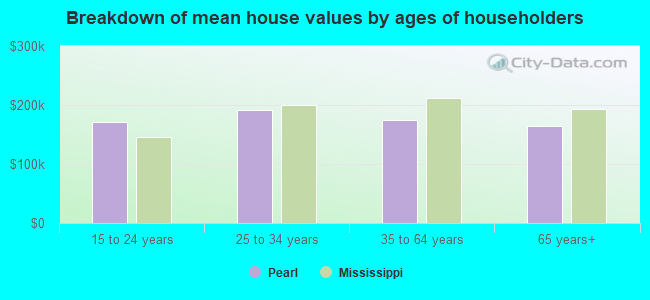
Lower value quartile - upper value quartile: $113,068 - $219,977Mean price in 2022: Detached houses: $196,072 Here:
$196,072State:
$226,494
Townhouses or other attached units: $223,663 Here:
$223,663State:
$254,198
Mobile homes: $39,626 Here:
$39,626State:
$73,695
Total population: 26,388 (Urban population: 20,716, Rural population: 1,244 (33 farm, 1,211 nonfarm ))
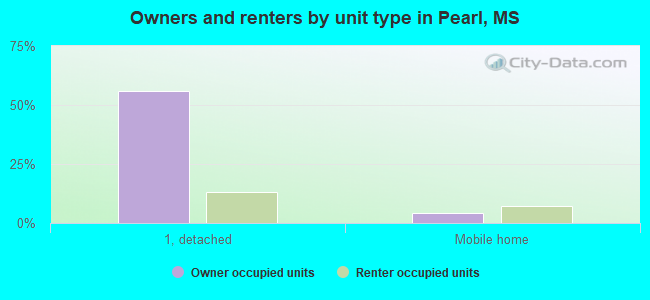
Houses: 12,266 (11,161 occupied: 6,668 owner occupied, 4,264 renter occupied )
% of renters here:
39%State:
30%
Housing density: 562 houses/condos per square mile
Median price asked for vacant for-sale houses and condos in 2022: $92,098.
Median contract rent in 2022: $885 (lower quartile is $745, upper quartile is $1,119)
Median rent asked for vacant for-rent units in 2022: $1,157
Median gross rent in Pearl, MS in 2022: $1,124
Housing units in Pearl with a mortgage: 3,571 (141 second mortgage, 0 home equity loan, 90 both second mortgage and home equity loan )Houses without a mortgage: 116
Median household income for houses/condos with a mortgage: $84,515
Median household income for apartments without a mortgage: $45,629
Median monthly housing costs: $906
Data:
Median house or condo value ($)
Median house or condo value ($ change since 2000)
Median house or condo value ($) - White
Median house or condo value ($) - Black or African American
Median house or condo value ($) - Asian
Median house or condo value ($) - Hispanic or Latino
Median house or condo value ($) - American Indian and Alaska Native
Median house or condo value ($) - Multirace
Median house or condo value ($) - Other Race
Median price asked for mobile homes ($)
Household density (households per square mile)
Mean house or condo value by units in structure - 1, detached ($)
Mean house or condo value by units in structure - 1, attached ($)
Mean house or condo value by units in structure - 2 ($)
Mean house or condo value by units in structure by units in structure - 3 or 4 ($)
Mean house or condo value by units in structure - 5 or more ($)
Mean house or condo value by units in structure - Boat, RV, van, etc. ($)
Mean house or condo value by units in structure - Mobile home ($)
Median contract rent ($)
Median contract rent - Lower quartile ($)
Median contract rent - Upper quartile ($)
Median gross rent ($)
Urban houses (%)
Rural houses (%)
Houses occupied (%)
Houses occupied (% change since 2000)
Houses owner occupied (%)
Houses owner occupied (% change since 2000)
Houses renter occupied (%)
Houses renter occupied (% change since 2000)
Vacant housing units - For rent (%)
Vacant housing units - For rent (% change since 2000)
Vacant housing units - For sale only (%)
Vacant housing units - For sale only (% change since 2000)
Vacant housing units - Rented or sold, not occupied (%)
Vacant housing units - Rented or sold, not occupied (% change since 2000)
Vacant housing units - For seasonal, recreational, or occasional use (%)
Vacant housing units - For seasonal, recreational, or occasional use (% change since 2000)
Vacant housing units - For migrant workers (%)
Vacant housing units - For migrant workers (% change since 2000)
Vacant housing units - Other vacant (%)
Vacant housing units - Other vacant (% change since 2000)
Median monthly housing costs ($)
Median household income for houses/condos with a mortgage ($)
Median household income for houses/condos without a mortgage ($)
Median household income ($)
Median household income ($) - White
Median household income ($) - Black or African American
Median household income ($) - Asian
Median household income ($) - Hispanic or Latino
Median household income ($) - American Indian and Alaska Native
Median household income ($) - Multirace
Median household income ($) - Other Race
Mortgage status - with mortgage (%)
Mortgage status - with second mortgage (%)
Mortgage status - with home equity loan (%)
Mortgage status - with both second mortgage and home equity loan (%)
Mortgage status - without a mortgage (%)
Median year house/condo built
Median year apartment built
Household type by relationship - Male householder living alone (%)
Household type by relationship - Male householder not living alone (%)
Household type by relationship - Female householder living alone (%)
Household type by relationship - Female householder not living alone (%)
Household type by relationship - Opposite-Sex spouse (%)
Household type by relationship - Same-Sex spouse (%)
Household type by relationship - Opposite-Sex unmarried partner (%)
Household type by relationship - Same-Sex unmarried partner (%)
Household type by relationship - In group quarters (%)
Size of family households - 2-person household (%)
Size of family households - 3-person household (%)
Size of family households - 4-person household (%)
Size of family households - 5-person household (%)
Size of family households - 6-person household (%)
Size of family households - 7-or-more-person household (%)
Size of nonfamily households - 1-person household (%)
Size of nonfamily households - 2-person household (%)
Size of nonfamily households - 3-person household (%)
Size of nonfamily households - 4-person household (%)
Size of nonfamily households - 5-person household (%)
Size of nonfamily households - 6-person household (%)
Size of nonfamily households - 7-or-moreperson household (%)
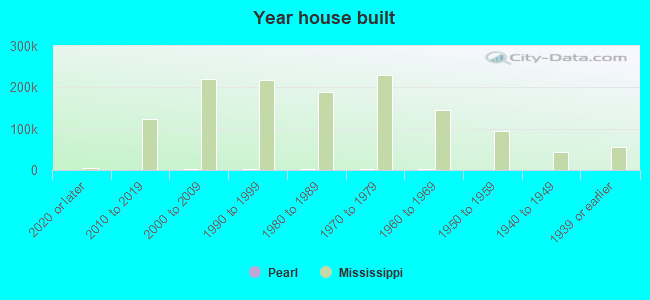
Year house built - Built 2010 or later (%)
Year house built - Built 2000 to 2009 (%)
Year house built - Built 1990 to 1999 (%)
Year house built - Built 1980 to 1989 (%)
Year house built - Built 1970 to 1979 (%)
Year house built - Built 1960 to 1969 (%)
Year house built - Built 1950 to 1959 (%)
Year house built - Built 1940 to 1949 (%)
Year house built - Built 1939 or earlier (%)
Median number of rooms in houses and condos
Median number of rooms in apartments
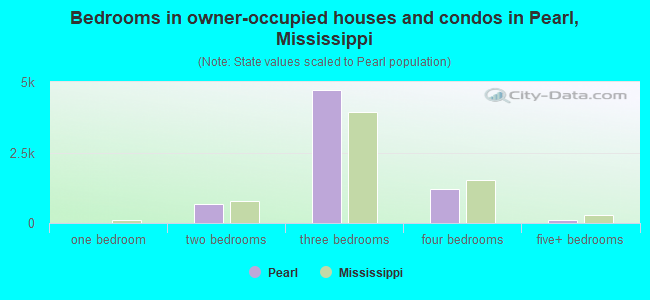
Median number of bedrooms in owner occupied houses
Mean number of bedrooms in owner occupied houses
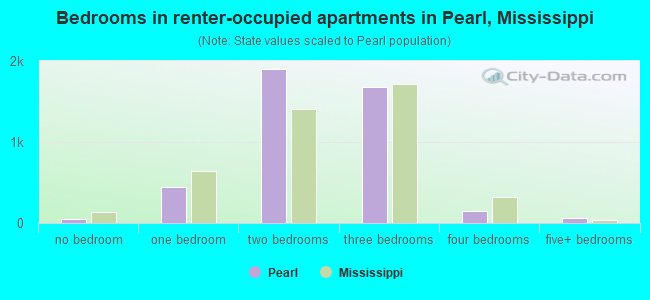
Median number of bedrooms in renter occupied houses
Mean number of bedrooms in renter occupied houses
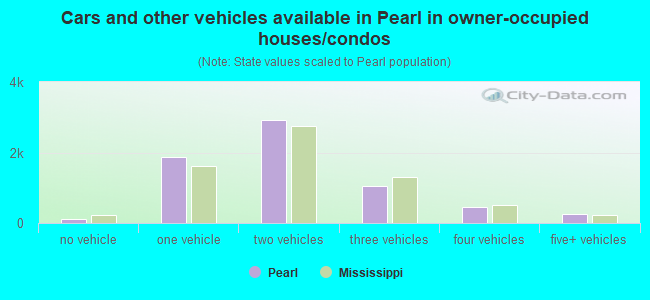
Median number of vehichles in owner occupied houses
Mean number of vehichles in owner occupied houses
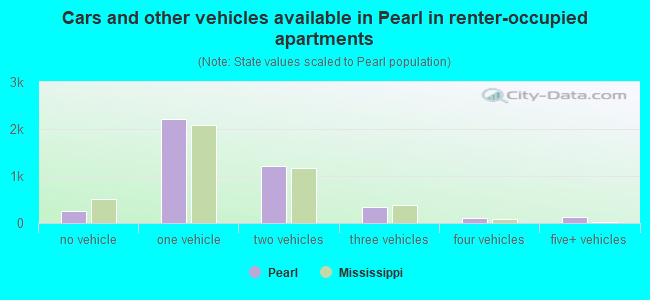
Median number of vehichles in renter occupied houses
Mean number of vehichles in renter occupied houses
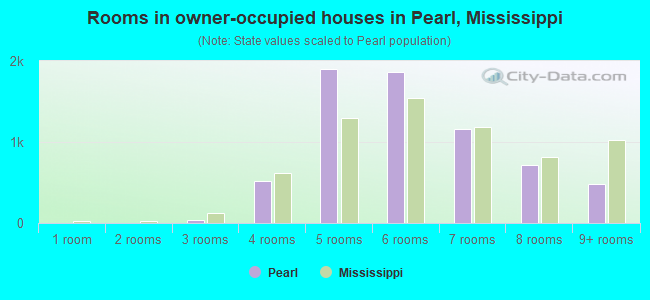
Rooms in owner-occupied houses - 1 room (%)
Rooms in owner-occupied houses - 2 rooms (%)
Rooms in owner-occupied houses - 3 rooms (%)
Rooms in owner-occupied houses - 4 rooms (%)
Rooms in owner-occupied houses - 5 rooms (%)
Rooms in owner-occupied houses - 6 rooms (%)
Rooms in owner-occupied houses - 7 rooms (%)
Rooms in owner-occupied houses - 8 rooms (%)
Rooms in owner-occupied houses - 9+ rooms (%)
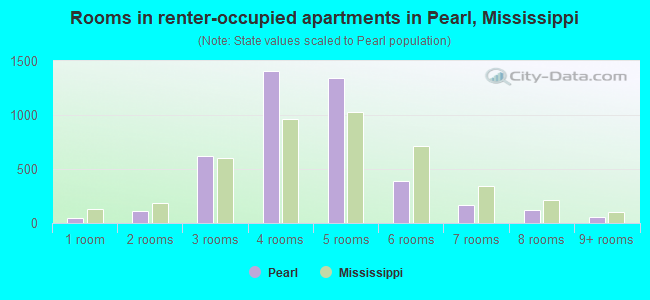
Rooms in renter-occupied houses - 1 room (%)
Rooms in renter-occupied houses - 2 rooms (%)
Rooms in renter-occupied houses - 3 rooms (%)
Rooms in renter-occupied houses - 4 rooms (%)
Rooms in renter-occupied houses - 5 rooms (%)
Rooms in renter-occupied houses - 6 rooms (%)
Rooms in renter-occupied houses - 7 rooms (%)
Rooms in renter-occupied houses - 8 rooms (%)
Rooms in renter-occupied houses - 9+ rooms (%)
Bedrooms in owner-occupied houses - no bedrooms (%)
Bedrooms in owner-occupied houses - 1 bedroom (%)
Bedrooms in owner-occupied houses - 2 bedrooms (%)
Bedrooms in owner-occupied houses - 3 bedrooms (%)
Bedrooms in owner-occupied houses - 4 bedrooms (%)
Bedrooms in owner-occupied houses - 5+ bedrooms (%)
Bedrooms in renter-occupied houses - no bedrooms (%)
Bedrooms in renter-occupied houses - 1 bedroom (%)
Bedrooms in renter-occupied houses - 2 bedrooms (%)
Bedrooms in renter-occupied houses - 3 bedrooms (%)
Bedrooms in renter-occupied houses - 4 bedrooms (%)
Bedrooms in renter-occupied houses - 5+ bedrooms (%)
Vehicles available in owner-occupied houses - no vehicle available (%)
Vehicles available in owner-occupied houses - 1 vehicle available(%)
Vehicles available in owner-occupied houses - 2 Vehicles available (%)
Vehicles available in owner-occupied houses - 3 Vehicles available (%)
Vehicles available in owner-occupied houses - 4 Vehicles available (%)
Vehicles available in owner-occupied houses - 5+ Vehicles available (%)
Vehicles available in renter-occupied houses - no vehicle available (%)
Vehicles available in renter-occupied houses - 1 vehicle available (%)
Vehicles available in renter-occupied houses - 2 Vehicles available (%)
Vehicles available in renter-occupied houses - 3 Vehicles available (%)
Vehicles available in renter-occupied houses - 4 Vehicles available (%)
Vehicles available in renter-occupied houses - 5+ Vehicles available (%)
Housing units in structures - 1, detached (%)
Housing units in structures - 1, attached (%)
Housing units in structures - 2 (%)
Housing units in structures - 3 or 4 (%)
Housing units in structures - 5 to 9 (%)
Housing units in structures - 10 to 19 (%)
Housing units in structures - 20 to 49 (%)
Housing units in structures - 50 or more (%)
Housing units in structures - Mobile home (%)
Housing units in structures - Boat, RV, van, etc. (%)
Housing units in structures - Owners - 1, detached (%)
Housing units in structures - Owners - 1, attached (%)
Housing units in structures - Owners - 2 (%)
Housing units in structures - Owners - 3 or 4 (%)
Housing units in structures - Owners - 5 to 9 (%)
Housing units in structures - Owners - 10 to 19 (%)
Housing units in structures - Owners - 20 to 49 (%)
Housing units in structures - Owners - 50 or more (%)
Housing units in structures - Owners - Mobile home (%)
Housing units in structures - Owners - Boat, RV, van, etc. (%)
Housing units in structures - Renters - 1, detached (%)
Housing units in structures - Renters - 1, attached (%)
Housing units in structures - Renters - 2 (%)
Housing units in structures - Renters - 3 or 4 (%)
Housing units in structures - Renters - 5 to 9 (%)
Housing units in structures - Renters - 10 to 19 (%)
Housing units in structures - Renters - 20 to 49 (%)
Housing units in structures - Renters - 50 or more (%)
Housing units in structures - Renters - Mobile home (%)
Housing units in structures - Renters - Boat, RV, van, etc. (%)
House/condo owner moved in on average (years ago)
Renter moved in on average (years ago)
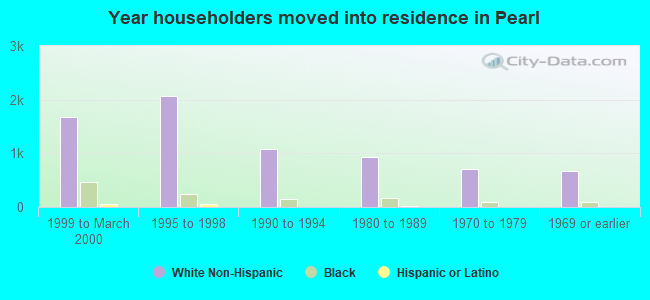
Year householder moved into unit - Moved in 1999 to March 2000 (%)
Year householder moved into unit - Moved in 1999 to March 2000 (%) - White
Year householder moved into unit - Moved in 1999 to March 2000 (%) - Black or African American
Year householder moved into unit - Moved in 1999 to March 2000 (%) - Asian
Year householder moved into unit - Moved in 1999 to March 2000 (%) - Hispanic or Latino
Year householder moved into unit - Moved in 1999 to March 2000 (%) - American Indian and Alaska Native
Year householder moved into unit - Moved in 1999 to March 2000 (%) - Multirace
Year householder moved into unit - Moved in 1999 to March 2000 (%) - Other Race
Year householder moved into unit - Moved in 1995 to 1998 (%)
Year householder moved into unit - Moved in 1995 to 1998 (%) - White
Year householder moved into unit - Moved in 1995 to 1998 (%) - Black or African American
Year householder moved into unit - Moved in 1995 to 1998 (%) - Asian
Year householder moved into unit - Moved in 1995 to 1998 (%) - Hispanic or Latino
Year householder moved into unit - Moved in 1995 to 1998 (%) - American Indian and Alaska Native
Year householder moved into unit - Moved in 1995 to 1998 (%) - Multirace
Year householder moved into unit - Moved in 1995 to 1998 (%) - Other Race
Year householder moved into unit - Moved in 1990 to 1994 (%)
Year householder moved into unit - Moved in 1990 to 1994 (%) - White
Year householder moved into unit - Moved in 1990 to 1994 (%) - Black or African American
Year householder moved into unit - Moved in 1990 to 1994 (%) - Asian
Year householder moved into unit - Moved in 1990 to 1994 (%) - Hispanic or Latino
Year householder moved into unit - Moved in 1990 to 1994 (%) - American Indian and Alaska Native
Year householder moved into unit - Moved in 1990 to 1994 (%) - Multirace
Year householder moved into unit - Moved in 1990 to 1994 (%) - Other Race
Year householder moved into unit - Moved in 1980 to 1989 (%)
Year householder moved into unit - Moved in 1980 to 1989 (%) - White
Year householder moved into unit - Moved in 1980 to 1989 (%) - Black or African American
Year householder moved into unit - Moved in 1980 to 1989 (%) - Asian
Year householder moved into unit - Moved in 1980 to 1989 (%) - Hispanic or Latino
Year householder moved into unit - Moved in 1980 to 1989 (%) - American Indian and Alaska Native
Year householder moved into unit - Moved in 1980 to 1989 (%) - Multirace
Year householder moved into unit - Moved in 1980 to 1989 (%) - Other Race
Year householder moved into unit - Moved in 1970 to 1979 (%)
Year householder moved into unit - Moved in 1970 to 1979 (%) - White
Year householder moved into unit - Moved in 1970 to 1979 (%) - Black or African American
Year householder moved into unit - Moved in 1970 to 1979 (%) - Asian
Year householder moved into unit - Moved in 1970 to 1979 (%) - Hispanic or Latino
Year householder moved into unit - Moved in 1970 to 1979 (%) - American Indian and Alaska Native
Year householder moved into unit - Moved in 1970 to 1979 (%) - Multirace
Year householder moved into unit - Moved in 1970 to 1979 (%) - Other Race
Year householder moved into unit - Moved in 1969 or earlier (%)
Year householder moved into unit - Moved in 1969 or earlier (%) - White
Year householder moved into unit - Moved in 1969 or earlier (%) - Black or African American
Year householder moved into unit - Moved in 1969 or earlier (%) - Asian
Year householder moved into unit - Moved in 1969 or earlier (%) - Hispanic or Latino
Year householder moved into unit - Moved in 1969 or earlier (%) - American Indian and Alaska Native
Year householder moved into unit - Moved in 1969 or earlier (%) - Multirace
Year householder moved into unit - Moved in 1969 or earlier (%) - Other Race
Housing units lacking complete plumbing facilities (%)
Housing units lacking complete kitchen facilities (%)
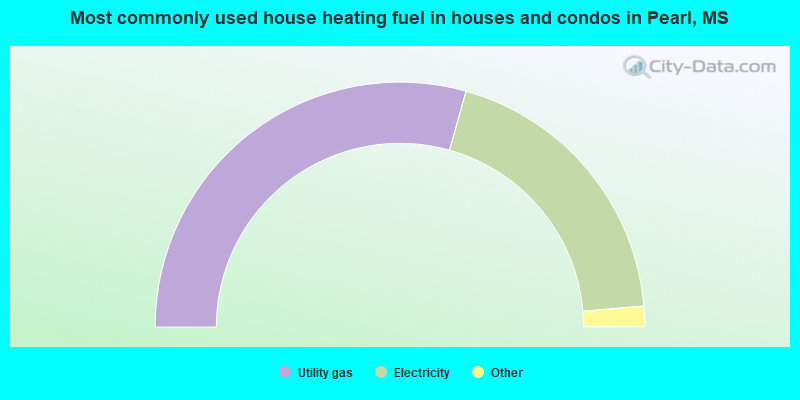
House heating fuel used in houses and condos - Utility gas (%)
House heating fuel used in houses and condos - Bottled, tank, or LP gas (%)
House heating fuel used in houses and condos - Electricity (%)
House heating fuel used in houses and condos - Fuel oil, kerosene, etc. (%)
House heating fuel used in houses and condos - Coal or coke (%)
House heating fuel used in houses and condos - Wood (%)
House heating fuel used in houses and condos - Solar energy (%)
House heating fuel used in houses and condos - Other fuel (%)
House heating fuel used in houses and condos - No fuel used (%)
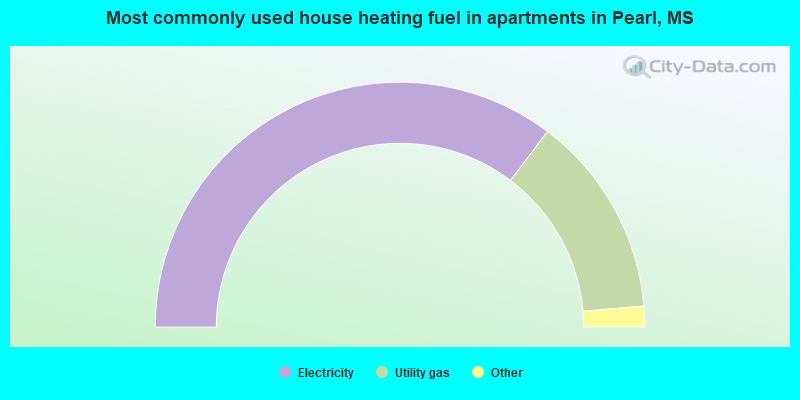
House heating fuel used in apartments - Utility gas (%)
House heating fuel used in apartments - Bottled, tank, or LP gas (%)
House heating fuel used in apartments - Electricity (%)
House heating fuel used in apartments - Fuel oil, kerosene, etc. (%)
House heating fuel used in apartments - Coal or coke (%)
House heating fuel used in apartments - Wood (%)
House heating fuel used in apartments - Solar energy (%)
House heating fuel used in apartments - Other fuel (%)
House heating fuel used in apartments - No fuel used (%)
Latest news about housing in Pearl, MS collected exclusively by city-data.com from local newspapers, TV, and radio stations
Median year house/condo built: 1978Median year apartment built: 1983Household type by relationship:
Households: 27,566
Male householders: 4,973 (1,667 living alone ), Female householders: 6,156 (1,763 living alone )4,921 spouses (4,855 opposite-sex spouses ), 629 unmarried partners , (621 opposite-sex unmarried partners ), 8,095 children (7,663 natural , 138 adopted , 293 stepchildren ), 755 grandchildren , 432 brothers or sisters , 455 parents , 0 foster children , 315 other relatives , 742 non-relatives In group quarters: 89
Size of family households: 3,397 2-persons , 1,480 3-persons , 839 4-persons , 672 5-persons , 280 6-persons , 44 7-or-more-persons .
Size of nonfamily households: 3,997 1-person , 486 2-persons , 48 3-persons .
3,411 married couples with children. single-parent households (411 men , 1,768 women ).
93.7% of residents of Pearl speak English at home. of residents speak Spanish at home (79% speak English very well , 7% speak English well , 14% speak English not well ).of residents speak other Indo-European language at home (46% speak English very well , 17% speak English well , 37% speak English not well ).of residents speak Asian or Pacific Island language at home (74% speak English very well , 26% speak English well ).of residents speak other language at home (85% speak English very well , 15% speak English well ).
Foreign born population: 727 (2.6%)of them are naturalized citizens )
Median number of rooms in houses and condos:
Median number of rooms in apartments
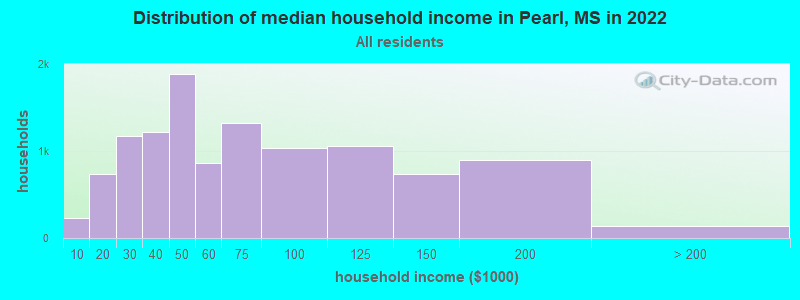
Pearl, MS household income distribution 231 Less than $10,000740 $10,000 to $19,9991,178 $20,000 to $29,9991,224 $30,000 to $39,9991,889 $40,000 to $49,999865 $50,000 to $59,9991,317 $60,000 to $74,9991,034 $75,000 to $99,9991,052 $100,000 to $124,999734 $125,000 to $149,999891 $150,000 to $199,999135 $200,000 or more
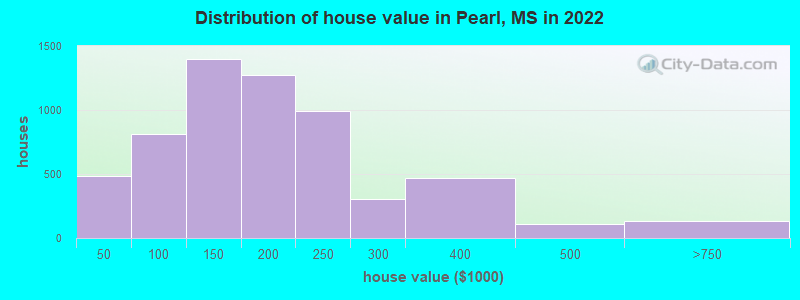
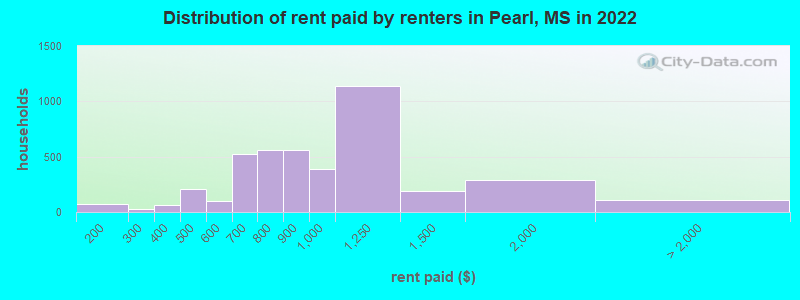
Home value of owner - occupied houses in 2022 in Pearl, MS 117 Less than $10,000104 $10,000 to $14,99990 $20,000 to $24,999106 $25,000 to $29,9992 $30,000 to $34,99937 $35,000 to $39,99922 $40,000 to $49,99967 $50,000 to $59,999130 $60,000 to $69,999151 $70,000 to $79,99930 $80,000 to $89,999410 $90,000 to $99,999635 $100,000 to $124,999763 $125,000 to $149,999851 $150,000 to $174,999421 $175,000 to $199,999996 $200,000 to $249,999308 $250,000 to $299,999464 $300,000 to $399,999112 $400,000 to $499,999123 $500,000 to $749,99911 $750,000 to $999,999Rent paid by renters in 2022 in Pearl, MS 5 $100 to $14970 $150 to $19923 $200 to $24953 $300 to $34911 $350 to $399130 $400 to $44978 $450 to $49964 $500 to $54930 $550 to $599217 $600 to $649310 $650 to $699328 $700 to $749228 $750 to $799560 $800 to $899384 $900 to $9991,139 $1,000 to $1,249186 $1,250 to $1,499290 $1,500 to $1,999108 No cash rent
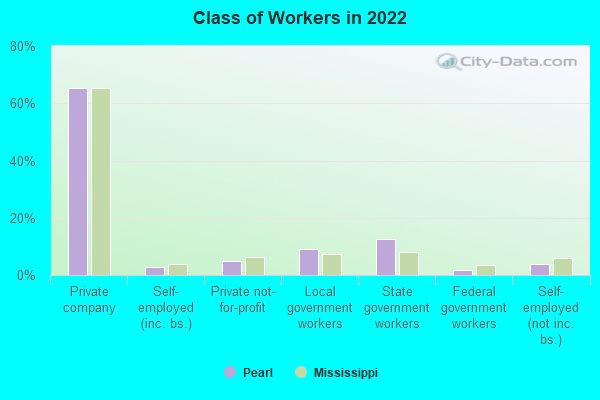
Percentage of workers working in this county: 60.4%Number of people working at home: 1,101 (7.6% of all workers )
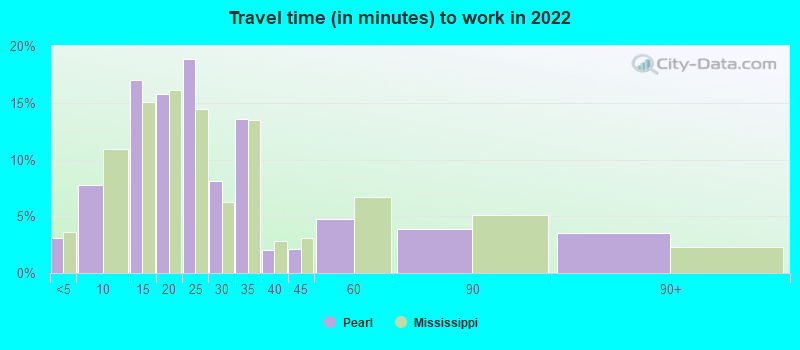
Travel time to work (commute)
Less than 5 minutes: 2615 to 9 minutes: 1,31910 to 14 minutes: 2,73915 to 19 minutes: 3,36520 to 24 minutes: 2,66125 to 29 minutes: 55130 to 34 minutes: 1,32135 to 39 minutes: 18840 to 44 minutes: 17145 to 59 minutes: 26760 to 89 minutes: 53590 or more minutes: 660
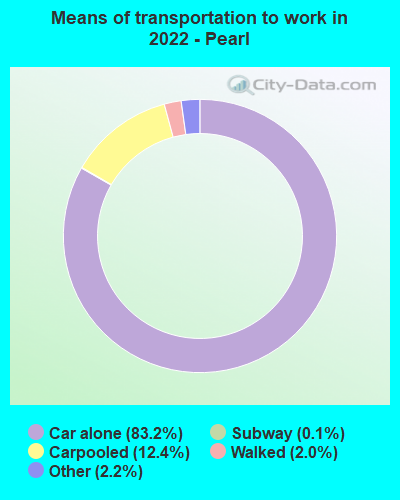
Means of transportation to work:
Drove a car alone: 10,518 (76.1%)Carpooled: 1,747 (12.6%)Bus : 4 (0.0%)Long-distance train or commuter rail : 12 (0.1%)Taxi: 226 (1.6%)Walked: 304 (2.2%)Worked at home: 1,101 (8.0%)
Unemployment by race in 2022
Unemployment rate for White non-Hispanic residents 6.4% Males2.4% FemalesUnemployment rate for Black residents 3.3% Males6.6% FemalesUnemployment rate for Asian residents 8.5% MalesUnemployment rate for two or more race residents 5.7% Females
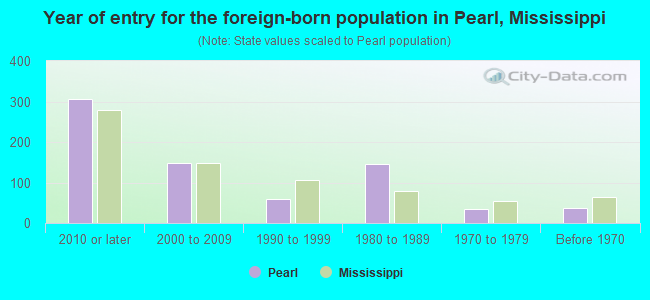
Year of entry for the foreign-born population in Pearl, Mississippi
306 2010 or later 148 2000 to 2009 59 1990 to 1999 146 1980 to 1989 35 1970 to 1979 37 Before 1970
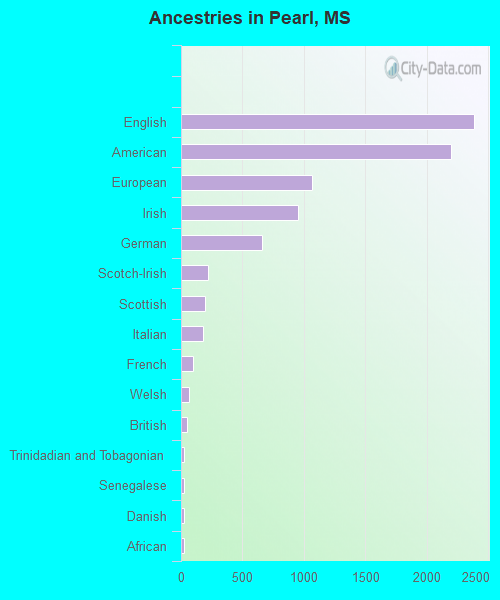
First ancestries reported:
English: 2,387 (13.4%)
American: 2,197 (12.3%)
European: 1,068 (6.0%)
Irish: 950 (5.3%)
German: 662 (3.7%)
Scotch-Irish: 219 (1.2%)
Scottish: 196 (1.1%)
Italian: 175 (1.0%)
French: 101 (0.6%)
Welsh: 68 (0.4%)
British: 50 (0.3%)
Trinidadian and Tobagonian: 28 (0.2%)
Senegalese: 27 (0.2%)
Danish: 24 (0.1%)
African: 23 (0.1%)
Norwegian: 18 (0.1%)
Lebanese: 9 (0.05%) Most common places of birth for foreign-born residents (%): India Pearl:
18.1% (142)Mississippi:
6.3% (4,325)
Mexico Pearl:
18.1% (142)Mississippi:
25.4% (17,354)
Uganda Pearl:
12.6% (99)Mississippi:
0.1% (87)
Indonesia Pearl:
7.4% (58)Mississippi:
0.2% (133)
Honduras Pearl:
7.4% (58)Mississippi:
5.1% (3,475)
Philippines Pearl:
6.6% (52)Mississippi:
4.7% (3,211)
Venezuela Pearl:
6.0% (47)Mississippi:
0.3% (200)
Germany Pearl:
5.9% (46)Mississippi:
3.1% (2,126)
Pakistan Pearl:
4.6% (36)Mississippi:
0.7% (455)
Nicaragua Pearl:
3.8% (30)Mississippi:
0.5% (325)
Guatemala Pearl:
3.4% (27)Mississippi:
5.5% (3,723)
Trinidad and Tobago Pearl:
3.4% (27)Mississippi:
0.1% (89)
Senegal Pearl:
3.1% (24)Mississippi:
0.2% (131)
Dominican Republic Pearl:
1.9% (15)Mississippi:
1.9% (1,324)
Place of birth for U.S.-born residents:
This state: 21,038Other state: 5,643Northeast: 566Midwest: 1,297South: 3,024West: 717 85.1% of Pearl residents lived in the same house 1 years ago.
Out of people who lived in different houses, 28.9% lived in this county.
Out of people who lived in different counties, 75.9% lived in Mississippi.
Pearl:
85.1%State average:
88.9%
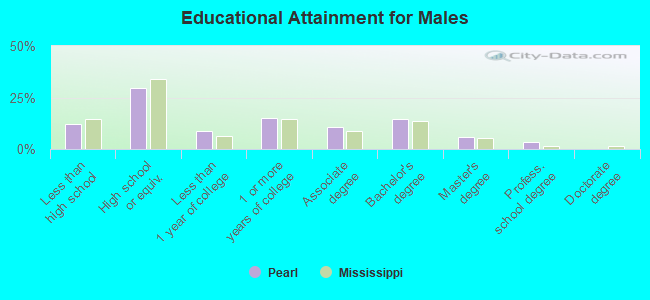
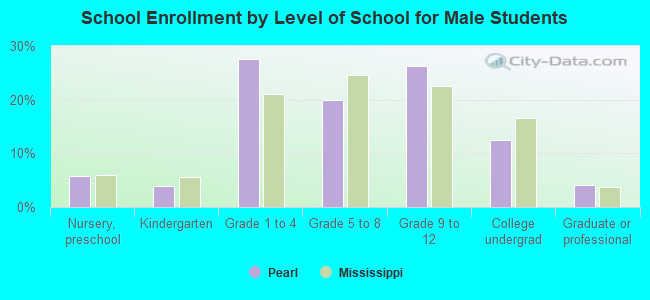
Education attainment for males 25 years and older:
No schooling: 147Nursery to 4th grade: 75th and 6th grade: 227th and 8th grade: 1389th grade: 8010th grade: 12011th grade: 25212th grade, no diploma: 259High school graduate (or equivalency): 2,465Less than 1 year of college: 725Some college more than 1 year, no degree: 1,264Associate degree: 888Bachelor's degree: 1,231Master's degree: 481Professional school degree: 265Doctorate degree: 0
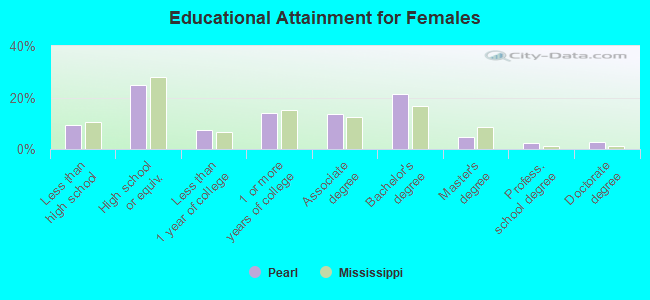
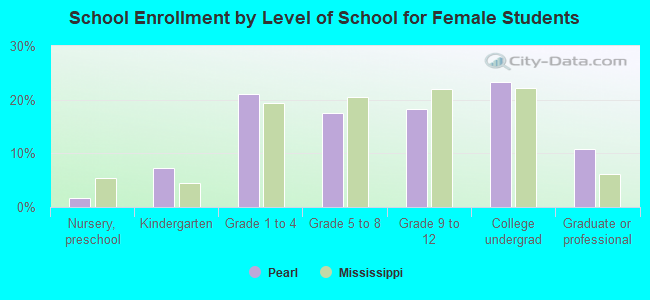
Education attainment for females 25 years and older:
No schooling: 100Nursery to 4th grade: 185th and 6th grade: 1477th and 8th grade: 549th grade: 8210th grade: 19111th grade: 19112th grade, no diploma: 160High school graduate (or equivalency): 2,560Less than 1 year of college: 763Some college more than 1 year, no degree: 1,453Associate degree: 1,406Bachelor's degree: 2,216Master's degree: 474Professional school degree: 240Doctorate degree: 275
Housing units in structures:
One, detached: 8,396One, attached: 125Two: 1673 or 4: 3645 to 9: 84210 to 19: 71820 to 49: 9450 or more: 134Mobile homes: 1,406Boats, RVs, vans, etc.: 15Median worth of mobile homes: $33,217
Housing units lacking complete plumbing facilities in 2022: 0.9%Housing units lacking complete kitchen facilities in 2022: 2.0%House/condo owner moved in on average 16 years ago
Renter moved in on average 3 years ago
Private vs. public school enrollment:
Students in private schools in grades 1 to 8 (elementary and middle school): 498 Here:
20.2%Mississippi:
16.1%
Students in private schools in grades 9 to 12 (high school): 166 Here:
13.1%Mississippi:
14.6%
Students in private undergraduate colleges: 152 Here:
13.9%Mississippi:
12.8%