Parma Heights, OH (Ohio) Houses and Residents
| Parma Heights: | $166,069 |
| Ohio: | $204,100 |
Total population: 20,330 (All urban)
Houses: 9,928 (9,322 occupied: 5,433 owner occupied, 3,944 renter occupied)
| % of renters here: | 42% |
| State: | 33% |
Housing density: 2,365 houses/condos per square mile
Median price asked for vacant for-sale houses and condos in 2022: $115,223.
Median contract rent in 2022: $900 (lower quartile is $799, upper quartile is $1,109)
Median rent asked for vacant for-rent units in 2022: $907
Median gross rent in Parma Heights, OH in 2022: $1,010
Housing units in Parma Heights with a mortgage: 3,395 (551 second mortgage, 8 home equity loan, 447 both second mortgage and home equity loan)
Houses without a mortgage: 268
Median household income for houses/condos with a mortgage: $82,620
Median household income for apartments without a mortgage: $62,413
Median monthly housing costs: $1,001
Compare current foreclosures near Parma Heights, OH:
| Photo | Address | Area | Beds / Baths | Price | Details |
|---|---|---|---|---|---|

|
#1
Denison Ave
Elyria, OH 44035
|
875 sq. feet
|
1 baths 3 beds |
$149,900
|
show details |

|
#2
Greenfield Ct
Berea, OH 44017
|
840 sq. feet
|
1 baths 2 beds |
$144,500
|
show details |

|
#3
E 128th St
Cleveland, OH 44120
|
1,894 sq. feet
|
1 baths 4 beds |
$44,900
|
show details |

|
#4
Ashland Dr
Brook Park, OH 44142
|
888 sq. feet
|
1 baths 3 beds |
$214,500
|
show details |

|
#5
E 134th St
Cleveland, OH 44105
|
1,549 sq. feet
|
1 baths 3 beds |
$129,900
|
show details |

|
#6
Wilmington Rd
Cleveland, OH 44121
|
1,278 sq. feet
|
1 baths 3 beds |
$134,900
|
show details |

|
#7
Sugar Ridge Rd
North Ridgeville, OH 44039
|
1,823 sq. feet
|
2 baths 4 beds |
$354,900
|
show details |

|
#8
E 147th St
Cleveland, OH 44120
|
2,360 sq. feet
|
3 baths 5 beds |
$22,500
|
show details |

|
#9
Arcade Ave
Cleveland, OH 44110
|
2,036 sq. feet
|
2 baths 4 beds |
$8,500
|
show details |

|
#10
E 128th St
Cleveland, OH 44120
|
2,590 sq. feet
|
3 baths 5 beds |
$22,500
|
show details |
| Photo | Address | Area | Beds / Baths | Price | Details |
|---|---|---|---|---|---|

|
#11
E 97th St
Cleveland, OH 44105
|
- sq. feet
|
1 baths 5 beds |
$62,400
|
show details |

|
#12
Maryland Ave
Cleveland, OH 44105
|
1,908 sq. feet
|
2 baths 4 beds |
$29,900
|
show details |

|
#13
Daleford Rd
Cleveland, OH 44120
|
3,164 sq. feet
|
3 baths 6 beds |
show details | |

|
#14
Van Aken Blvd Apt 207
Beachwood, OH 44122
|
798 sq. feet
|
1 baths 2 beds |
show details | |

|
#15
Lindbergh Blvd
Olmsted Falls, OH 44138
|
3,191 sq. feet
|
3 baths 4 beds |
show details | |

|
#16
Dellwood Rd
Cleveland, OH 44118
|
1,628 sq. feet
|
2 baths 3 beds |
show details | |

|
#17
Antler Ln
Strongsville, OH 44136
|
2,946 sq. feet
|
4 baths 5 beds |
show details | |

|
#18
W 67th St
Cleveland, OH 44102
|
1,050 sq. feet
|
1 baths 3 beds |
show details | |

|
#19
Sherborn Rd
Cleveland, OH 44130
|
1,278 sq. feet
|
2 baths 3 beds |
show details | |

|
#20
Carlyon Rd
Cleveland, OH 44112
|
1,854 sq. feet
|
1 baths 4 beds |
show details |
| Photo | Address | Area | Beds / Baths | Price | Details |
|---|---|---|---|---|---|

|
#21
Reserve Way
Columbia Station, OH 44028
|
2,997 sq. feet
|
3 baths 4 beds |
show details | |

|
#22
Nicholson Ave
Lakewood, OH 44107
|
1,224 sq. feet
|
1 baths 3 beds |
show details | |

|
#23
W 50th St
Cleveland, OH 44102
|
2,305 sq. feet
|
2 baths 4 beds |
show details | |

|
#24
Cedarbrook Rd
Cleveland, OH 44118
|
1,067 sq. feet
|
1 baths 3 beds |
show details | |

|
#25
E 101st St
Cleveland, OH 44108
|
1,760 sq. feet
|
2 baths 4 beds |
show details | |

|
#26
Dellwood Rd
Cleveland, OH 44118
|
1,519 sq. feet
|
2 baths 3 beds |
show details | |

|
#27
Rosewood Ave
Lakewood, OH 44107
|
1,354 sq. feet
|
1 baths 3 beds |
show details | |

|
#28
Cottonwood Ln
North Royalton, OH 44133
|
2,626 sq. feet
|
3 baths 4 beds |
show details | |

|
#29
Pease Dr Apt 207n
Rocky River, OH 44116
|
911 sq. feet
|
2 baths 2 beds |
show details | |

|
#30
Royalton Rd
Brecksville, OH 44141
|
1,339 sq. feet
|
1 baths 3 beds |
show details |
| Photo | Address | Area | Beds / Baths | Price | Details |
|---|---|---|---|---|---|

|
#31
Ridgeview Blvd
North Ridgeville, OH 44039
|
1,548 sq. feet
|
2 baths 3 beds |
show details | |

|
#32
Marion Rd
North Olmsted, OH 44070
|
1,206 sq. feet
|
2 baths 3 beds |
show details | |

|
#33
Edgewater Dr Apt 908
Lakewood, OH 44107
|
793 sq. feet
|
1 baths 1 beds |
show details | |

|
#34
Greenwich Ave
North Ridgeville, OH 44039
|
1,092 sq. feet
|
2 baths 2 beds |
show details | |

|
#35
Warren Rd
Lakewood, OH 44107
|
2,767 sq. feet
|
2 baths 4 beds |
show details | |

|
#36
Clifton Blvd
Lakewood, OH 44107
|
2,006 sq. feet
|
2 baths 4 beds |
show details | |

|
#37
Archer Rd
Bedford, OH 44146
|
1,322 sq. feet
|
1 baths 4 beds |
show details | |

|
#38
Bridge Ave
Cleveland, OH 44113
|
2,235 sq. feet
|
3 baths 4 beds |
show details | |

|
#39
Idlewood Ave
Cleveland, OH 44112
|
2,996 sq. feet
|
3 baths 6 beds |
show details | |

|
#40
Maple Ridge Rd
North Olmsted, OH 44070
|
1,008 sq. feet
|
2 baths 3 beds |
show details |
| Photo | Address | Area | Beds / Baths | Price | Details |
|---|---|---|---|---|---|

|
#41
Fairlawn Dr
North Olmsted, OH 44070
|
1,738 sq. feet
|
2 baths 3 beds |
show details | |

|
#42
E 59th St
Cleveland, OH 44105
|
1,632 sq. feet
|
2 baths 4 beds |
show details | |

|
#43
Greenview Dr
Columbia Station, OH 44028
|
1,482 sq. feet
|
2 baths 3 beds |
show details | |

|
#44
Lorain Rd
North Ridgeville, OH 44039
|
1,256 sq. feet
|
2 baths 2 beds |
show details | |

|
#45
Independence Rd
Cleveland, OH 44105
|
1,309 sq. feet
|
2 baths 3 beds |
show details | |

|
#46
Huntsford Dr
Macedonia, OH 44056
|
1,566 sq. feet
|
2 baths 3 beds |
show details | |

|
#47
Pease Dr Apt 116n
Rocky River, OH 44116
|
889 sq. feet
|
1 baths 1 beds |
show details | |

|
#48
Lindbergh Blvd
Olmsted Falls, OH 44138
|
2,427 sq. feet
|
2 baths 3 beds |
show details | |

|
#49
Castlewood Ave
Cleveland, OH 44108
|
1,614 sq. feet
|
1 baths 3 beds |
show details | |

|
Check over 1 million property listings on Foreclosure.com!
|
browse all offers | |||


Median year apartment built: 1969
Household type by relationship:
Households: 20,366- Male householders: 4,372 (1,531 living alone), Female householders: 4,808 (1,946 living alone)
3,522 spouses (3,495 opposite-sex spouses), 837 unmarried partners, (826 opposite-sex unmarried partners), 5,333 children (4,971 natural, 196 adopted, 165 stepchildren), 239 grandchildren, 121 brothers or sisters, 230 parents, 23 foster children, 141 other relatives, 519 non-relatives
- In group quarters: 217
Size of family households: 2,685 2-persons, 930 3-persons, 725 4-persons, 632 5-persons, 136 6-persons, 7 7-or-more-persons.
Size of nonfamily households: 3,502 1-person, 648 2-persons, 69 3-persons, 35 4-persons.
2,184 married couples with children.
1,286 single-parent households (207 men, 1,079 women).
84.4% of residents of Parma Heights speak English at home.
4.4% of residents speak Spanish at home (80% speak English very well, 12% speak English well, 7% speak English not well).
8.8% of residents speak other Indo-European language at home (70% speak English very well, 19% speak English well, 7% speak English not well, 4% don't speak English at all).
0.4% of residents speak Asian or Pacific Island language at home (60% speak English very well, 12% speak English well, 21% speak English not well, 7% don't speak English at all).
2.2% of residents speak other language at home (61% speak English very well, 36% speak English well, 2% speak English not well).
Foreign born population: 1,882 (9.2%)
(64.6% of them are naturalized citizens)
| Here: | 6.2 |
| State: | 6.7 |
| Here: | 3.9 |
| State: | 4.4 |

- Bedrooms in owner-occupied houses and condos in Parma Heights, Ohio
- 0no bedroom
- 631 bedroom
- 5682 bedrooms
- 3,8513 bedrooms
- 8014 bedrooms
- 1515+ bedrooms

- Bedrooms in renter-occupied apartments in Parma Heights, Ohio
- 100no bedroom
- 1,2451 bedroom
- 2,0032 bedrooms
- 5383 bedrooms
- 324 bedrooms
- 255+ bedrooms

- Cars and other vehicles available in Parma Heights in owner-occupied houses/condos
- 171no vehicle
- 1,8841 vehicle
- 2,4432 vehicles
- 5863 vehicles
- 2634 vehicles
- 865+ vehicles

- Cars and other vehicles available in Parma Heights in renter-occupied apartments
- 602no vehicle
- 2,1121 vehicle
- 8932 vehicles
- 3223 vehicles
- 124 vehicles
- 35+ vehicles

- Rooms in owner-occupied houses in Parma Heights, Ohio
- 01 room
- 02 rooms
- 1483 rooms
- 2374 rooms
- 9055 rooms
- 1,9296 rooms
- 1,1377 rooms
- 5758 rooms
- 5029+ rooms

- Rooms in renter-occupied apartments in Parma Heights, Ohio
- 911 room
- 642 rooms
- 1,1043 rooms
- 1,4634 rooms
- 8355 rooms
- 1906 rooms
- 557 rooms
- 978 rooms
- 449+ rooms


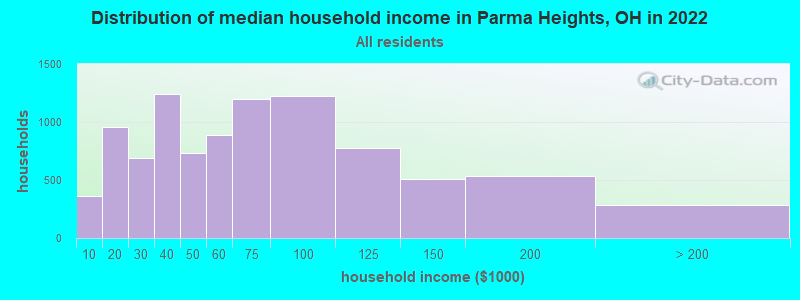
Parma Heights, OH household income distribution

- 362Less than $10,000
- 954$10,000 to $19,999
- 691$20,000 to $29,999
- 1,243$30,000 to $39,999
- 729$40,000 to $49,999
- 885$50,000 to $59,999
- 1,198$60,000 to $74,999
- 1,220$75,000 to $99,999
- 780$100,000 to $124,999
- 506$125,000 to $149,999
- 532$150,000 to $199,999
- 282$200,000 or more
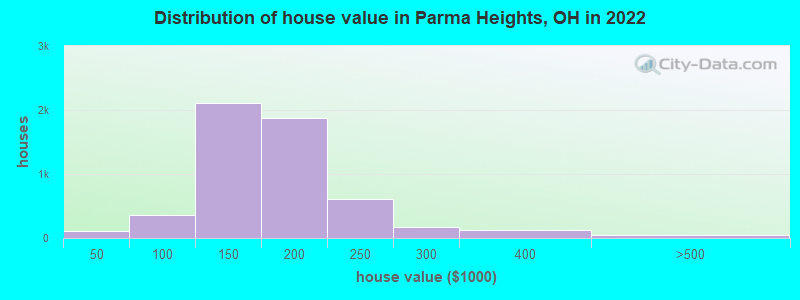
Home value of owner - occupied houses in 2022 in Parma Heights, OH
-
- 39$10,000 to $14,999
- 18$15,000 to $19,999
- 4$20,000 to $24,999
- 10$25,000 to $29,999
- 19$30,000 to $34,999
- 13$40,000 to $49,999
- 20$50,000 to $59,999
- 25$60,000 to $69,999
- 91$70,000 to $79,999
- 74$80,000 to $89,999
- 133$90,000 to $99,999
- 808$100,000 to $124,999
- 1,305$125,000 to $149,999
- 1,263$150,000 to $174,999
- 605$175,000 to $199,999
- 606$200,000 to $249,999
- 171$250,000 to $299,999
- 126$300,000 to $399,999
- 26$400,000 to $499,999
- 19$500,000 to $749,999
- 8$1,500,000 to $1,999,999
Rent paid by renters in 2022 in Parma Heights, OH
-
- 8$100 to $149
- 44$300 to $349
- 17$350 to $399
- 12$400 to $449
- 41$500 to $549
- 62$550 to $599
- 186$600 to $649
- 77$650 to $699
- 310$700 to $749
- 337$750 to $799
- 747$800 to $899
- 593$900 to $999
- 1,035$1,000 to $1,249
- 215$1,250 to $1,499
- 86$1,500 to $1,999
- 75No cash rent


Percentage of workers working in this county: 88.3%
Number of people working at home: 1,273 (12.2% of all workers)
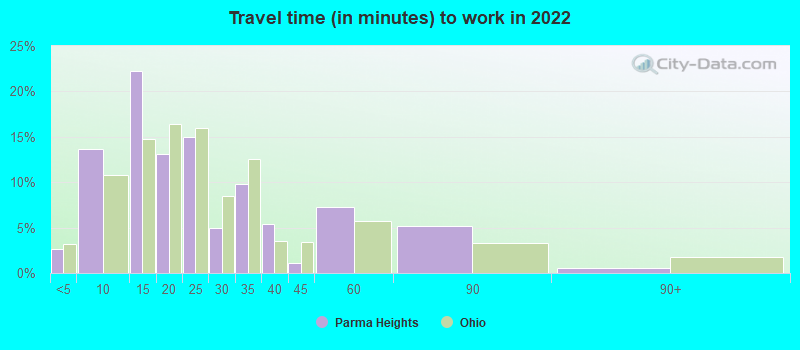
Travel time to work (commute)
- Less than 5 minutes: 158
- 5 to 9 minutes: 734
- 10 to 14 minutes: 1,031
- 15 to 19 minutes: 1,705
- 20 to 24 minutes: 1,452
- 25 to 29 minutes: 1,201
- 30 to 34 minutes: 1,363
- 35 to 39 minutes: 227
- 40 to 44 minutes: 254
- 45 to 59 minutes: 612
- 60 to 89 minutes: 93
- 90 or more minutes: 155
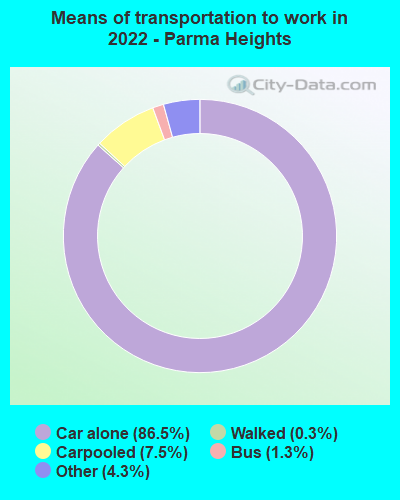
Means of transportation to work:
- Drove a car alone: 2,768 (65.0%)
- Carpooled: 241 (5.7%)
- Bus: 37 (0.9%)
- Taxi: 144 (3.4%)
- Walked: 13 (0.3%)
- Worked at home: 1,273 (29.9%)

- Unemployment by race in 2022
- Unemployment rate for White non-Hispanic residents
- 1.7%Males
- 1.6%Females
- Unemployment rate for Black residents
- 3.3%Females
- Unemployment rate for other race residents
- 57.1%Males
- Unemployment rate for Hispanic or Latino residents
- 9.0%Males
- 29.0%Females

- Year of entry for the foreign-born population in Parma Heights, Ohio
- 6802010 or later
- 3542000 to 2009
- 3281990 to 1999
- 2611980 to 1989
- 2111970 to 1979
- 753Before 1970

First ancestries reported:
- German: 871 (9.0%)
- Polish: 672 (7.0%)
- Italian: 577 (6.0%)
- American: 434 (4.5%)
- Irish: 427 (4.4%)
- Ukrainian: 347 (3.6%)
- Albanian: 246 (2.5%)
- Palestinian: 224 (2.3%)
- Hungarian: 210 (2.2%)
- African: 160 (1.7%)
- Greek: 149 (1.5%)
- English: 143 (1.5%)
- Slovak: 135 (1.4%)
- Romanian: 107 (1.1%)
- Czech: 81 (0.8%)
- Ghanaian: 70 (0.7%)
- Egyptian: 66 (0.7%)
- Russian: 65 (0.7%)
- Nigerian: 61 (0.6%)
- Lithuanian: 44 (0.5%)
- Slovene: 41 (0.4%)
- French: 39 (0.4%)
- Scottish: 37 (0.4%)
- Austrian: 33 (0.3%)
- Czechoslovakian: 31 (0.3%)
- European: 30 (0.3%)
- Welsh: 28 (0.3%)
- British: 27 (0.3%)
- Slavic: 24 (0.2%)
- Yugoslavian: 19 (0.2%)
- Croatian: 18 (0.2%)
- Eastern European: 17 (0.2%)
- Lebanese: 14 (0.1%)
- Dutch: 12 (0.1%)
- Moroccan: 11 (0.1%)
- Northern European: 10 (0.1%)
- Scotch-Irish: 10 (0.1%)
- Swedish: 5 (0.05%)
- Danish: 4 (0.04%)
- French Canadian: 3 (0.03%)
- Arab: 2 (0.02%)
- Brazilian: 1 (0.01%)
Most common places of birth for foreign-born residents (%):
| Parma Heights: | 15.2% (296) |
| Ohio: | 11.6% (66,525) |
| Parma Heights: | 10.4% (203) |
| Ohio: | 1.7% (9,564) |
| Parma Heights: | 10.0% (196) |
| Ohio: | 0.4% (2,186) |
| Parma Heights: | 8.9% (174) |
| Ohio: | 0.8% (4,490) |
| Parma Heights: | 6.9% (134) |
| Ohio: | 1.1% (6,346) |
| Parma Heights: | 5.5% (107) |
| Ohio: | 0.8% (4,651) |
| Parma Heights: | 3.5% (68) |
| Ohio: | 1.2% (6,679) |
| Parma Heights: | 3.1% (61) |
| Ohio: | 0.5% (2,826) |
| Parma Heights: | 3.1% (61) |
| Ohio: | 1.2% (7,029) |
| Parma Heights: | 2.8% (55) |
| Ohio: | 0.2% (1,179) |
| Parma Heights: | 2.8% (55) |
| Ohio: | 2.0% (11,398) |
| Parma Heights: | 2.0% (39) |
| Ohio: | 2.2% (12,846) |
| Parma Heights: | 1.9% (37) |
| Ohio: | 0.5% (2,631) |
| Parma Heights: | 1.8% (35) |
| Ohio: | 3.1% (17,818) |
| Parma Heights: | 1.6% (31) |
| Ohio: | 1.1% (6,096) |
Place of birth for U.S.-born residents:
- This state: 15,422
- Other state: 2,714
- Northeast: 1,132
- Midwest: 364
- South: 972
- West: 255
87.2% of Parma Heights residents lived in the same house 1 years ago.
Out of people who lived in different houses, 41.9% lived in this county.
Out of people who lived in different counties, 71.1% lived in Ohio.
| Parma Heights: | 87.2% |
| State average: | 87.8% |
Education attainment for males 25 years and older:
- No schooling: 39
- Nursery to 4th grade: 7
- 5th and 6th grade: 6
- 7th and 8th grade: 18
- 9th grade: 37
- 10th grade: 64
- 11th grade: 130
- 12th grade, no diploma: 139
- High school graduate (or equivalency): 2,498
- Less than 1 year of college: 537
- Some college more than 1 year, no degree: 865
- Associate degree: 883
- Bachelor's degree: 1,183
- Master's degree: 440
- Professional school degree: 116
- Doctorate degree: 19

Education attainment for females 25 years and older:
- No schooling: 81
- Nursery to 4th grade: 0
- 5th and 6th grade: 5
- 7th and 8th grade: 147
- 9th grade: 39
- 10th grade: 213
- 11th grade: 141
- 12th grade, no diploma: 220
- High school graduate (or equivalency): 2,341
- Less than 1 year of college: 792
- Some college more than 1 year, no degree: 786
- Associate degree: 743
- Bachelor's degree: 1,451
- Master's degree: 756
- Professional school degree: 19
- Doctorate degree: 27


Housing units in structures:
- One, detached: 5,830
- One, attached: 161
- Two: 50
- 3 or 4: 313
- 5 to 9: 678
- 10 to 19: 579
- 20 to 49: 379
- 50 or more: 1,915
- Mobile homes: 18
Housing units lacking complete kitchen facilities in 2022: 1.5%
House/condo owner moved in on average 12 years ago
Renter moved in on average 2 years ago

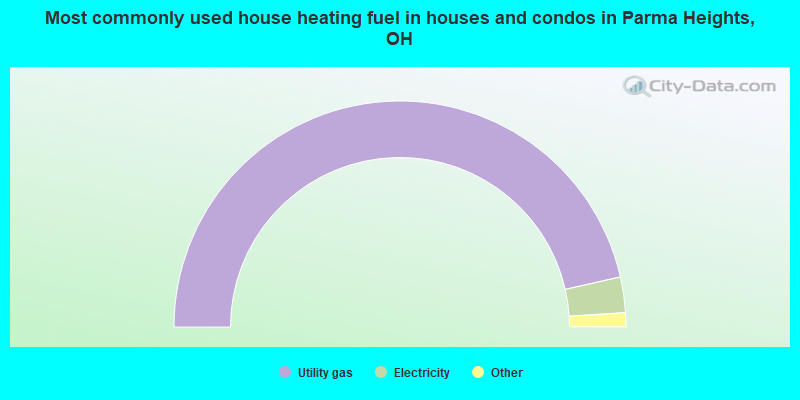
- 92.9%Utility gas
- 5.1%Electricity
- 1.7%Bottled, tank, or LP gas
- 0.3%Wood
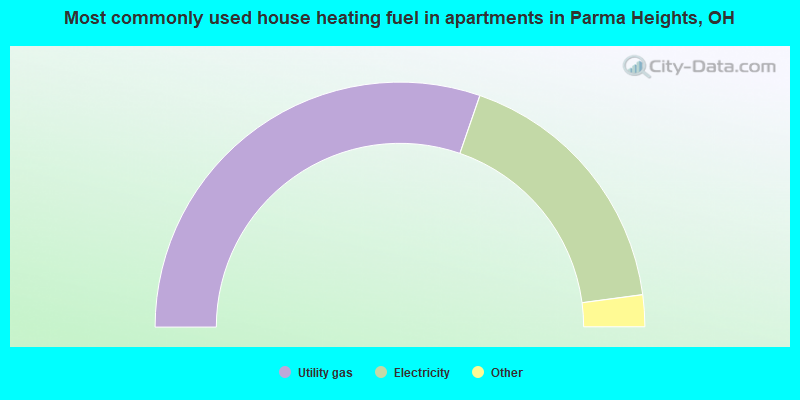
- 60.6%Utility gas
- 35.2%Electricity
- 2.0%No fuel used
- 1.3%Bottled, tank, or LP gas
- 0.8%Other fuel
Private vs. public school enrollment:
| Here: | 25.6% |
| Ohio: | 16.0% |
| Here: | 26.9% |
| Ohio: | 13.1% |
| Here: | 12.1% |
| Ohio: | 22.3% |


