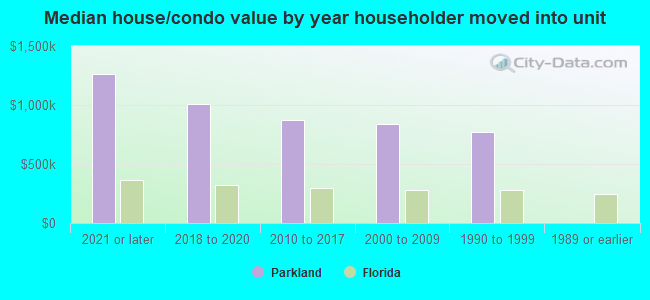
Parkland, FL (Florida) Houses and Residents
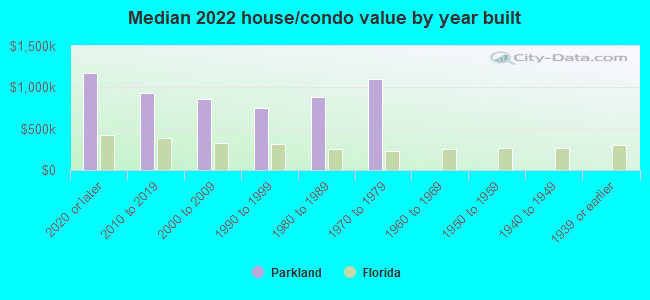
| Parkland: | $901,021 |
| Florida: | $354,100 |
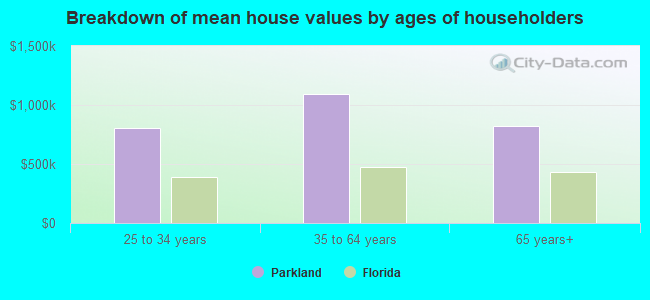
Mean price in 2022:
Detached houses: $1,026,941
Here: $1,026,941 State: $500,941 Townhouses or other attached units: $569,809
Here: $569,809 State: $370,869 In 3-to-4-unit structures: $552,318
Here: $552,318 State: $309,944 In 5-or-more-unit structures: $421,216
Here: $421,216 State: $447,145
Total population: 28,131 (Urban population: 13,601, Rural population: 387 (all nonfarm))
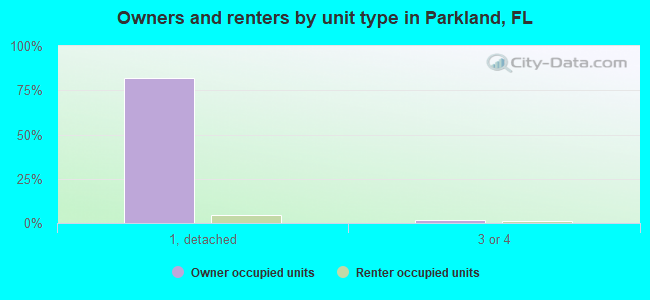
Houses: 11,113 (10,499 occupied: 9,115 owner occupied, 1,448 renter occupied)
| % of renters here: | 14% |
| State: | 33% |
Housing density: 1,090 houses/condos per square mile
Median price asked for vacant for-sale houses and condos in 2022 in this county: $504,762.
Median contract rent in 2022: over $2,000 (lower quartile is over $2,000, upper quartile is over $2,000)
Median rent asked for vacant for-rent units in 2022: $1,924
Median gross rent in Parkland, FL in 2022: over $2,000
Housing units in Parkland with a mortgage: 6,902 (773 second mortgage, 13 home equity loan, 606 both second mortgage and home equity loan)
Houses without a mortgage: 0
Median household income for houses/condos with a mortgage: $210,824
Median household income for apartments without a mortgage: $151,575
Median monthly housing costs: $3,469
Compare current foreclosures near Parkland, FL:
| Photo | Address | Area | Beds / Baths | Price | Details |
|---|---|---|---|---|---|

|
#1
Bridgewood Dr
Boca Raton, FL 33434
|
1,400 sq. feet
|
2 baths 2 beds |
$165,000
|
show details |

|
#2
NW 104th Ave Apt 405
Fort Lauderdale, FL 33322
|
965 sq. feet
|
2 baths 2 beds |
$112,000
|
show details |

|
#3
Poppy Pl 52-B
Delray Beach, FL 33484
|
1,220 sq. feet
|
2 baths 2 beds |
$193,800
|
show details |

|
#4
NE 35th St
Fort Lauderdale, FL 33306
|
4,419 sq. feet
|
4 baths 6 beds |
$1,821,600
|
show details |

|
#5
Westgate Ln Apt D
Boynton Beach, FL 33436
|
1,808 sq. feet
|
2 baths 2 beds |
$130,000
|
show details |

|
#6
Briarwood Cir Apt 4
Boynton Beach, FL 33437
|
2,227 sq. feet
|
2 baths 2 beds |
$321,100
|
show details |

|
#7
NE 11th St Apt 310
Fort Lauderdale, FL 33304
|
976 sq. feet
|
1 baths 1 beds |
$206,550
|
show details |

|
#8
Sunrise Lakes Dr N Apt 312
Fort Lauderdale, FL 33322
|
850 sq. feet
|
2 baths 2 beds |
$155,000
|
show details |

|
#9
SW 13th St
Boca Raton, FL 33486
|
1,596 sq. feet
|
2 baths 4 beds |
$535,500
|
show details |

|
#10
Little Palm Ln
Boca Raton, FL 33428
|
3,253 sq. feet
|
3 baths 4 beds |
$910,000
|
show details |
| Photo | Address | Area | Beds / Baths | Price | Details |
|---|---|---|---|---|---|

|
#11
Radice Crt Apt 805
Fort Lauderdale, FL 33319
|
1,149 sq. feet
|
2 baths 1 beds |
$155,000
|
show details |

|
#12
Trent Dr # 207
Fort Lauderdale, FL 33321
|
1,456 sq. feet
|
2 baths 2 beds |
$202,350
|
show details |

|
#13
Port Royale Dr N Apt 905
Fort Lauderdale, FL 33308
|
1,290 sq. feet
|
2 baths 2 beds |
$374,400
|
show details |

|
#14
Ft Lauderdale Beach
Fort Lauderdale, FL 33304
|
1,308 sq. feet
|
1 baths 1 beds |
$339,900
|
show details |

|
#15
NW 19th Ave
Fort Lauderdale, FL 33311
|
- sq. feet
|
2 baths 3 beds |
$338,000
|
show details |

|
#16
S Ocean Blvd Apt 6v
Boca Raton, FL 33432
|
- sq. feet
|
2 baths 2 beds |
$493,500
|
show details |

|
#17
Sunrise Lakes Blvd Apt 408
Fort Lauderdale, FL 33322
|
810 sq. feet
|
2 baths 2 beds |
show details | |

|
#18
Spanish Moss Ter Apt 401
Fort Lauderdale, FL 33319
|
1,200 sq. feet
|
2 baths 2 beds |
show details | |

|
#19
NW 33rd St
Fort Lauderdale, FL 33319
|
1,076 sq. feet
|
2 baths 2 beds |
show details | |

|
#20
Spanish Moss Ter Apt 111
Fort Lauderdale, FL 33319
|
1,200 sq. feet
|
2 baths 2 beds |
show details |
| Photo | Address | Area | Beds / Baths | Price | Details |
|---|---|---|---|---|---|

|
#21
Spanish Moss Ter Apt 208
Fort Lauderdale, FL 33319
|
1,200 sq. feet
|
2 baths 2 beds |
show details | |

|
#22
NW 25th St
Fort Lauderdale, FL 33313
|
1,340 sq. feet
|
2 baths 2 beds |
show details | |

|
#23
NW 35th St Apt 405
Fort Lauderdale, FL 33319
|
944 sq. feet
|
2 baths 2 beds |
show details | |

|
#24
NW 60th Ave
Fort Lauderdale, FL 33313
|
1,612 sq. feet
|
2 baths 3 beds |
show details | |

|
#25
NW 33rd Ter
Fort Lauderdale, FL 33309
|
1,522 sq. feet
|
2 baths 3 beds |
show details | |

|
#26
NW 1st Ave
Fort Lauderdale, FL 33309
|
856 sq. feet
|
1 baths 2 beds |
show details | |

|
#27
NW 24th Pl
Fort Lauderdale, FL 33322
|
1,360 sq. feet
|
2 baths 3 beds |
show details | |

|
#28
NW 94th Ave # 4j
Fort Lauderdale, FL 33351
|
1,195 sq. feet
|
2 baths 3 beds |
show details | |

|
#29
NW 48th Ave Apt 403
Fort Lauderdale, FL 33319
|
944 sq. feet
|
2 baths 2 beds |
show details | |

|
#30
NW 91st Ln
Fort Lauderdale, FL 33351
|
1,556 sq. feet
|
2 baths 3 beds |
show details |
| Photo | Address | Area | Beds / Baths | Price | Details |
|---|---|---|---|---|---|

|
#31
NE 28th Ave Apt A3
Pompano Beach, FL 33064
|
940 sq. feet
|
2 baths 2 beds |
show details | |

|
#32
Demedici Cir
Delray Beach, FL 33446
|
2,057 sq. feet
|
2 baths 2 beds |
show details | |

|
#33
Hillsboro Mile Apt 812
Pompano Beach, FL 33062
|
1,330 sq. feet
|
1 baths 2 beds |
show details | |

|
#34
Hillsboro Mile Apt 312
Pompano Beach, FL 33062
|
1,330 sq. feet
|
1 baths 2 beds |
show details | |

|
#35
Hillsboro Mile Apt 615
Pompano Beach, FL 33062
|
1,500 sq. feet
|
2 baths 2 beds |
show details | |

|
#36
NW 34th St
Fort Lauderdale, FL 33319
|
1,055 sq. feet
|
2 baths 2 beds |
show details | |

|
#37
NE 25th Ave
Pompano Beach, FL 33062
|
1,660 sq. feet
|
2 baths 2 beds |
show details | |

|
#38
NW 34th St
Fort Lauderdale, FL 33319
|
1,055 sq. feet
|
2 baths 3 beds |
show details | |

|
#39
NW 34th Ave
Fort Lauderdale, FL 33309
|
1,795 sq. feet
|
2 baths 3 beds |
show details | |

|
#40
NW 36th St
Fort Lauderdale, FL 33319
|
1,377 sq. feet
|
2 baths 3 beds |
show details |
| Photo | Address | Area | Beds / Baths | Price | Details |
|---|---|---|---|---|---|

|
#41
Saxony O
Delray Beach, FL 33446
|
883 sq. feet
|
2 baths 2 beds |
show details | |

|
#42
NW 84th Ave # C6
Fort Lauderdale, FL 33351
|
944 sq. feet
|
1 baths 2 beds |
show details | |

|
#43
NW 40th St
Fort Lauderdale, FL 33309
|
1,522 sq. feet
|
2 baths 3 beds |
show details | |

|
#44
NE 28th Ave
Pompano Beach, FL 33064
|
3,550 sq. feet
|
2 baths 3 beds |
show details | |

|
#45
N Nob Hill Rd Apt 205
Fort Lauderdale, FL 33351
|
1,074 sq. feet
|
2 baths 2 beds |
show details | |

|
#46
NW 5th Ave
Fort Lauderdale, FL 33309
|
1,484 sq. feet
|
1 baths 2 beds |
show details | |

|
#47
NE 28th St Apt 13
Pompano Beach, FL 33064
|
880 sq. feet
|
2 baths 1 beds |
show details | |

|
#48
NW 34th Pl Apt B207
Fort Lauderdale, FL 33351
|
1,080 sq. feet
|
2 baths 2 beds |
show details | |

|
#49
NW 35th Pl
Fort Lauderdale, FL 33351
|
1,880 sq. feet
|
2 baths 3 beds |
show details | |

|
Check over 1 million property listings on Foreclosure.com!
|
browse all offers | |||

Latest news about housing in Parkland, FL collected exclusively by city-data.com from local newspapers, TV, and radio stations

 | Broward Housing Market. (63 replies) |
| New construction Homes in Heron Bay Parkland (9 replies) |
| Parkland Shooting (158 replies) |
| Another Housing Boom in South Florida As Peak of Baby Boomers Retire (16 replies) |
| Relocating to South Florida (53 replies) |
| homes - new Vs resale (7 replies) |

Median year apartment built: 2003
Household type by relationship:
Households: 34,941- Male householders: 5,864 (529 living alone), Female householders: 4,576 (762 living alone)
7,833 spouses (7,801 opposite-sex spouses), 564 unmarried partners, (564 opposite-sex unmarried partners), 13,913 children (13,236 natural, 406 adopted, 270 stepchildren), 257 grandchildren, 72 brothers or sisters, 686 parents, 0 foster children, 733 other relatives, 402 non-relatives
- In group quarters: 37
Size of family households: 2,332 2-persons, 2,038 3-persons, 2,547 4-persons, 1,253 5-persons, 536 6-persons, 72 7-or-more-persons.
Size of nonfamily households: 1,279 1-person, 377 2-persons, 42 3-persons, 54 4-persons.
9,312 married couples with children.
1,299 single-parent households (805 men, 494 women).
71.9% of residents of Parkland speak English at home.
12.1% of residents speak Spanish at home (77% speak English very well, 14% speak English well, 5% speak English not well, 4% don't speak English at all).
9.6% of residents speak other Indo-European language at home (86% speak English very well, 8% speak English well, 5% speak English not well, 2% don't speak English at all).
3.2% of residents speak Asian or Pacific Island language at home (70% speak English very well, 21% speak English well, 7% speak English not well, 1% don't speak English at all).
1.7% of residents speak other language at home (98% speak English very well, 1% speak English well, 1% don't speak English at all).
Foreign born population: 8,223 (23.5%)
(70.2% of them are naturalized citizens)
| Here: | 7.3 |
| State: | 5.9 |
| Here: | 4.6 |
| State: | 4.2 |
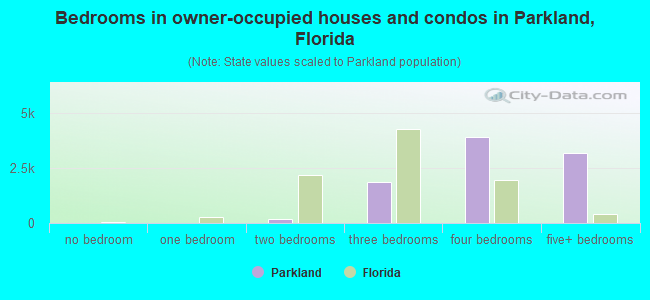
- Bedrooms in owner-occupied houses and condos in Parkland, Florida
- 0no bedroom
- 01 bedroom
- 1912 bedrooms
- 1,8523 bedrooms
- 3,8914 bedrooms
- 3,1815+ bedrooms
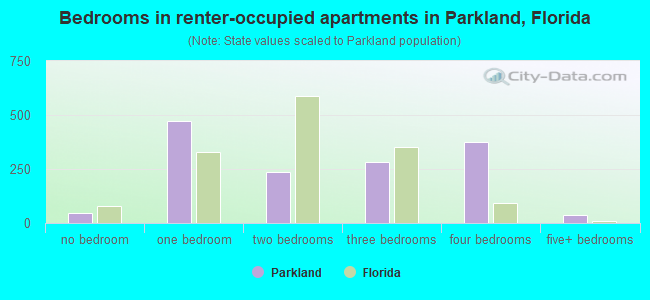
- Bedrooms in renter-occupied apartments in Parkland, Florida
- 44no bedroom
- 4741 bedroom
- 2382 bedrooms
- 2823 bedrooms
- 3744 bedrooms
- 385+ bedrooms
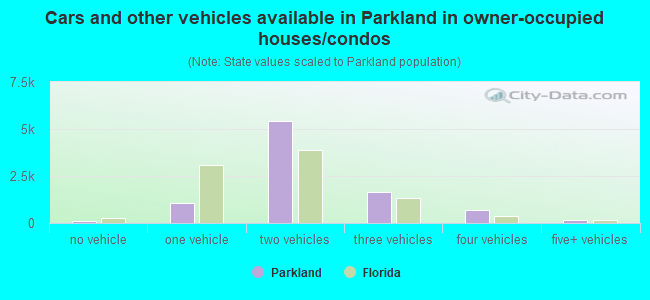
- Cars and other vehicles available in Parkland in owner-occupied houses/condos
- 107no vehicle
- 1,0831 vehicle
- 5,4222 vehicles
- 1,6473 vehicles
- 7024 vehicles
- 1545+ vehicles
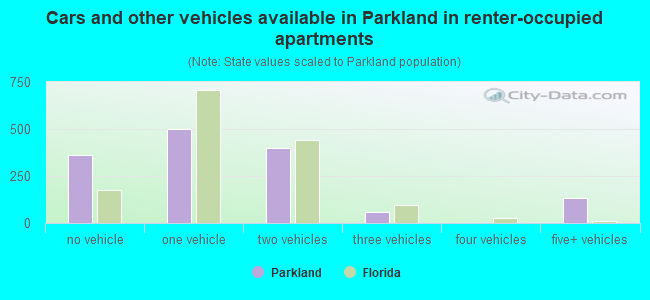
- Cars and other vehicles available in Parkland in renter-occupied apartments
- 362no vehicle
- 5001 vehicle
- 3972 vehicles
- 563 vehicles
- 04 vehicles
- 1335+ vehicles
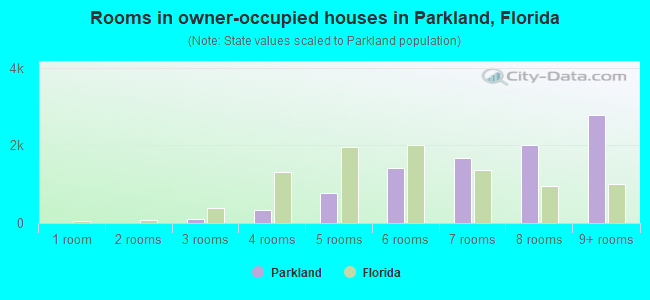
- Rooms in owner-occupied houses in Parkland, Florida
- 01 room
- 02 rooms
- 1053 rooms
- 3444 rooms
- 7705 rooms
- 1,4156 rooms
- 1,6867 rooms
- 2,0148 rooms
- 2,7829+ rooms
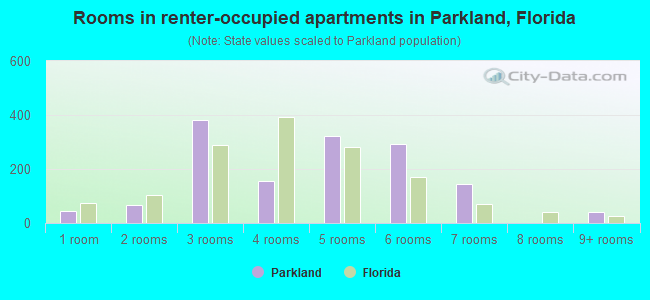
- Rooms in renter-occupied apartments in Parkland, Florida
- 441 room
- 682 rooms
- 3823 rooms
- 1574 rooms
- 3225 rooms
- 2916 rooms
- 1447 rooms
- 08 rooms
- 419+ rooms
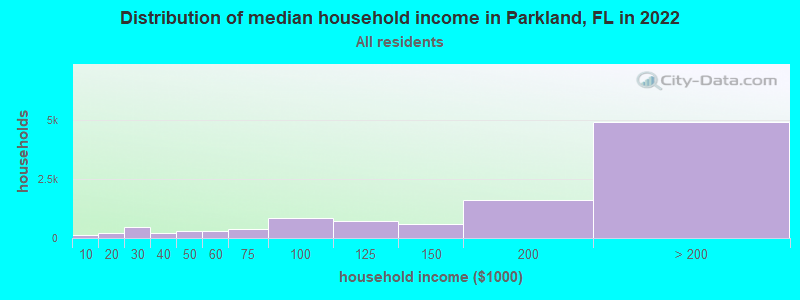
Parkland, FL household income distribution

- 143Less than $10,000
- 198$10,000 to $19,999
- 447$20,000 to $29,999
- 208$30,000 to $39,999
- 299$40,000 to $49,999
- 303$50,000 to $59,999
- 399$60,000 to $74,999
- 868$75,000 to $99,999
- 704$100,000 to $124,999
- 601$125,000 to $149,999
- 1,627$150,000 to $199,999
- 4,934$200,000 or more
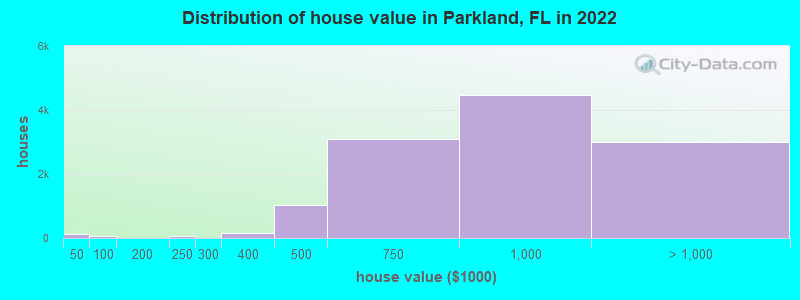
Home value of owner - occupied houses in 2022 in Parkland, FL
-
- 110Less than $10,000
- 59$70,000 to $79,999
- 52$200,000 to $249,999
- 10$250,000 to $299,999
- 167$300,000 to $399,999
- 1,022$400,000 to $499,999
- 3,093$500,000 to $749,999
- 4,469$750,000 to $999,999
- 2,221$1,000,000 to $1,499,999
- 604$1,500,000 to $1,999,999
- 161$2,000,000 or more
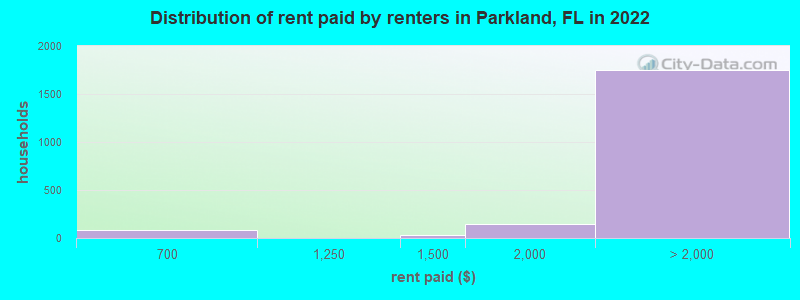
Rent paid by renters in 2022 in Parkland, FL
-
- 87$650 to $699
- 28$1,250 to $1,499
- 141$1,500 to $1,999
- 454$2,000 to $2,499
- 304$2,500 to $2,999
- 467$3,000 to $3,499
- 503$3,500 or more
- 21No cash rent
Percentage of workers working in this county: 74.0%
Number of people working at home: 5,559 (35.3% of all workers)
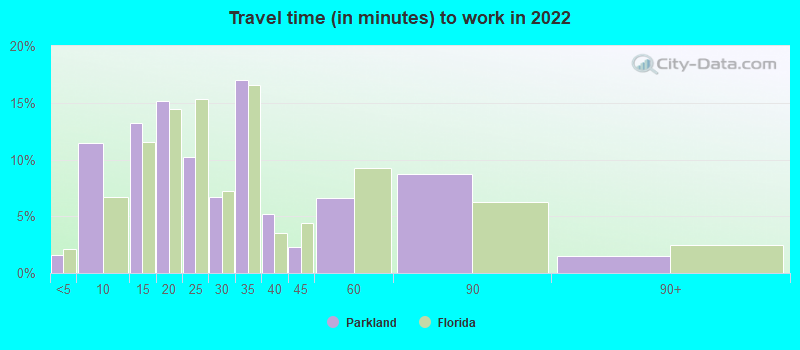
Travel time to work (commute)
- Less than 5 minutes: 27
- 5 to 9 minutes: 578
- 10 to 14 minutes: 635
- 15 to 19 minutes: 876
- 20 to 24 minutes: 1,694
- 25 to 29 minutes: 822
- 30 to 34 minutes: 2,604
- 35 to 39 minutes: 624
- 40 to 44 minutes: 411
- 45 to 59 minutes: 1,843
- 60 to 89 minutes: 714
- 90 or more minutes: 122
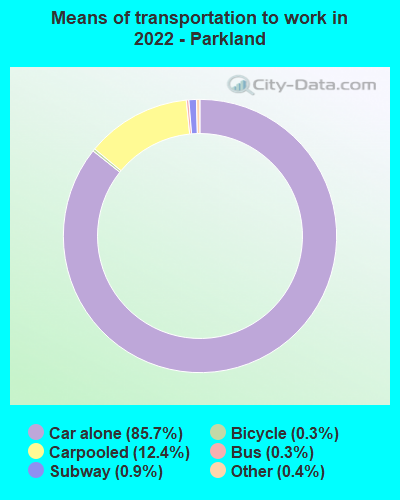
Means of transportation to work:
- Drove a car alone: 3,940 (43.1%)
- Carpooled: 647 (7.1%)
- Bus: 16 (0.2%)
- Long-distance train or commuter rail: 39 (0.4%)
- Taxi: 21 (0.2%)
- Bicycle: 17 (0.2%)
- Worked at home: 5,559 (60.8%)
- Unemployment by race in 2022
- Unemployment rate for White non-Hispanic residents
- 1.3%Males
- 5.8%Females
- Unemployment rate for Black residents
- 3.7%Males
- 3.3%Females
- Unemployment rate for other race residents
- 1.6%Males
- 21.0%Females
- Unemployment rate for two or more race residents
- 11.1%Males
- Unemployment rate for Hispanic or Latino residents
- 11.8%Males
- 4.1%Females
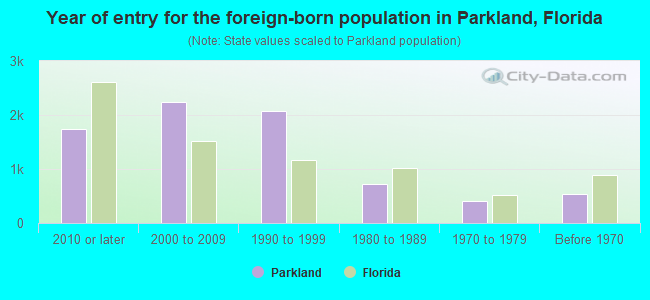
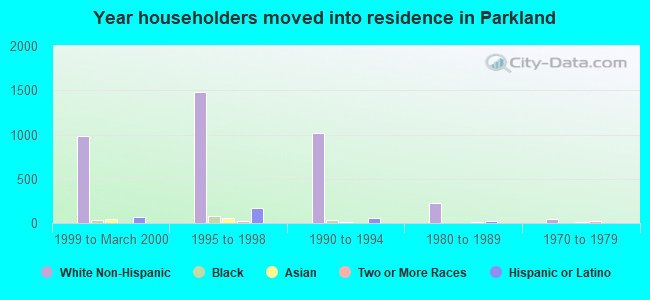
- Year of entry for the foreign-born population in Parkland, Florida
- 1,7332010 or later
- 2,2422000 to 2009
- 2,0781990 to 1999
- 7261980 to 1989
- 4001970 to 1979
- 536Before 1970
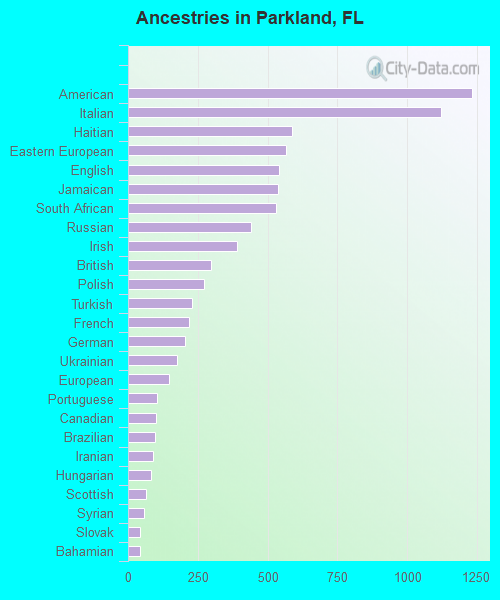
First ancestries reported:
- American: 1,232 (7.0%)
- Italian: 1,122 (6.4%)
- Haitian: 589 (3.4%)
- Eastern European: 566 (3.2%)
- English: 542 (3.1%)
- Jamaican: 538 (3.1%)
- South African: 529 (3.0%)
- Russian: 439 (2.5%)
- Irish: 390 (2.2%)
- British: 296 (1.7%)
- Polish: 272 (1.6%)
- Turkish: 228 (1.3%)
- French: 220 (1.3%)
- German: 206 (1.2%)
- Ukrainian: 177 (1.0%)
- European: 148 (0.8%)
- Portuguese: 105 (0.6%)
- Canadian: 100 (0.6%)
- Brazilian: 95 (0.5%)
- Iranian: 91 (0.5%)
- Hungarian: 81 (0.5%)
- Scottish: 66 (0.4%)
- Syrian: 56 (0.3%)
- Slovak: 43 (0.2%)
- Bahamian: 43 (0.2%)
- Czech: 40 (0.2%)
- Lithuanian: 38 (0.2%)
- Israeli: 34 (0.2%)
- Latvian: 33 (0.2%)
- Swedish: 32 (0.2%)
- Arab: 21 (0.1%)
- West Indian: 17 (0.10%)
- Scotch-Irish: 16 (0.09%)
- Lebanese: 13 (0.07%)
- Norwegian: 13 (0.07%)
- Macedonian: 12 (0.07%)
- Dutch: 11 (0.06%)
- French Canadian: 10 (0.06%)
- Greek: 8 (0.05%)
- Czechoslovakian: 5 (0.03%)
Most common places of birth for foreign-born residents (%):
| Parkland: | 10.9% (900) |
| Florida: | 2.1% (94,349) |
| Parkland: | 7.4% (610) |
| Florida: | 5.7% (262,042) |
| Parkland: | 7.2% (595) |
| Florida: | 7.5% (342,375) |
| Parkland: | 6.4% (529) |
| Florida: | 2.7% (122,906) |
| Parkland: | 5.6% (462) |
| Florida: | 0.3% (14,535) |
| Parkland: | 4.9% (406) |
| Florida: | 1.2% (56,071) |
| Parkland: | 4.8% (396) |
| Florida: | 2.4% (109,132) |
| Parkland: | 4.7% (388) |
| Florida: | 5.0% (227,319) |
| Parkland: | 4.2% (343) |
| Florida: | 0.2% (11,243) |
| Parkland: | 4.0% (332) |
| Florida: | 6.5% (298,669) |
| Parkland: | 3.9% (323) |
| Florida: | 2.1% (96,693) |
| Parkland: | 3.6% (293) |
| Florida: | 1.2% (54,585) |
| Parkland: | 3.4% (279) |
| Florida: | 0.3% (13,053) |
| Parkland: | 2.9% (240) |
| Florida: | 1.3% (57,263) |
| Parkland: | 2.7% (225) |
| Florida: | 0.7% (33,556) |
| Parkland: | 2.2% (178) |
| Florida: | 22.0% (1,006,576) |
| Parkland: | 1.7% (138) |
| Florida: | 0.2% (10,969) |
| Parkland: | 1.7% (138) |
| Florida: | 1.8% (84,403) |
| Parkland: | 1.7% (136) |
| Florida: | 1.3% (60,604) |
Place of birth for U.S.-born residents:
- This state: 12,640
- Other state: 13,146
- Northeast: 6,903
- Midwest: 2,880
- South: 2,579
- West: 763
86.5% of Parkland residents lived in the same house 1 years ago.
Out of people who lived in different houses, 24.4% lived in this county.
Out of people who lived in different counties, 71.0% lived in Florida.
| Parkland: | 86.5% |
| State average: | 86.3% |
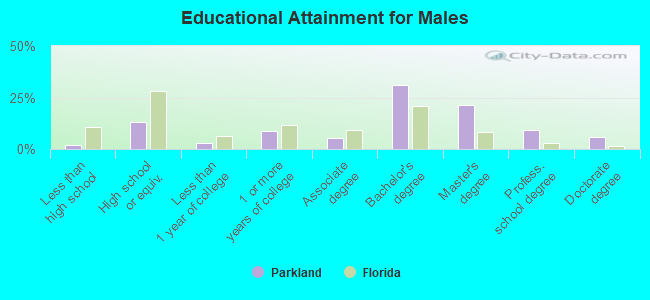
Education attainment for males 25 years and older:
- No schooling: 49
- Nursery to 4th grade: 1
- 5th and 6th grade: 0
- 7th and 8th grade: 0
- 9th grade: 45
- 10th grade: 42
- 11th grade: 0
- 12th grade, no diploma: 88
- High school graduate (or equivalency): 1,442
- Less than 1 year of college: 306
- Some college more than 1 year, no degree: 959
- Associate degree: 595
- Bachelor's degree: 3,369
- Master's degree: 2,293
- Professional school degree: 1,013
- Doctorate degree: 608
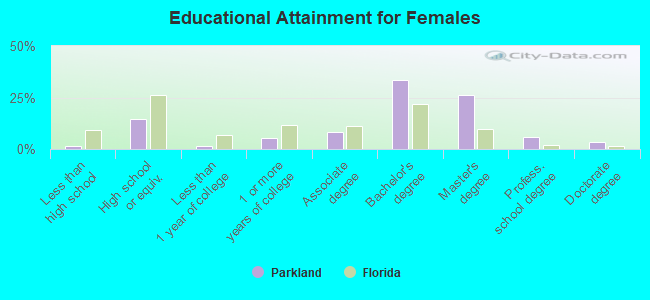
Education attainment for females 25 years and older:
- No schooling: 67
- Nursery to 4th grade: 0
- 5th and 6th grade: 0
- 7th and 8th grade: 0
- 9th grade: 0
- 10th grade: 0
- 11th grade: 5
- 12th grade, no diploma: 93
- High school graduate (or equivalency): 1,656
- Less than 1 year of college: 185
- Some college more than 1 year, no degree: 582
- Associate degree: 926
- Bachelor's degree: 3,806
- Master's degree: 2,986
- Professional school degree: 679
- Doctorate degree: 378


Housing units in structures:
- One, detached: 9,370
- One, attached: 732
- Two: 13
- 3 or 4: 256
- 5 to 9: 127
- 10 to 19: 229
- 20 to 49: 87
- 50 or more: 284
- Mobile homes: 12
House/condo owner moved in on average 6 years ago
Renter moved in on average 0 years ago
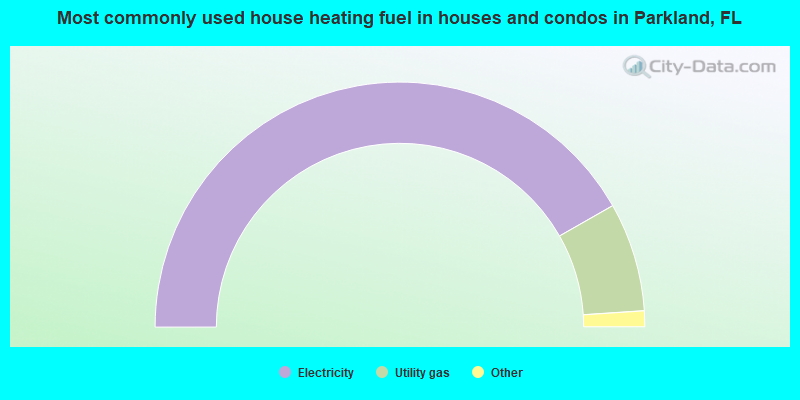
- 83.6%Electricity
- 14.4%Utility gas
- 1.8%No fuel used
- 0.3%Bottled, tank, or LP gas
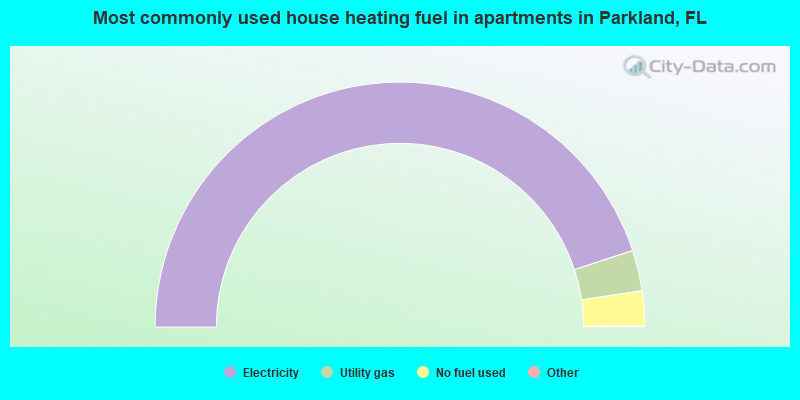
- 90.0%Electricity
- 5.4%Utility gas
- 4.6%No fuel used
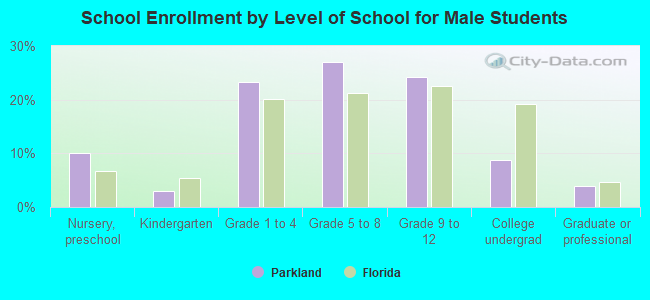
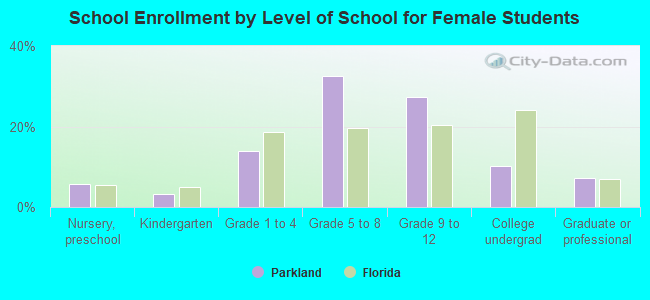
Private vs. public school enrollment:
| Here: | 19.6% |
| Florida: | 15.8% |
| Here: | 20.8% |
| Florida: | 12.9% |
| Here: | 9.8% |
| Florida: | 23.6% |