Parker, CO (Colorado) Houses and Residents
| Parker: | $637,689 |
| Colorado: | $531,100 |
Mean price in 2022:
Detached houses: $626,225
Here: $626,225 State: $676,667 Townhouses or other attached units: $658,482
Here: $658,482 State: $526,340 In 3-to-4-unit structures: $307,191
Here: $307,191 State: $385,502 In 5-or-more-unit structures: $264,335
Here: $264,335 State: $417,586
Total population: 49,857 (Urban population: 23,468, Rural population: 46 (all nonfarm))
Houses: 22,753 (21,829 occupied: 16,193 owner occupied, 5,723 renter occupied)
| % of renters here: | 26% |
| State: | 34% |
Housing density: 1,560 houses/condos per square mile
Median price asked for vacant for-sale houses and condos in 2022: $1,883,862.
Median contract rent in 2022: $1,829 (lower quartile is $1,531, upper quartile is over $2,000)
Median rent asked for vacant for-rent units in 2022: $1,662
Median gross rent in Parker, CO in 2022: $1,915
Housing units in Parker with a mortgage: 13,486 (1,457 second mortgage, 51 home equity loan, 1,247 both second mortgage and home equity loan)
Houses without a mortgage: 91
Median household income for houses/condos with a mortgage: $156,241
Median household income for apartments without a mortgage: $92,451
Median monthly housing costs: $2,144
Compare current foreclosures in Parker, CO:
| Photo | Address | Area | Beds / Baths | Price | Details |
|---|---|---|---|---|---|

|
#1
Hilltop Rd
Parker, CO 80134
|
2,285 sq. feet
|
2 baths 3 beds |
show details | |

|
#2
Belmont Way
Parker, CO 80134
|
2,484 sq. feet
|
2 baths 3 beds |
show details | |

|
#3
Longpark Dr
Parker, CO 80138
|
1,620 sq. feet
|
3 baths 3 beds |
show details | |

|
#4
Banyon Cir
Parker, CO 80134
|
- sq. feet
|
2 baths 4 beds |
show details | |

|
#5
Wheatgrass Cir
Parker, CO 80134
|
1,276 sq. feet
|
2 baths 3 beds |
show details | |

|
#6
Double Dutch Circle
Parker, CO 80134
|
2,855 sq. feet
|
3 baths 3 beds |
show details | |

|
#7
Horton Court
Parker, CO 80134
|
- sq. feet
|
2 baths 3 beds |
show details | |

|
#8
Bridle Path Ln
Parker, CO 80134
|
3,665 sq. feet
|
4 baths 5 beds |
show details | |

|
#9
Chelmsford Ter
Parker, CO 80134
|
3,220 sq. feet
|
3 baths 4 beds |
show details | |

|
#10
E River Chase Way
Parker, CO 80138
|
2,644 sq. feet
|
3 baths 4 beds |
show details |
| Photo | Address | Area | Beds / Baths | Price | Details |
|---|---|---|---|---|---|

|
#11
Longs Peak Ln
Parker, CO 80138
|
1,414 sq. feet
|
3 baths 3 beds |
show details | |

|
#12
Tallman Dr
Parker, CO 80138
|
3,044 sq. feet
|
3 baths 4 beds |
show details | |

|
#13
Ponderosa Ave
Parker, CO 80134
|
1,224 sq. feet
|
2 baths 3 beds |
show details | |

|
#14
Grays Peak Dr
Parker, CO 80138
|
2,252 sq. feet
|
3 baths 3 beds |
show details | |

|
#15
White Pine Ln
Parker, CO 80138
|
2,022 sq. feet
|
3 baths 3 beds |
show details | |

|
#16
Cloverleaf Cir
Parker, CO 80134
|
1,158 sq. feet
|
2 baths 3 beds |
show details | |

|
#17
Hedgeway Dr
Parker, CO 80134
|
2,409 sq. feet
|
3 baths 4 beds |
show details | |

|
#18
Mount Antero Way
Parker, CO 80138
|
2,252 sq. feet
|
3 baths 4 beds |
show details | |

|
#19
E Clear Creek Dr
Parker, CO 80134
|
3,302 sq. feet
|
3 baths 4 beds |
show details | |

|
#20
Latigo Ln
Parker, CO 80138
|
1,920 sq. feet
|
3 baths 3 beds |
show details |
| Photo | Address | Area | Beds / Baths | Price | Details |
|---|---|---|---|---|---|

|
#21
E Hollow Creek Dr
Parker, CO 80134
|
2,280 sq. feet
|
3 baths 3 beds |
show details | |

|
#22
E Summit Fox Ave
Parker, CO 80134
|
2,044 sq. feet
|
2 baths 3 beds |
show details | |

|
#23
Bluegrass Cir
Parker, CO 80134
|
1,307 sq. feet
|
3 baths 3 beds |
show details | |

|
#24
E Iron Ore Ave
Parker, CO 80134
|
4,106 sq. feet
|
3 baths 4 beds |
show details | |

|
#25
Quarry Hill Dr
Parker, CO 80134
|
2,060 sq. feet
|
3 baths 3 beds |
show details | |

|
#26
Meadow Bridge Way
Parker, CO 80134
|
2,188 sq. feet
|
3 baths 3 beds |
show details | |

|
#27
Summerset Ln
Parker, CO 80138
|
1,073 sq. feet
|
1 baths 2 beds |
show details | |

|
#28
Hot Springs Dr
Parker, CO 80138
|
968 sq. feet
|
1 baths 3 beds |
show details | |

|
#29
Ponderosa Ave
Parker, CO 80134
|
1,224 sq. feet
|
2 baths 3 beds |
show details | |

|
#30
E Black Horn Dr
Parker, CO 80134
|
2,925 sq. feet
|
3 baths 5 beds |
show details |
| Photo | Address | Area | Beds / Baths | Price | Details |
|---|---|---|---|---|---|

|
#31
Mount Elbert Pl
Parker, CO 80138
|
2,546 sq. feet
|
3 baths 3 beds |
show details | |

|
#32
Hadley St
Parker, CO 80134
|
3,539 sq. feet
|
3 baths 4 beds |
show details | |

|
#33
Day Star Dr
Parker, CO 80138
|
1,741 sq. feet
|
3 baths 3 beds |
show details | |

|
#34
Apache Plume Dr
Parker, CO 80134
|
1,490 sq. feet
|
2 baths 3 beds |
show details | |

|
#35
N Silo Rd
Parker, CO 80138
|
2,080 sq. feet
|
1 baths 1 beds |
show details | |

|
#36
Ironstone Way Apt 201
Parker, CO 80134
|
700 sq. feet
|
1 baths 1 beds |
show details | |

|
#37
E River Chase Way
Parker, CO 80138
|
2,420 sq. feet
|
3 baths 5 beds |
show details | |

|
#38
Golden Eye Dr
Parker, CO 80134
|
2,013 sq. feet
|
3 baths 3 beds |
show details | |

|
#39
County Road 9
Parker, CO 80138
|
2,980 sq. feet
|
3 baths 2 beds |
show details | |

|
#40
Creekview Dr
Parker, CO 80134
|
2,774 sq. feet
|
3 baths 3 beds |
show details |
| Photo | Address | Area | Beds / Baths | Price | Details |
|---|---|---|---|---|---|

|
#41
S Robinson Ranch Dr
Parker, CO 80134
|
6,372 sq. feet
|
4 baths 4 beds |
show details | |

|
#42
Brownstone Dr
Parker, CO 80138
|
1,917 sq. feet
|
2 baths 3 beds |
show details | |

|
#43
Greenstone Cir
Parker, CO 80134
|
2,094 sq. feet
|
3 baths 4 beds |
show details | |

|
#44
Pearl Cir Unit 104
Parker, CO 80134
|
1,215 sq. feet
|
3 baths 2 beds |
show details | |

|
#45
S Beaver Creek Way
Parker, CO 80134
|
1,789 sq. feet
|
3 baths 3 beds |
show details | |

|
#46
Cornerstone Ln
Parker, CO 80134
|
2,590 sq. feet
|
3 baths 3 beds |
show details | |

|
#47
Golden Eye Dr
Parker, CO 80134
|
1,845 sq. feet
|
3 baths 3 beds |
show details | |

|
#48
Omaha Ave
Parker, CO 80138
|
2,068 sq. feet
|
3 baths 4 beds |
show details | |

|
#49
S Moose Creek Pl
Parker, CO 80134
|
1,403 sq. feet
|
3 baths 3 beds |
show details | |

|
Check over 1 million property listings on Foreclosure.com!
|
browse all offers | |||

Latest news about housing in Parker, CO collected exclusively by city-data.com from local newspapers, TV, and radio stations

 | Pet Friendly Parker Apartments (2 replies) |
| Real Estate Market Parker (56 replies) |
| Parker (2 replies) |
| Buy house in Parker, CO (8 replies) |
| New Apartment Developments in Colorado Springs (44 replies) |
| Need a clubhouse to rent for a party (4 replies) |

Median year apartment built: 2006
Household type by relationship:
Households: 61,306- Male householders: 11,250 (1,700 living alone), Female householders: 10,299 (2,267 living alone)
13,607 spouses (13,499 opposite-sex spouses), 1,343 unmarried partners, (1,313 opposite-sex unmarried partners), 20,746 children (19,597 natural, 409 adopted, 740 stepchildren), 607 grandchildren, 577 brothers or sisters, 1,077 parents, 0 foster children, 668 other relatives, 1,015 non-relatives
- In group quarters: 113
Size of family households: 6,432 2-persons, 3,855 3-persons, 3,425 4-persons, 2,020 5-persons, 366 6-persons, 396 7-or-more-persons.
Size of nonfamily households: 4,095 1-person, 1,239 2-persons, 30 3-persons, 27 4-persons.
12,757 married couples with children.
1,935 single-parent households (825 men, 1,110 women).
88.8% of residents of Parker speak English at home.
4.6% of residents speak Spanish at home (74% speak English very well, 14% speak English well, 3% speak English not well, 9% don't speak English at all).
3.7% of residents speak other Indo-European language at home (77% speak English very well, 20% speak English well, 2% speak English not well, 1% don't speak English at all).
2.2% of residents speak Asian or Pacific Island language at home (60% speak English very well, 25% speak English well, 9% speak English not well, 6% don't speak English at all).
0.4% of residents speak other language at home (83% speak English very well, 9% speak English well, 8% speak English not well).
Foreign born population: 5,241 (8.5%)
(58.5% of them are naturalized citizens)
| Here: | 7.8 |
| State: | 6.8 |
| Here: | 4.1 |
| State: | 4.0 |

- Bedrooms in owner-occupied houses and condos in Parker, Colorado
- 17no bedroom
- 1281 bedroom
- 1,4772 bedrooms
- 5,5123 bedrooms
- 5,5164 bedrooms
- 3,5445+ bedrooms

- Bedrooms in renter-occupied apartments in Parker, Colorado
- 363no bedroom
- 1,9441 bedroom
- 1,9102 bedrooms
- 1,0793 bedrooms
- 2794 bedrooms
- 1495+ bedrooms

- Cars and other vehicles available in Parker in owner-occupied houses/condos
- 100no vehicle
- 2,7941 vehicle
- 8,4142 vehicles
- 3,4963 vehicles
- 9944 vehicles
- 3965+ vehicles

- Cars and other vehicles available in Parker in renter-occupied apartments
- 261no vehicle
- 2,1561 vehicle
- 2,7362 vehicles
- 3083 vehicles
- 1904 vehicles
- 725+ vehicles

- Rooms in owner-occupied houses in Parker, Colorado
- 171 room
- 02 rooms
- 3333 rooms
- 9484 rooms
- 1,2655 rooms
- 2,4686 rooms
- 2,4597 rooms
- 2,3618 rooms
- 6,3429+ rooms

- Rooms in renter-occupied apartments in Parker, Colorado
- 3631 room
- 6322 rooms
- 1,3383 rooms
- 1,2984 rooms
- 7975 rooms
- 6346 rooms
- 1547 rooms
- 2548 rooms
- 2549+ rooms


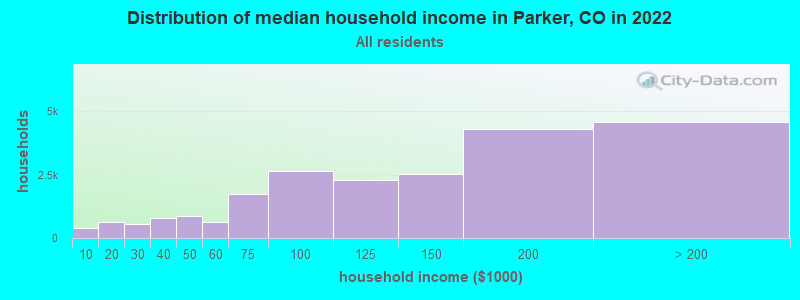
Parker, CO household income distribution

- 379Less than $10,000
- 616$10,000 to $19,999
- 572$20,000 to $29,999
- 772$30,000 to $39,999
- 866$40,000 to $49,999
- 630$50,000 to $59,999
- 1,721$60,000 to $74,999
- 2,660$75,000 to $99,999
- 2,276$100,000 to $124,999
- 2,513$125,000 to $149,999
- 4,321$150,000 to $199,999
- 4,579$200,000 or more
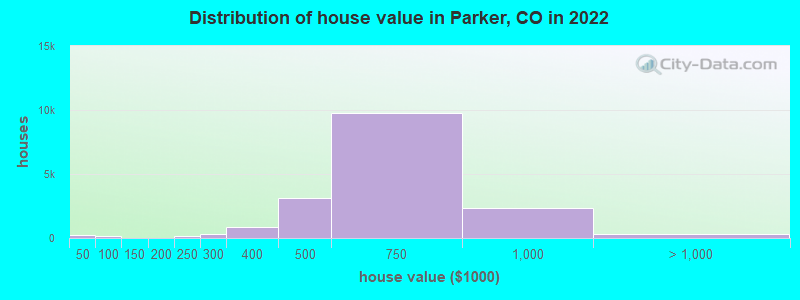
Home value of owner - occupied houses in 2022 in Parker, CO
-
- 173Less than $10,000
- 12$10,000 to $14,999
- 44$40,000 to $49,999
- 52$50,000 to $59,999
- 13$60,000 to $69,999
- 60$80,000 to $89,999
- 4$90,000 to $99,999
- 6$125,000 to $149,999
- 128$200,000 to $249,999
- 294$250,000 to $299,999
- 877$300,000 to $399,999
- 3,095$400,000 to $499,999
- 9,800$500,000 to $749,999
- 2,336$750,000 to $999,999
- 231$1,000,000 to $1,499,999
- 16$1,500,000 to $1,999,999
- 68$2,000,000 or more
Rent paid by renters in 2022 in Parker, CO
-
- 36$650 to $699
- 9$700 to $749
- 43$900 to $999
- 348$1,000 to $1,249
- 789$1,250 to $1,499
- 2,617$1,500 to $1,999
- 1,160$2,000 to $2,499
- 516$2,500 to $2,999
- 132$3,000 to $3,499
- 141$3,500 or more
- 87No cash rent


Percentage of workers working in this county: 66.0%
Number of people working at home: 9,762 (28.2% of all workers)
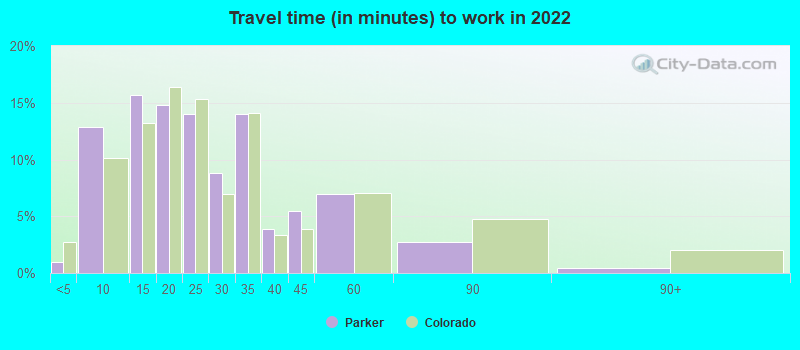
Travel time to work (commute)
- Less than 5 minutes: 219
- 5 to 9 minutes: 2,796
- 10 to 14 minutes: 3,944
- 15 to 19 minutes: 2,488
- 20 to 24 minutes: 3,976
- 25 to 29 minutes: 2,013
- 30 to 34 minutes: 3,222
- 35 to 39 minutes: 1,237
- 40 to 44 minutes: 1,472
- 45 to 59 minutes: 2,146
- 60 to 89 minutes: 1,094
- 90 or more minutes: 291
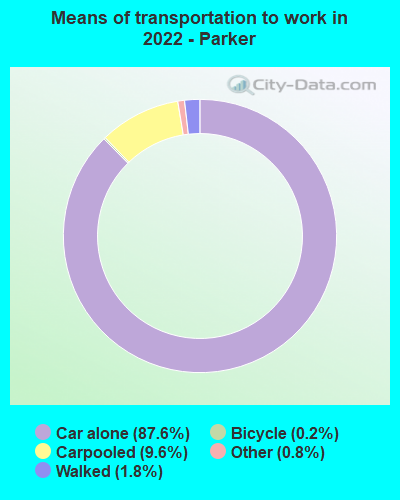
Means of transportation to work:
- Drove a car alone: 20,917 (60.2%)
- Carpooled: 2,616 (7.5%)
- Bus: 7 (0.0%)
- Taxi: 179 (0.5%)
- Bicycle: 62 (0.2%)
- Walked: 406 (1.2%)
- Worked at home: 9,762 (28.1%)

- Unemployment by race in 2022
- Unemployment rate for White non-Hispanic residents
- 1.6%Males
- 3.6%Females
- Unemployment rate for Asian residents
- 9.9%Females
- Unemployment rate for other race residents
- 7.1%Males
- Unemployment rate for two or more race residents
- 2.8%Males
- 1.3%Females
- Unemployment rate for Hispanic or Latino residents
- 6.9%Males
- 1.8%Females

- Year of entry for the foreign-born population in Parker, Colorado
- 2,0132010 or later
- 1,0452000 to 2009
- 8371990 to 1999
- 1461980 to 1989
- 941970 to 1979
- 144Before 1970
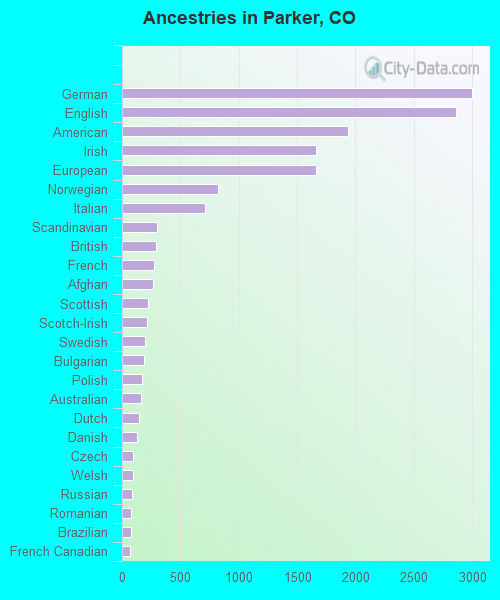
First ancestries reported:
- German: 2,994 (12.5%)
- English: 2,862 (11.9%)
- American: 1,936 (8.1%)
- Irish: 1,666 (6.9%)
- European: 1,660 (6.9%)
- Norwegian: 822 (3.4%)
- Italian: 707 (2.9%)
- Scandinavian: 297 (1.2%)
- British: 289 (1.2%)
- French: 276 (1.1%)
- Afghan: 268 (1.1%)
- Scottish: 226 (0.9%)
- Scotch-Irish: 216 (0.9%)
- Swedish: 198 (0.8%)
- Bulgarian: 190 (0.8%)
- Polish: 168 (0.7%)
- Australian: 162 (0.7%)
- Dutch: 147 (0.6%)
- Danish: 130 (0.5%)
- Czech: 97 (0.4%)
- Welsh: 97 (0.4%)
- Russian: 83 (0.3%)
- Romanian: 79 (0.3%)
- Brazilian: 79 (0.3%)
- French Canadian: 70 (0.3%)
- Palestinian: 60 (0.2%)
- Slavic: 60 (0.2%)
- Northern European: 53 (0.2%)
- Iranian: 51 (0.2%)
- Greek: 51 (0.2%)
- Ukrainian: 51 (0.2%)
- African: 45 (0.2%)
- Moroccan: 34 (0.1%)
- Canadian: 32 (0.1%)
- Jamaican: 31 (0.1%)
- Austrian: 22 (0.09%)
- Eastern European: 22 (0.09%)
- Czechoslovakian: 22 (0.09%)
- Hungarian: 20 (0.08%)
- Portuguese: 18 (0.07%)
- Armenian: 18 (0.07%)
- Lebanese: 17 (0.07%)
- Cajun: 14 (0.06%)
- Slovene: 14 (0.06%)
- Swiss: 14 (0.06%)
- South African: 13 (0.05%)
- Croatian: 12 (0.05%)
- Turkish: 12 (0.05%)
- Icelander: 10 (0.04%)
- Finnish: 10 (0.04%)
- Lithuanian: 8 (0.03%)
- Luxembourger: 8 (0.03%)
- Israeli: 8 (0.03%)
Most common places of birth for foreign-born residents (%):
| Parker: | 19.9% (968) |
| Colorado: | 4.0% (21,689) |
| Parker: | 11.0% (534) |
| Colorado: | 38.3% (209,491) |
| Parker: | 8.0% (387) |
| Colorado: | 2.7% (15,026) |
| Parker: | 5.7% (275) |
| Colorado: | 2.9% (15,981) |
| Parker: | 5.2% (255) |
| Colorado: | 0.3% (1,730) |
| Parker: | 4.9% (239) |
| Colorado: | 3.3% (17,998) |
| Parker: | 4.7% (230) |
| Colorado: | 0.6% (3,144) |
| Parker: | 4.1% (197) |
| Colorado: | 1.0% (5,365) |
| Parker: | 2.9% (143) |
| Colorado: | 1.0% (5,214) |
| Parker: | 2.9% (139) |
| Colorado: | 0.1% (613) |
| Parker: | 2.5% (120) |
| Colorado: | 0.8% (4,267) |
| Parker: | 2.4% (116) |
| Colorado: | 2.5% (13,706) |
| Parker: | 2.1% (103) |
| Colorado: | 2.3% (12,342) |
| Parker: | 2.0% (95) |
| Colorado: | 0.4% (2,063) |
| Parker: | 1.9% (90) |
| Colorado: | 0.3% (1,441) |
| Parker: | 1.5% (73) |
| Colorado: | 1.4% (7,898) |
Place of birth for U.S.-born residents:
- This state: 25,799
- Other state: 29,589
- Northeast: 3,312
- Midwest: 9,562
- South: 6,761
- West: 9,921
83.2% of Parker residents lived in the same house 1 years ago.
Out of people who lived in different houses, 28.8% lived in this county.
Out of people who lived in different counties, 61.7% lived in Colorado.
| Parker: | 83.2% |
| State average: | 83.6% |
Education attainment for males 25 years and older:
- No schooling: 112
- Nursery to 4th grade: 16
- 5th and 6th grade: 153
- 7th and 8th grade: 60
- 9th grade: 31
- 10th grade: 0
- 11th grade: 41
- 12th grade, no diploma: 115
- High school graduate (or equivalency): 2,318
- Less than 1 year of college: 1,123
- Some college more than 1 year, no degree: 2,853
- Associate degree: 1,701
- Bachelor's degree: 7,347
- Master's degree: 3,168
- Professional school degree: 424
- Doctorate degree: 208

Education attainment for females 25 years and older:
- No schooling: 159
- Nursery to 4th grade: 32
- 5th and 6th grade: 57
- 7th and 8th grade: 0
- 9th grade: 54
- 10th grade: 73
- 11th grade: 31
- 12th grade, no diploma: 185
- High school graduate (or equivalency): 2,953
- Less than 1 year of college: 747
- Some college more than 1 year, no degree: 2,516
- Associate degree: 2,218
- Bachelor's degree: 7,231
- Master's degree: 3,029
- Professional school degree: 403
- Doctorate degree: 246


Housing units in structures:
- One, detached: 15,886
- One, attached: 1,129
- Two: 71
- 3 or 4: 224
- 5 to 9: 802
- 10 to 19: 2,320
- 20 to 49: 1,559
- 50 or more: 743
- Mobile homes: 14
Housing units lacking complete kitchen facilities in 2022: 0.2%
House/condo owner moved in on average 7 years ago
Renter moved in on average 2 years ago

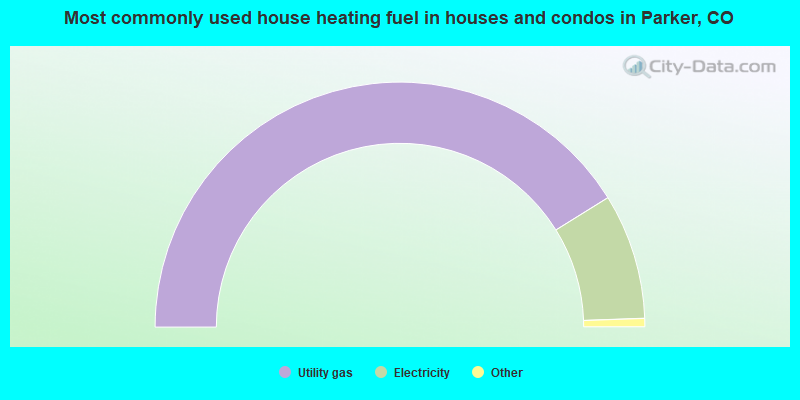
- 82.3%Utility gas
- 16.6%Electricity
- 0.7%Bottled, tank, or LP gas
- 0.1%Other fuel
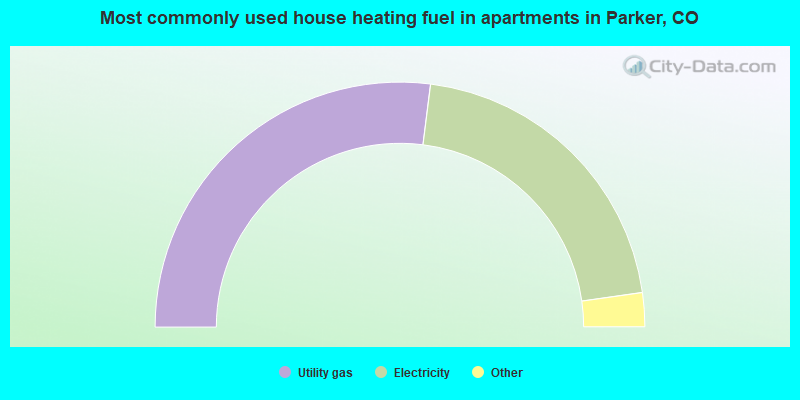
- 54.0%Utility gas
- 41.5%Electricity
- 3.2%Bottled, tank, or LP gas
- 1.1%Wood
- 0.3%No fuel used
Private vs. public school enrollment:
| Here: | 8.7% |
| Colorado: | 11.4% |
| Here: | 13.1% |
| Colorado: | 8.5% |
| Here: | 9.8% |
| Colorado: | 14.0% |


