Palmetto, FL (Florida) Houses and Residents
| Palmetto: | $270,097 |
| Florida: | $354,100 |
Mean price in 2022:
Detached houses: $334,670
Here: $334,670 State: $500,941 Townhouses or other attached units: $317,179
Here: $317,179 State: $370,869 In 3-to-4-unit structures: $419,183
Here: $419,183 State: $309,944 In 5-or-more-unit structures: $382,945
Here: $382,945 State: $447,145 Mobile homes: $71,429
Here: $71,429 State: $113,202 Occupied boats, RVs, vans, etc.: $34,167
Here: $34,167 State: $73,933
Total population: 13,082 (Urban population: 12,334, Rural population: 0)
Houses: 7,313 (5,249 occupied: 3,502 owner occupied, 1,918 renter occupied)
| % of renters here: | 35% |
| State: | 33% |
Housing density: 1,695 houses/condos per square mile
Median price asked for vacant for-sale houses and condos in 2022: $1,298,563.
Median contract rent in 2022: $1,149 (lower quartile is $714, upper quartile is $1,534)
Median rent asked for vacant for-rent units in 2022: $1,143
Median gross rent in Palmetto, FL in 2022: $1,305
Housing units in Palmetto with a mortgage: 1,209 (84 second mortgage, 0 home equity loan, 65 both second mortgage and home equity loan)
Houses without a mortgage: 86
Median household income for houses/condos with a mortgage: $91,068
Median household income for apartments without a mortgage: $58,507
Median monthly housing costs: $1,077
Compare current foreclosures in Palmetto, FL:
| Photo | Address | Area | Beds / Baths | Price | Details |
|---|---|---|---|---|---|

|
#1
Lindever Ln
Palmetto, FL 34221
|
- sq. feet
|
2 baths 4 beds |
show details | |

|
#2
33rd Dr E
Palmetto, FL 34221
|
1,502 sq. feet
|
2 baths 3 beds |
show details | |

|
#3
Willow Hammock Dr
Palmetto, FL 34221
|
1,788 sq. feet
|
2 baths 4 beds |
show details | |

|
#4
Dr Martin Luther King Jr Pl
Palmetto, FL 34221
|
1,176 sq. feet
|
2 baths 3 beds |
show details | |

|
#5
Willow Hammock Dr
Palmetto, FL 34221
|
2,252 sq. feet
|
3 baths 4 beds |
show details | |

|
#6
Willow Hammock Dr
Palmetto, FL 34221
|
2,252 sq. feet
|
3 baths 4 beds |
show details | |

|
#7
Mossy Limb Ct
Palmetto, FL 34221
|
2,068 sq. feet
|
2 baths 4 beds |
show details | |

|
#8
Willow Hammock Dr
Palmetto, FL 34221
|
2,252 sq. feet
|
3 baths 4 beds |
show details | |

|
#9
Park Willow Ave
Palmetto, FL 34221
|
2,616 sq. feet
|
3 baths 5 beds |
show details | |

|
#10
28th Ave E
Palmetto, FL 34221
|
1,175 sq. feet
|
3 baths 3 beds |
show details |
| Photo | Address | Area | Beds / Baths | Price | Details |
|---|---|---|---|---|---|

|
#11
28th Street Ct E
Palmetto, FL 34221
|
2,432 sq. feet
|
2 baths 4 beds |
show details | |

|
#12
Willow Branch Pl
Palmetto, FL 34221
|
1,651 sq. feet
|
2 baths 3 beds |
show details | |

|
#13
21st Ave W
Palmetto, FL 34221
|
1,792 sq. feet
|
2 baths 3 beds |
show details | |

|
#14
63rd St E
Palmetto, FL 34221
|
1,767 sq. feet
|
2 baths 3 beds |
show details | |

|
#15
50th Ave E
Palmetto, FL 34221
|
1,478 sq. feet
|
2 baths 4 beds |
show details | |

|
#16
Bungalow Grove Ct
Palmetto, FL 34221
|
2,024 sq. feet
|
3 baths 3 beds |
show details | |

|
#17
46th St W
Palmetto, FL 34221
|
1,302 sq. feet
|
2 baths 3 beds |
show details | |

|
#18
20th Ave W
Palmetto, FL 34221
|
1,346 sq. feet
|
1 baths 3 beds |
show details | |

|
#19
87th Ln E
Palmetto, FL 34221
|
1,576 sq. feet
|
2 baths 3 beds |
show details | |

|
#20
45th St E
Palmetto, FL 34221
|
1,208 sq. feet
|
2 baths 3 beds |
show details |
| Photo | Address | Area | Beds / Baths | Price | Details |
|---|---|---|---|---|---|

|
#21
Old Turner Ln
Palmetto, FL 34221
|
2,252 sq. feet
|
3 baths 4 beds |
show details | |

|
#22
48th St E
Palmetto, FL 34221
|
1,421 sq. feet
|
2 baths 3 beds |
show details | |

|
#23
69th Ave E
Palmetto, FL 34221
|
1,517 sq. feet
|
2 baths 3 beds |
show details | |

|
#24
31st St E
Palmetto, FL 34221
|
1,680 sq. feet
|
2 baths 3 beds |
show details | |

|
#25
50th Street Cir E
Palmetto, FL 34221
|
2,420 sq. feet
|
3 baths 3 beds |
show details | |

|
#26
25th Ave W
Palmetto, FL 34221
|
1,740 sq. feet
|
2 baths 3 beds |
show details | |

|
#27
Macfarlane Pl
Palmetto, FL 34221
|
3,448 sq. feet
|
4 baths 4 beds |
show details | |

|
#28
24th Ave E
Palmetto, FL 34221
|
2,784 sq. feet
|
3 baths 4 beds |
show details | |

|
#29
47th St W
Palmetto, FL 34221
|
1,680 sq. feet
|
2 baths 3 beds |
show details | |

|
#30
76th St E
Palmetto, FL 34221
|
2,644 sq. feet
|
3 baths 4 beds |
show details |
| Photo | Address | Area | Beds / Baths | Price | Details |
|---|---|---|---|---|---|

|
#31
16th St W
Palmetto, FL 34221
|
1,815 sq. feet
|
2 baths 3 beds |
show details | |

|
#32
13th Ave E
Palmetto, FL 34221
|
1,868 sq. feet
|
2 baths 4 beds |
show details | |

|
#33
73rd Ave E
Palmetto, FL 34221
|
1,825 sq. feet
|
2 baths 4 beds |
show details | |

|
#34
48th St E
Palmetto, FL 34221
|
1,914 sq. feet
|
2 baths 3 beds |
show details | |

|
#35
10th Ave E
Palmetto, FL 34221
|
1,640 sq. feet
|
2 baths 3 beds |
show details | |

|
#36
3rd Ave W
Palmetto, FL 34221
|
1,134 sq. feet
|
2 baths 3 beds |
show details | |

|
#37
10th Ave E
Palmetto, FL 34221
|
2,140 sq. feet
|
3 baths 3 beds |
show details | |

|
#38
Lakehurst Ct
Palmetto, FL 34221
|
1,713 sq. feet
|
2 baths 3 beds |
show details | |

|
#39
28th Avenue Dr E
Palmetto, FL 34221
|
1,350 sq. feet
|
2 baths 2 beds |
show details | |

|
#40
3rd Ave W
Palmetto, FL 34221
|
962 sq. feet
|
1 baths 3 beds |
show details |
| Photo | Address | Area | Beds / Baths | Price | Details |
|---|---|---|---|---|---|

|
#41
35th Avenue Dr W
Palmetto, FL 34221
|
2,024 sq. feet
|
3 baths 4 beds |
show details | |

|
#42
9th St W
Palmetto, FL 34221
|
782 sq. feet
|
1 baths 2 beds |
show details | |

|
#43
28th Ave E
Palmetto, FL 34221
|
1,175 sq. feet
|
2 baths 3 beds |
show details | |

|
#44
10th St W
Palmetto, FL 34221
|
1,152 sq. feet
|
2 baths 3 beds |
show details | |

|
#45
17th St W
Palmetto, FL 34221
|
4,272 sq. feet
|
3 baths 5 beds |
show details | |

|
#46
18th St E
Palmetto, FL 34221
|
951 sq. feet
|
1 baths 3 beds |
show details | |

|
#47
70th St E
Palmetto, FL 34221
|
2,987 sq. feet
|
2 baths 3 beds |
show details | |

|
#48
22nd Ave W
Palmetto, FL 34221
|
1,832 sq. feet
|
2 baths 3 beds |
show details | |

|
#49
70th Gln E
Palmetto, FL 34221
|
1,686 sq. feet
|
2 baths 3 beds |
show details | |

|
Check over 1 million property listings on Foreclosure.com!
|
browse all offers | |||

Latest news about housing in Palmetto, FL collected exclusively by city-data.com from local newspapers, TV, and radio stations


Median year apartment built: 1983
Household type by relationship:
Households: 14,178- Male householders: 2,423 (493 living alone), Female householders: 2,827 (892 living alone)
2,555 spouses (2,516 opposite-sex spouses), 508 unmarried partners, (503 opposite-sex unmarried partners), 3,776 children (3,503 natural, 73 adopted, 200 stepchildren), 628 grandchildren, 268 brothers or sisters, 317 parents, 0 foster children, 257 other relatives, 382 non-relatives
- In group quarters: 233
Size of family households: 2,220 2-persons, 633 3-persons, 444 4-persons, 97 5-persons, 116 6-persons, 179 7-or-more-persons.
Size of nonfamily households: 1,324 1-person, 400 2-persons, 17 3-persons.
1,155 married couples with children.
712 single-parent households (230 men, 482 women).
82.8% of residents of Palmetto speak English at home.
12.8% of residents speak Spanish at home (61% speak English very well, 9% speak English well, 23% speak English not well, 7% don't speak English at all).
2.4% of residents speak other Indo-European language at home (60% speak English very well, 24% speak English well, 17% speak English not well).
1.5% of residents speak Asian or Pacific Island language at home (41% speak English very well, 41% speak English not well, 17% don't speak English at all).
0.1% of residents speak other language at home (100% speak English very well).
Foreign born population: 1,657 (11.7%)
(32.7% of them are naturalized citizens)
| Here: | 5.2 |
| State: | 5.9 |
| Here: | 4.3 |
| State: | 4.2 |

- Bedrooms in owner-occupied houses and condos in Palmetto, Florida
- 21no bedroom
- 4051 bedroom
- 1,2682 bedrooms
- 1,2323 bedrooms
- 4954 bedrooms
- 815+ bedrooms

- Bedrooms in renter-occupied apartments in Palmetto, Florida
- 45no bedroom
- 2781 bedroom
- 1,1782 bedrooms
- 2693 bedrooms
- 714 bedrooms
- 785+ bedrooms

- Cars and other vehicles available in Palmetto in owner-occupied houses/condos
- 171no vehicle
- 1,3121 vehicle
- 1,3542 vehicles
- 4123 vehicles
- 1384 vehicles
- 1165+ vehicles

- Cars and other vehicles available in Palmetto in renter-occupied apartments
- 214no vehicle
- 9811 vehicle
- 6402 vehicles
- 593 vehicles
- 244 vehicles
- 05+ vehicles

- Rooms in owner-occupied houses in Palmetto, Florida
- 211 room
- 752 rooms
- 4423 rooms
- 5884 rooms
- 8515 rooms
- 5646 rooms
- 3547 rooms
- 2388 rooms
- 3699+ rooms

- Rooms in renter-occupied apartments in Palmetto, Florida
- 451 room
- 852 rooms
- 3603 rooms
- 6084 rooms
- 4885 rooms
- 1016 rooms
- 847 rooms
- 1088 rooms
- 399+ rooms


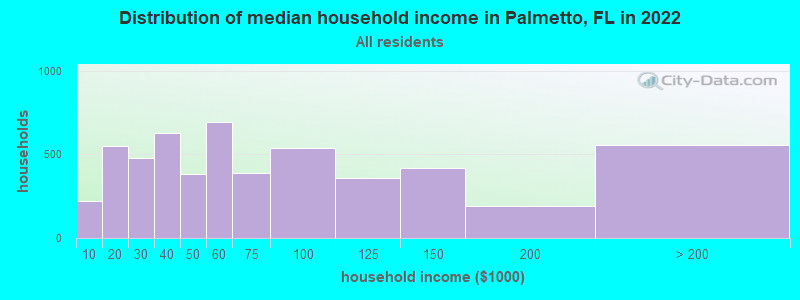
Palmetto, FL household income distribution

- 220Less than $10,000
- 550$10,000 to $19,999
- 476$20,000 to $29,999
- 626$30,000 to $39,999
- 384$40,000 to $49,999
- 694$50,000 to $59,999
- 391$60,000 to $74,999
- 541$75,000 to $99,999
- 356$100,000 to $124,999
- 416$125,000 to $149,999
- 192$150,000 to $199,999
- 556$200,000 or more
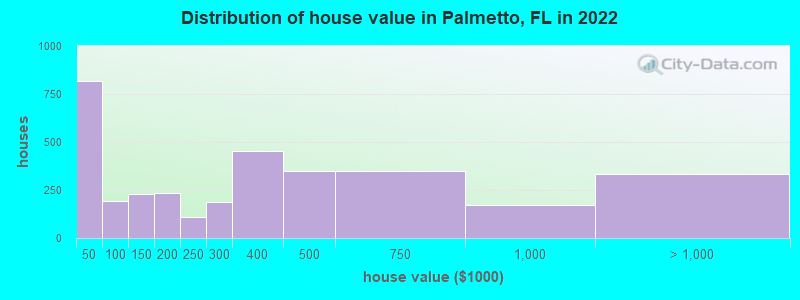
Home value of owner - occupied houses in 2022 in Palmetto, FL
-
- 125Less than $10,000
- 62$10,000 to $14,999
- 191$15,000 to $19,999
- 50$20,000 to $24,999
- 73$25,000 to $29,999
- 239$30,000 to $34,999
- 8$35,000 to $39,999
- 65$40,000 to $49,999
- 53$50,000 to $59,999
- 10$60,000 to $69,999
- 35$70,000 to $79,999
- 7$80,000 to $89,999
- 18$90,000 to $99,999
- 107$100,000 to $124,999
- 120$125,000 to $149,999
- 120$150,000 to $174,999
- 115$175,000 to $199,999
- 108$200,000 to $249,999
- 185$250,000 to $299,999
- 454$300,000 to $399,999
- 351$400,000 to $499,999
- 346$500,000 to $749,999
- 173$750,000 to $999,999
- 192$1,000,000 to $1,499,999
- 114$1,500,000 to $1,999,999
- 28$2,000,000 or more
Rent paid by renters in 2022 in Palmetto, FL
-
- 60Less than $100
- 57$100 to $149
- 41$200 to $249
- 29$250 to $299
- 52$300 to $349
- 12$450 to $499
- 88$500 to $549
- 29$550 to $599
- 61$600 to $649
- 48$650 to $699
- 60$700 to $749
- 53$750 to $799
- 43$800 to $899
- 89$900 to $999
- 431$1,000 to $1,249
- 246$1,250 to $1,499
- 247$1,500 to $1,999
- 144$2,000 to $2,499
- 47$2,500 to $2,999
- 20$3,500 or more
- 65No cash rent


Percentage of workers working in this county: 80.2%
Number of people working at home: 946 (15.9% of all workers)
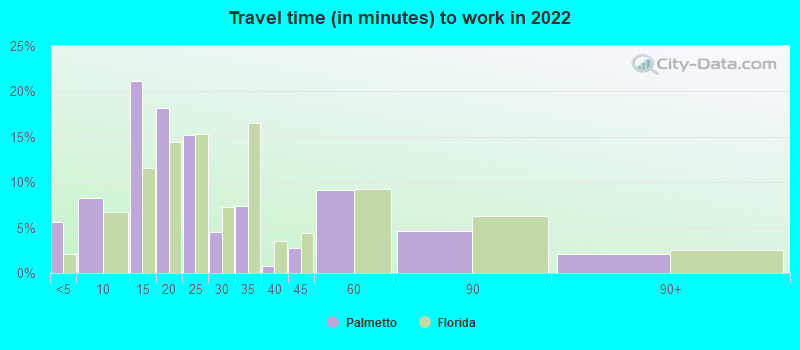
Travel time to work (commute)
- Less than 5 minutes: 221
- 5 to 9 minutes: 451
- 10 to 14 minutes: 769
- 15 to 19 minutes: 509
- 20 to 24 minutes: 928
- 25 to 29 minutes: 133
- 30 to 34 minutes: 670
- 35 to 39 minutes: 220
- 40 to 44 minutes: 304
- 45 to 59 minutes: 456
- 60 to 89 minutes: 294
- 90 or more minutes: 25
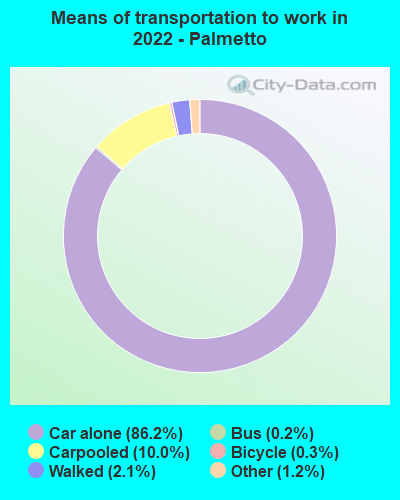
Means of transportation to work:
- Drove a car alone: 5,077 (73.9%)
- Carpooled: 475 (6.9%)
- Bus: 11 (0.2%)
- Taxi: 79 (1.2%)
- Bicycle: 25 (0.4%)
- Walked: 171 (2.5%)
- Worked at home: 946 (13.8%)

- Unemployment by race in 2022
- Unemployment rate for White non-Hispanic residents
- 4.4%Males
- 2.2%Females
- Unemployment rate for Black residents
- 14.5%Females
- Unemployment rate for two or more race residents
- 5.2%Males
- Unemployment rate for Hispanic or Latino residents
- 5.1%Males
- 6.2%Females

- Year of entry for the foreign-born population in Palmetto, Florida
- 4492010 or later
- 3912000 to 2009
- 3791990 to 1999
- 5541980 to 1989
- 1041970 to 1979
- 156Before 1970
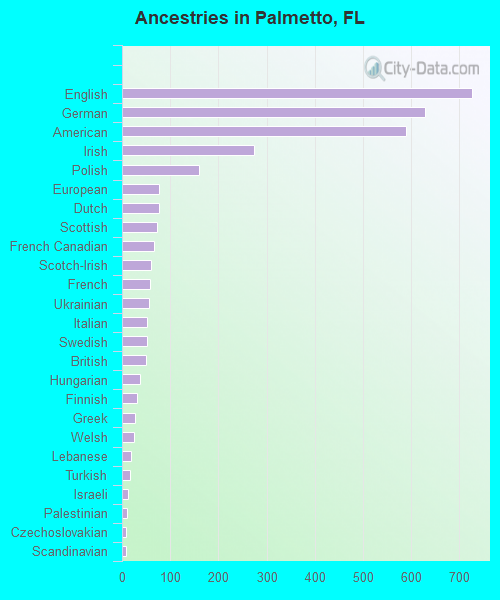
First ancestries reported:
- English: 725 (11.1%)
- German: 628 (9.6%)
- American: 589 (9.0%)
- Irish: 273 (4.2%)
- Polish: 159 (2.4%)
- European: 77 (1.2%)
- Dutch: 76 (1.2%)
- Scottish: 72 (1.1%)
- French Canadian: 66 (1.0%)
- Scotch-Irish: 61 (0.9%)
- French: 59 (0.9%)
- Ukrainian: 55 (0.8%)
- Italian: 51 (0.8%)
- Swedish: 51 (0.8%)
- British: 49 (0.7%)
- Hungarian: 37 (0.6%)
- Finnish: 32 (0.5%)
- Greek: 28 (0.4%)
- Welsh: 25 (0.4%)
- Lebanese: 18 (0.3%)
- Turkish: 17 (0.3%)
- Israeli: 13 (0.2%)
- Palestinian: 10 (0.2%)
- Czechoslovakian: 9 (0.1%)
- Scandinavian: 9 (0.1%)
- Slavic: 7 (0.1%)
- Belgian: 6 (0.09%)
- Russian: 6 (0.09%)
Most common places of birth for foreign-born residents (%):
| Palmetto: | 55.0% (918) |
| Florida: | 5.6% (257,152) |
| Palmetto: | 9.9% (165) |
| Florida: | 1.3% (60,604) |
| Palmetto: | 5.7% (95) |
| Florida: | 6.5% (298,669) |
| Palmetto: | 5.0% (83) |
| Florida: | 2.4% (109,132) |
| Palmetto: | 4.3% (72) |
| Florida: | 22.0% (1,006,576) |
| Palmetto: | 4.0% (67) |
| Florida: | 0.2% (11,243) |
| Palmetto: | 2.2% (37) |
| Florida: | 1.2% (54,272) |
| Palmetto: | 2.1% (35) |
| Florida: | 0.5% (21,886) |
Place of birth for U.S.-born residents:
- This state: 5,829
- Other state: 6,294
- Northeast: 1,894
- Midwest: 2,741
- South: 1,150
- West: 527
82.2% of Palmetto residents lived in the same house 1 years ago.
Out of people who lived in different houses, 21.0% lived in this county.
Out of people who lived in different counties, 56.4% lived in Florida.
| Palmetto: | 82.2% |
| State average: | 86.3% |
Education attainment for males 25 years and older:
- No schooling: 37
- Nursery to 4th grade: 126
- 5th and 6th grade: 28
- 7th and 8th grade: 0
- 9th grade: 32
- 10th grade: 125
- 11th grade: 52
- 12th grade, no diploma: 265
- High school graduate (or equivalency): 1,589
- Less than 1 year of college: 468
- Some college more than 1 year, no degree: 391
- Associate degree: 227
- Bachelor's degree: 1,074
- Master's degree: 223
- Professional school degree: 242
- Doctorate degree: 41

Education attainment for females 25 years and older:
- No schooling: 39
- Nursery to 4th grade: 78
- 5th and 6th grade: 207
- 7th and 8th grade: 44
- 9th grade: 95
- 10th grade: 35
- 11th grade: 46
- 12th grade, no diploma: 39
- High school graduate (or equivalency): 1,596
- Less than 1 year of college: 311
- Some college more than 1 year, no degree: 843
- Associate degree: 629
- Bachelor's degree: 1,100
- Master's degree: 367
- Professional school degree: 47
- Doctorate degree: 88


Housing units in structures:
- One, detached: 2,401
- One, attached: 474
- Two: 278
- 3 or 4: 121
- 5 to 9: 52
- 10 to 19: 348
- 20 to 49: 655
- 50 or more: 845
- Mobile homes: 2,108
- Boats, RVs, vans, etc.: 26
Median worth of mobile homes: $38,736
Housing units lacking complete kitchen facilities in 2022: 0.7%
House/condo owner moved in on average 7 years ago
Renter moved in on average 5 years ago

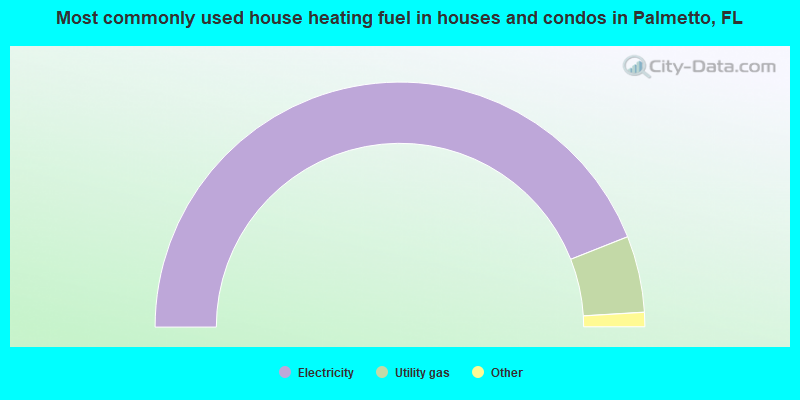
- 88.0%Electricity
- 10.1%Utility gas
- 1.1%No fuel used
- 0.5%Bottled, tank, or LP gas
- 0.2%Solar energy
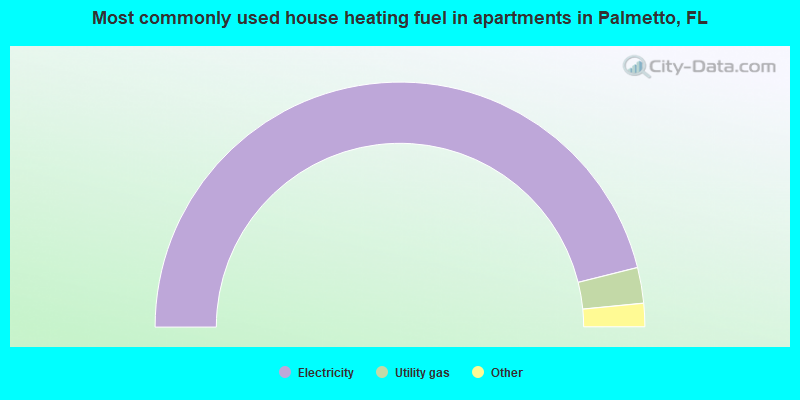
- 92.3%Electricity
- 4.7%Utility gas
- 1.6%Bottled, tank, or LP gas
- 1.4%No fuel used
Private vs. public school enrollment:
| Here: | 11.4% |
| Florida: | 15.8% |
| Here: | 1.1% |
| Florida: | 12.9% |
| Here: | 4.5% |
| Florida: | 23.6% |


