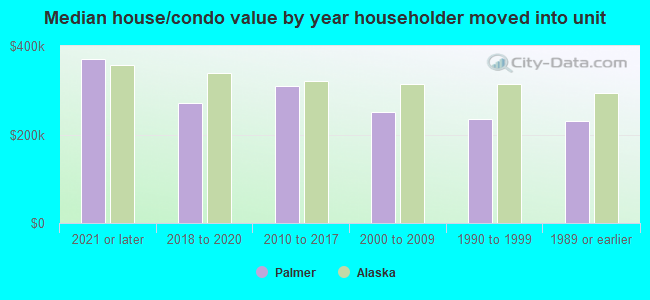
Palmer, AK (Alaska) Houses and Residents
| Palmer: | $284,121 |
| Alaska: | $336,900 |
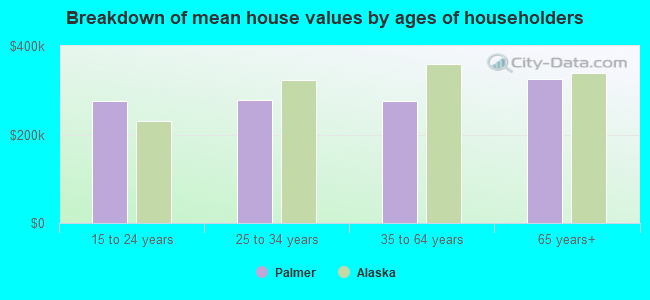
Mean price in 2022:
Detached houses: $287,234
Here: $287,234 State: $371,009 Townhouses or other attached units: $329,508
Here: $329,508 State: $298,041 In 2-unit structures: $257,300
Here: $257,300 State: $345,335 In 3-to-4-unit structures: $509,254
Here: $509,254 State: $302,340 Mobile homes: $151,633
Here: $151,633 State: $72,602
Total population: 6,515 (Urban population: 4,524 (all inside urban clusters), Rural population: 54 (all nonfarm))
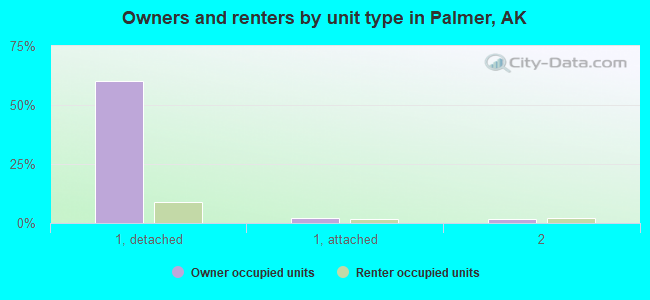
Houses: 2,455 (2,262 occupied: 1,418 owner occupied, 850 renter occupied)
| % of renters here: | 37% |
| State: | 34% |
Housing density: 653 houses/condos per square mile
Median price asked for vacant for-sale houses and condos in 2022: $177,003.
Median contract rent in 2022: $1,067 (lower quartile is $683, upper quartile is $1,290)
Median rent asked for vacant for-rent units in 2022: $526
Median gross rent in Palmer, AK in 2022: $1,168
Housing units in Palmer with a mortgage: 996 (17 second mortgage, 0 home equity loan, 12 both second mortgage and home equity loan)
Houses without a mortgage: 0
Median household income for houses/condos with a mortgage: $92,349
Median household income for apartments without a mortgage: $61,744
Median monthly housing costs: $1,252
Compare current foreclosures near Palmer, AK:
| Photo | Address | Area | Beds / Baths | Price | Details |
|---|---|---|---|---|---|

|
#1
Hilltop Dr
Palmer, AK 99645
|
- sq. feet
|
1 baths 2 beds |
show details | |

|
#2
Silver Tip Dr
Palmer, AK 99645
|
2,008 sq. feet
|
- baths - beds |
show details | |

|
#3
Silver Tip Dr
Palmer, AK 99645
|
832 sq. feet
|
- baths - beds |
show details | |

|
#4
E Jim Cottrell Cir # 10
Palmer, AK 99645
|
- sq. feet
|
- baths - beds |
show details | |

|
#5
Irene St
Palmer, AK 99645
|
- sq. feet
|
- baths - beds |
show details | |

|
#6
N Valley Way
Palmer, AK 99645
|
- sq. feet
|
- baths - beds |
show details | |

|
#7
S Denali St # B
Palmer, AK 99645
|
- sq. feet
|
- baths - beds |
show details | |

|
#8
N Citation Cir
Palmer, AK 99645
|
2,416 sq. feet
|
- baths - beds |
show details | |

|
#9
N Glenn Highway
Sutton, AK 99674
|
1,188 sq. feet
|
2 baths 3 beds |
$230,000
|
show details |

|
#10
E Larose Dr
Palmer, AK 99645
|
- sq. feet
|
- baths - beds |
show details |
| Photo | Address | Area | Beds / Baths | Price | Details |
|---|---|---|---|---|---|

|
#11
S Pinnacle Peak Dr
Wasilla, AK 99623
|
3,216 sq. feet
|
2 baths 5 beds |
show details | |

|
#12
N Barbi Dr
Wasilla, AK 99623
|
1,000 sq. feet
|
1 baths 2 beds |
show details | |

|
#13
W Riffle St
Wasilla, AK 99654
|
816 sq. feet
|
1 baths 2 beds |
show details | |

|
#14
N Tanana Dr
Wasilla, AK 99654
|
1,488 sq. feet
|
2 baths 3 beds |
show details | |

|
#15
Temple Dr
Chugiak, AK 99567
|
2,161 sq. feet
|
2 baths 3 beds |
show details | |

|
#16
N Ebro Cir
Wasilla, AK 99654
|
- sq. feet
|
1 baths 2 beds |
show details | |

|
#17
W Crazy Pearsons Rd
Wasilla, AK 99654
|
- sq. feet
|
2 baths 4 beds |
show details | |

|
#18
E Aspen St
Wasilla, AK 99654
|
2,788 sq. feet
|
- baths - beds |
show details | |

|
#19
E Frost Cir
Wasilla, AK 99654
|
- sq. feet
|
- baths - beds |
show details | |

|
#20
W Admiralty Cir
Wasilla, AK 99623
|
- sq. feet
|
- baths - beds |
show details |
| Photo | Address | Area | Beds / Baths | Price | Details |
|---|---|---|---|---|---|

|
#21
S Rue De La Paix Loop
Wasilla, AK 99623
|
1,344 sq. feet
|
- baths - beds |
show details | |

|
#22
E Alpine Meadow Dr
Wasilla, AK 99654
|
- sq. feet
|
- baths - beds |
show details | |

|
#23
W Secluded Meadows Loop
Wasilla, AK 99623
|
- sq. feet
|
- baths - beds |
show details | |

|
#24
N Edenfield Rd
Wasilla, AK 99623
|
1,048 sq. feet
|
- baths - beds |
show details | |

|
#25
S Loussac Ln
Wasilla, AK 99654
|
2,660 sq. feet
|
- baths - beds |
show details | |

|
#26
S Ridgeview Ct
Wasilla, AK 99654
|
1,624 sq. feet
|
- baths - beds |
show details | |

|
#27
W Vaunda Ave # 1
Wasilla, AK 99654
|
1,768 sq. feet
|
- baths - beds |
show details | |

|
#28
S Serrano Dr
Wasilla, AK 99654
|
996 sq. feet
|
- baths - beds |
show details | |

|
#29
S Well Site Rd
Wasilla, AK 99654
|
2,208 sq. feet
|
- baths - beds |
show details | |

|
#30
E Nelson Ave
Wasilla, AK 99654
|
- sq. feet
|
- baths - beds |
show details |
| Photo | Address | Area | Beds / Baths | Price | Details |
|---|---|---|---|---|---|

|
#31
S Rogers Cir # G8
Wasilla, AK 99654
|
- sq. feet
|
- baths - beds |
show details | |

|
#32
E Susitna Dr
Wasilla, AK 99654
|
1,512 sq. feet
|
- baths - beds |
show details | |

|
#33
E Mulchatna Dr
Wasilla, AK 99654
|
3,834 sq. feet
|
- baths - beds |
show details | |

|
#34
E Alder Dr
Wasilla, AK 99654
|
1,140 sq. feet
|
- baths - beds |
show details | |

|
#35
N Pioneer Peak Dr
Wasilla, AK 99654
|
512 sq. feet
|
- baths - beds |
show details | |

|
#36
E Fallbrooks Ave
Wasilla, AK 99654
|
1,352 sq. feet
|
- baths - beds |
show details | |

|
#37
N Saint Hermans St
Wasilla, AK 99654
|
1,736 sq. feet
|
- baths - beds |
show details | |

|
#38
N Jade Cir
Wasilla, AK 99654
|
- sq. feet
|
- baths - beds |
show details | |

|
#39
S Withers Rd
Wasilla, AK 99654
|
- sq. feet
|
- baths - beds |
show details | |

|
#40
W Tiller Ave
Wasilla, AK 99654
|
1,258 sq. feet
|
- baths - beds |
show details |
| Photo | Address | Area | Beds / Baths | Price | Details |
|---|---|---|---|---|---|

|
#41
E Heather Way
Wasilla, AK 99654
|
- sq. feet
|
- baths - beds |
show details | |

|
#42
N Cottonwood Loop
Wasilla, AK 99654
|
- sq. feet
|
- baths - beds |
show details | |

|
#43
N Singer Ct
Wasilla, AK 99623
|
- sq. feet
|
- baths - beds |
show details | |

|
#44
W Spinnaker Dr
Wasilla, AK 99623
|
- sq. feet
|
- baths - beds |
show details | |

|
Check over 1 million property listings on Foreclosure.com!
|
browse all offers | |||

Latest news about housing in Palmer, AK collected exclusively by city-data.com from local newspapers, TV, and radio stations


Median year apartment built: 1992
Household type by relationship:
Households: 6,352- Male householders: 1,106 (297 living alone), Female householders: 1,221 (416 living alone)
1,030 spouses (1,030 opposite-sex spouses), 237 unmarried partners, (237 opposite-sex unmarried partners), 1,877 children (1,613 natural, 86 adopted, 177 stepchildren), 128 grandchildren, 51 brothers or sisters, 90 parents, 27 foster children, 19 other relatives, 220 non-relatives
- In group quarters: 342
Size of family households: 512 2-persons, 240 3-persons, 302 4-persons, 121 5-persons, 79 6-persons, 55 7-or-more-persons.
Size of nonfamily households: 774 1-person, 162 2-persons, 48 3-persons, 4 5-persons.
900 married couples with children.
458 single-parent households (175 men, 283 women).
94.3% of residents of Palmer speak English at home.
1.9% of residents speak Spanish at home (57% speak English very well, 11% speak English well, 29% speak English not well, 3% don't speak English at all).
1.5% of residents speak other Indo-European language at home (98% speak English very well, 2% speak English not well).
1.4% of residents speak Asian or Pacific Island language at home (72% speak English very well, 18% speak English well, 10% speak English not well).
1.0% of residents speak other language at home (84% speak English very well, 16% speak English well).
Foreign born population: 163 (2.6%)
(79.1% of them are naturalized citizens)
| Here: | 5.8 |
| State: | 5.6 |
| Here: | 3.8 |
| State: | 3.9 |
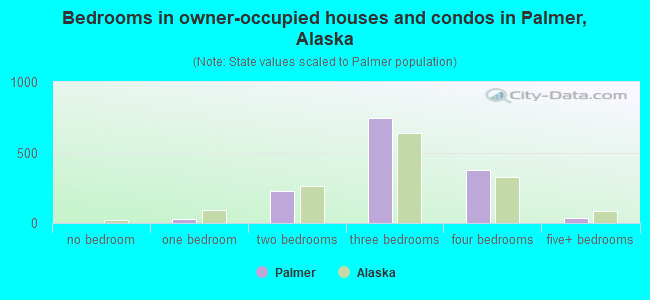
- Bedrooms in owner-occupied houses and condos in Palmer, Alaska
- 0no bedroom
- 301 bedroom
- 2262 bedrooms
- 7483 bedrooms
- 3754 bedrooms
- 395+ bedrooms
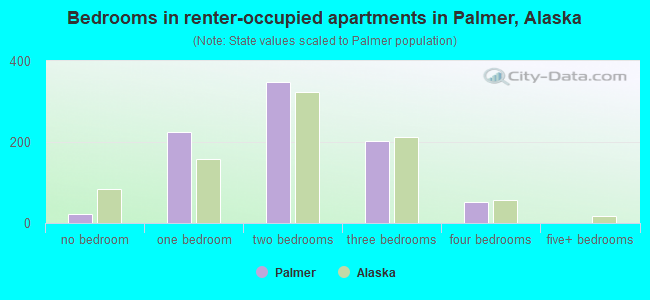
- Bedrooms in renter-occupied apartments in Palmer, Alaska
- 22no bedroom
- 2251 bedroom
- 3492 bedrooms
- 2033 bedrooms
- 524 bedrooms
- 05+ bedrooms
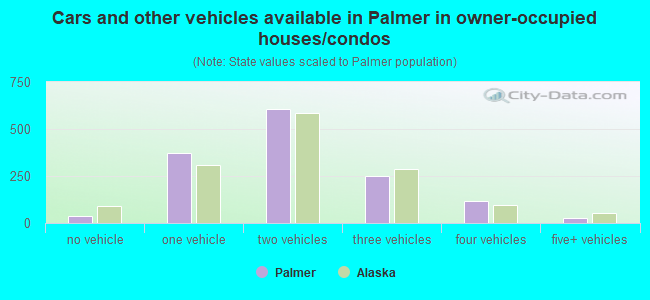
- Cars and other vehicles available in Palmer in owner-occupied houses/condos
- 39no vehicle
- 3751 vehicle
- 6082 vehicles
- 2503 vehicles
- 1194 vehicles
- 275+ vehicles
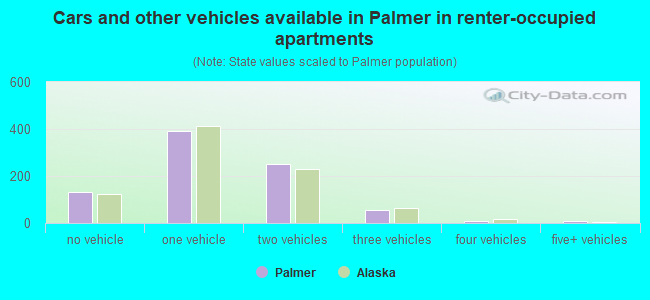
- Cars and other vehicles available in Palmer in renter-occupied apartments
- 133no vehicle
- 3911 vehicle
- 2522 vehicles
- 573 vehicles
- 84 vehicles
- 95+ vehicles
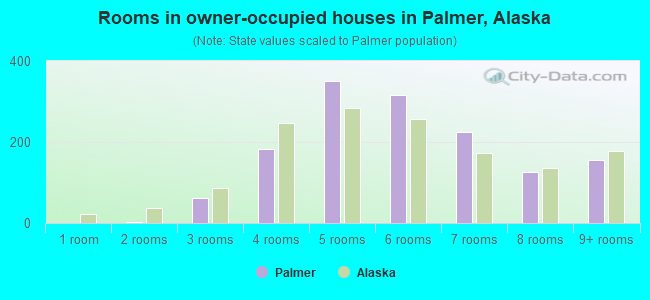
- Rooms in owner-occupied houses in Palmer, Alaska
- 01 room
- 32 rooms
- 623 rooms
- 1824 rooms
- 3505 rooms
- 3176 rooms
- 2247 rooms
- 1268 rooms
- 1559+ rooms
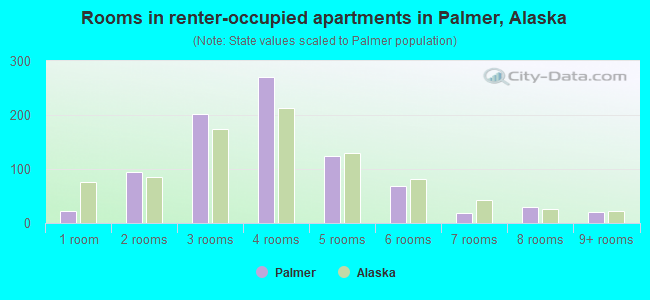
- Rooms in renter-occupied apartments in Palmer, Alaska
- 221 room
- 952 rooms
- 2023 rooms
- 2714 rooms
- 1245 rooms
- 686 rooms
- 187 rooms
- 298 rooms
- 209+ rooms
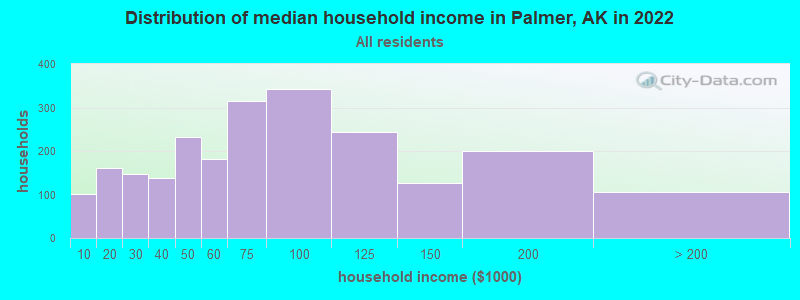
Palmer, AK household income distribution

- 102Less than $10,000
- 160$10,000 to $19,999
- 148$20,000 to $29,999
- 137$30,000 to $39,999
- 233$40,000 to $49,999
- 181$50,000 to $59,999
- 314$60,000 to $74,999
- 343$75,000 to $99,999
- 243$100,000 to $124,999
- 126$125,000 to $149,999
- 201$150,000 to $199,999
- 106$200,000 or more
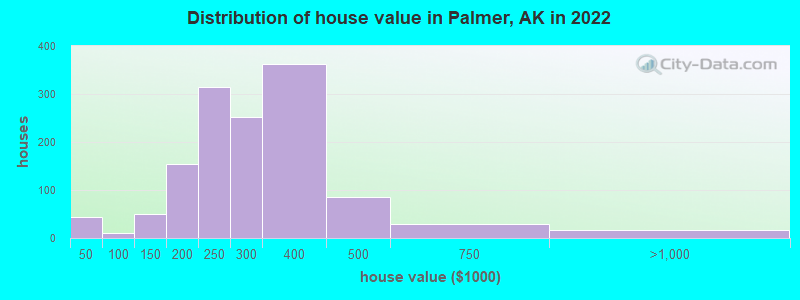
Home value of owner - occupied houses in 2022 in Palmer, AK
-
- 21Less than $10,000
- 2$10,000 to $14,999
- 0$20,000 to $24,999
- 3$25,000 to $29,999
- 14$30,000 to $34,999
- 3$50,000 to $59,999
- 3$60,000 to $69,999
- 1$70,000 to $79,999
- 1$90,000 to $99,999
- 11$100,000 to $124,999
- 36$125,000 to $149,999
- 59$150,000 to $174,999
- 95$175,000 to $199,999
- 314$200,000 to $249,999
- 252$250,000 to $299,999
- 361$300,000 to $399,999
- 85$400,000 to $499,999
- 29$500,000 to $749,999
- 9$750,000 to $999,999
- 6$2,000,000 or more
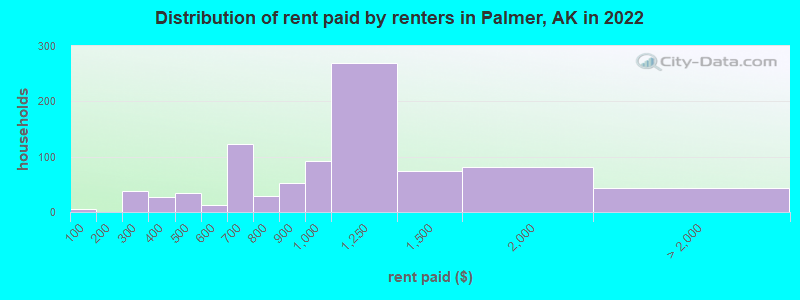
Rent paid by renters in 2022 in Palmer, AK
-
- 5Less than $100
- 12$200 to $249
- 25$250 to $299
- 2$300 to $349
- 25$350 to $399
- 20$400 to $449
- 14$450 to $499
- 13$550 to $599
- 71$600 to $649
- 51$650 to $699
- 19$700 to $749
- 9$750 to $799
- 52$800 to $899
- 91$900 to $999
- 268$1,000 to $1,249
- 73$1,250 to $1,499
- 81$1,500 to $1,999
- 15$2,000 to $2,499
- 28No cash rent
Percentage of workers working in this county: 76.4%
Number of people working at home: 250 (8.8% of all workers)
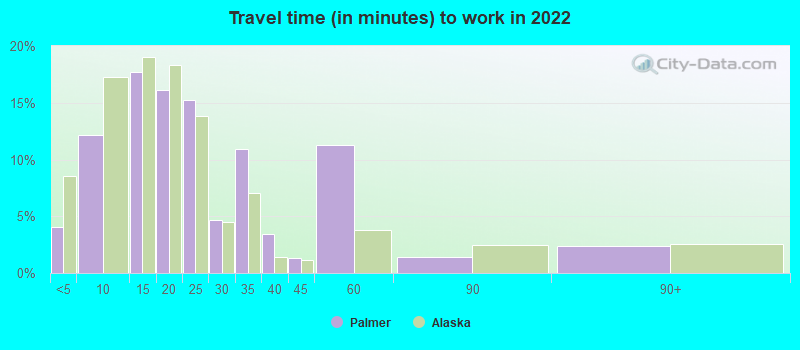
Travel time to work (commute)
- Less than 5 minutes: 222
- 5 to 9 minutes: 486
- 10 to 14 minutes: 351
- 15 to 19 minutes: 307
- 20 to 24 minutes: 196
- 25 to 29 minutes: 76
- 30 to 34 minutes: 222
- 35 to 39 minutes: 78
- 40 to 44 minutes: 39
- 45 to 59 minutes: 471
- 60 to 89 minutes: 160
- 90 or more minutes: 50
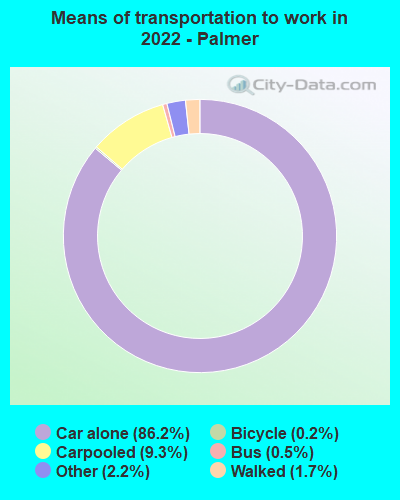
Means of transportation to work:
- Drove a car alone: 4,835 (81.5%)
- Carpooled: 546 (9.2%)
- Bus: 34 (0.6%)
- Taxi: 137 (2.3%)
- Bicycle: 5 (0.1%)
- Walked: 90 (1.5%)
- Worked at home: 221 (3.7%)
- Unemployment by race in 2022
- Unemployment rate for White non-Hispanic residents
- 6.9%Males
- 8.5%Females
- Unemployment rate for American Indian and Alaska Native residents
- 15.8%Males
- 20.5%Females
- Unemployment rate for Asian residents
- 27.4%Females
- Unemployment rate for two or more race residents
- 14.5%Males
- 10.8%Females
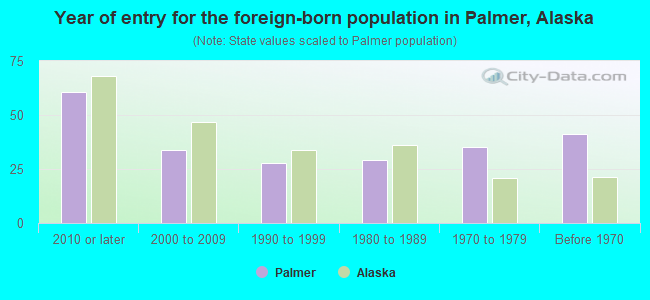
- Year of entry for the foreign-born population in Palmer, Alaska
- 612010 or later
- 342000 to 2009
- 281990 to 1999
- 291980 to 1989
- 351970 to 1979
- 41Before 1970
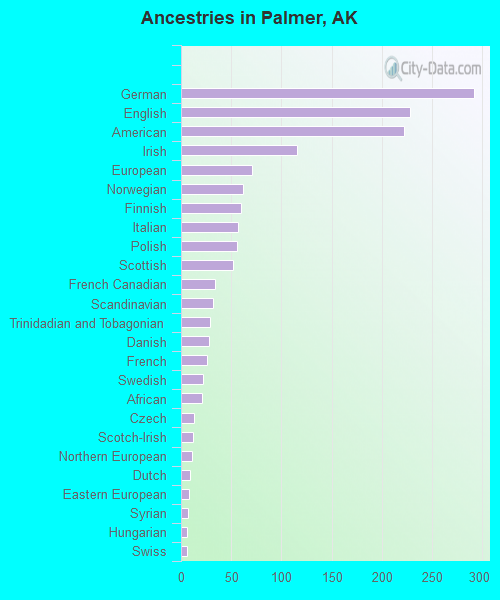
First ancestries reported:
- German: 292 (10.6%)
- English: 228 (8.3%)
- American: 222 (8.1%)
- Irish: 115 (4.2%)
- European: 71 (2.6%)
- Norwegian: 62 (2.3%)
- Finnish: 60 (2.2%)
- Italian: 57 (2.1%)
- Polish: 56 (2.0%)
- Scottish: 52 (1.9%)
- French Canadian: 34 (1.2%)
- Scandinavian: 32 (1.2%)
- Trinidadian and Tobagonian: 29 (1.1%)
- Danish: 28 (1.0%)
- French: 26 (0.9%)
- Swedish: 22 (0.8%)
- African: 21 (0.8%)
- Czech: 13 (0.5%)
- Scotch-Irish: 12 (0.4%)
- Northern European: 11 (0.4%)
- Dutch: 9 (0.3%)
- Eastern European: 8 (0.3%)
- Syrian: 7 (0.3%)
- Hungarian: 6 (0.2%)
- Swiss: 6 (0.2%)
- Portuguese: 3 (0.1%)
- Cajun: 2 (0.07%)
- Slovene: 2 (0.07%)
- Nigerian: 1 (0.04%)
Most common places of birth for foreign-born residents (%):
| Palmer: | 26.2% (50) |
| Alaska: | 33.1% (19,195) |
| Palmer: | 20.4% (39) |
| Alaska: | 6.6% (3,837) |
| Palmer: | 5.2% (10) |
| Alaska: | 2.0% (1,137) |
| Palmer: | 4.7% (9) |
| Alaska: | 0.6% (376) |
| Palmer: | 4.7% (9) |
| Alaska: | 5.0% (2,924) |
| Palmer: | 4.2% (8) |
| Alaska: | 2.4% (1,382) |
| Palmer: | 3.7% (7) |
| Alaska: | 0.2% (125) |
| Palmer: | 3.1% (6) |
| Alaska: | 0.2% (106) |
| Palmer: | 2.6% (5) |
| Alaska: | 0.6% (368) |
| Palmer: | 2.6% (5) |
| Alaska: | 0.4% (205) |
| Palmer: | 2.1% (4) |
| Alaska: | 0.5% (313) |
| Palmer: | 2.1% (4) |
| Alaska: | 0.4% (217) |
| Palmer: | 2.1% (4) |
| Alaska: | 0.9% (512) |
| Palmer: | 1.6% (3) |
| Alaska: | 0.7% (389) |
| Palmer: | 1.6% (3) |
| Alaska: | 5.8% (3,384) |
| Palmer: | 1.6% (3) |
| Alaska: | 5.3% (3,101) |
| Palmer: | 1.6% (3) |
| Alaska: | 0.3% (192) |
Place of birth for U.S.-born residents:
- This state: 2,881
- Other state: 3,260
- Northeast: 281
- Midwest: 802
- South: 618
- West: 1,565
86.3% of Palmer residents lived in the same house 1 years ago.
Out of people who lived in different houses, 36.2% lived in this county.
Out of people who lived in different counties, 47.6% lived in Alaska.
| Palmer: | 86.3% |
| State average: | 84.8% |
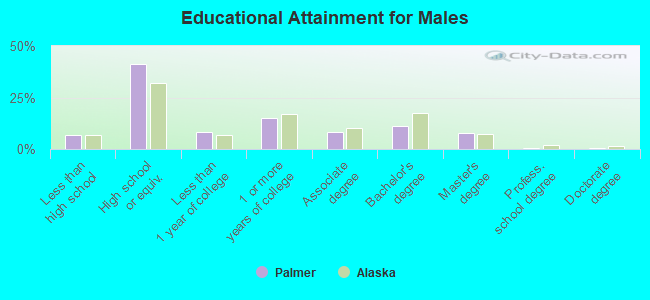
Education attainment for males 25 years and older:
- No schooling: 17
- Nursery to 4th grade: 7
- 5th and 6th grade: 14
- 7th and 8th grade: 16
- 9th grade: 15
- 10th grade: 9
- 11th grade: 40
- 12th grade, no diploma: 18
- High school graduate (or equivalency): 824
- Less than 1 year of college: 169
- Some college more than 1 year, no degree: 300
- Associate degree: 165
- Bachelor's degree: 221
- Master's degree: 156
- Professional school degree: 8
- Doctorate degree: 13
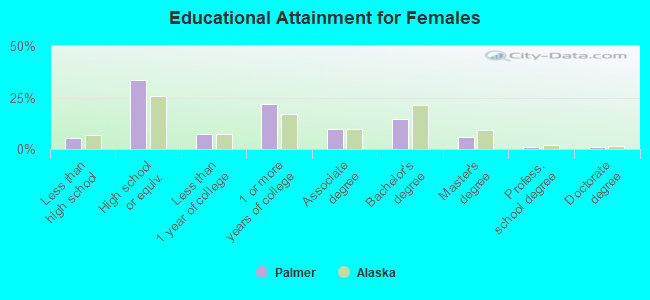
Education attainment for females 25 years and older:
- No schooling: 13
- Nursery to 4th grade: 0
- 5th and 6th grade: 11
- 7th and 8th grade: 0
- 9th grade: 10
- 10th grade: 12
- 11th grade: 23
- 12th grade, no diploma: 37
- High school graduate (or equivalency): 671
- Less than 1 year of college: 146
- Some college more than 1 year, no degree: 438
- Associate degree: 192
- Bachelor's degree: 293
- Master's degree: 114
- Professional school degree: 24
- Doctorate degree: 15


Housing units in structures:
- One, detached: 1,602
- One, attached: 125
- Two: 87
- 3 or 4: 103
- 5 to 9: 239
- 10 to 19: 97
- 20 to 49: 143
- 50 or more: 36
- Mobile homes: 20
Median worth of mobile homes: $61,310
Housing units lacking complete kitchen facilities in 2022: 0.7%
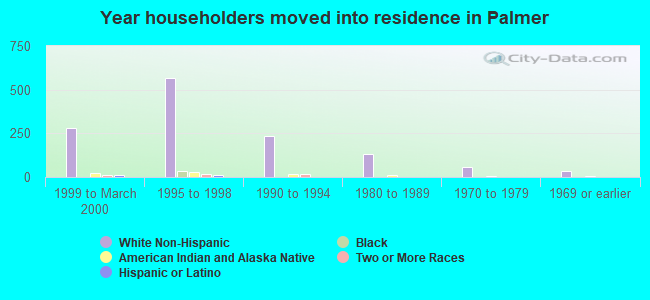
House/condo owner moved in on average 8 years ago
Renter moved in on average 3 years ago
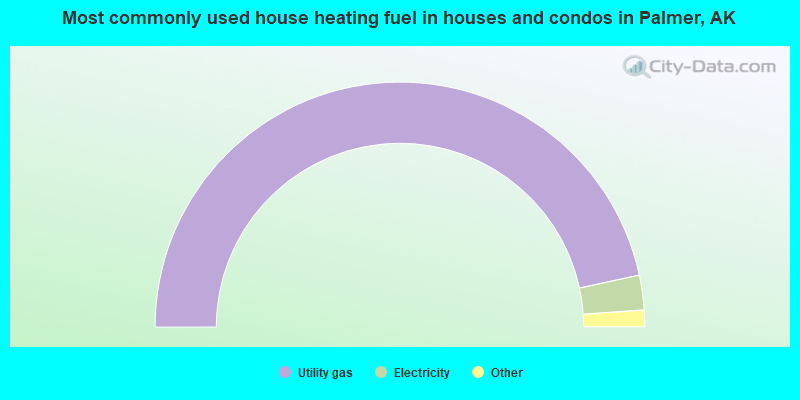
- 93.3%Utility gas
- 4.6%Electricity
- 0.9%Bottled, tank, or LP gas
- 0.6%Fuel oil, kerosene, etc.
- 0.4%Wood
- 0.1%No fuel used
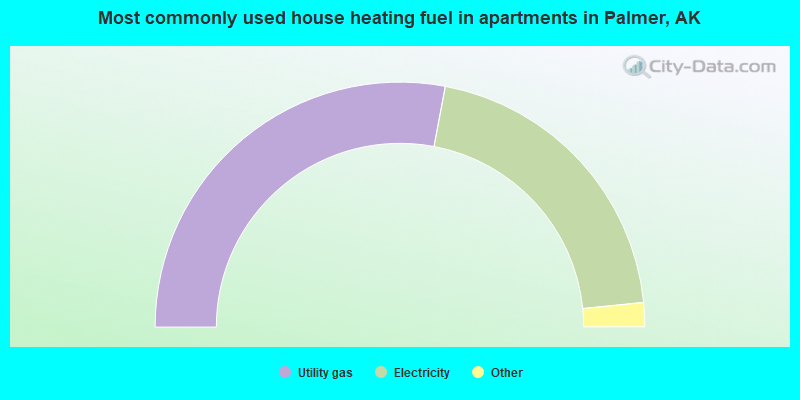
- 56.0%Utility gas
- 40.9%Electricity
- 1.0%Bottled, tank, or LP gas
- 1.0%No fuel used
- 0.6%Fuel oil, kerosene, etc.
- 0.6%Other fuel
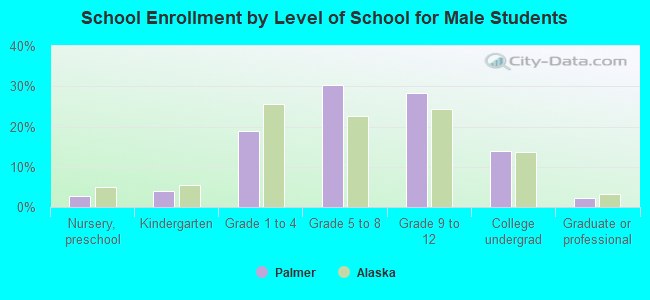
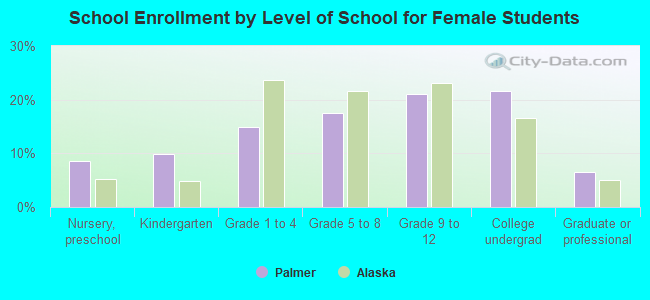
Private vs. public school enrollment:
| Here: | 26.7% |
| Alaska: | 15.7% |
| Here: | 36.8% |
| Alaska: | 13.7% |
| Here: | 7.4% |
| Alaska: | 14.7% |