Oregon City, OR (Oregon) Houses and Residents
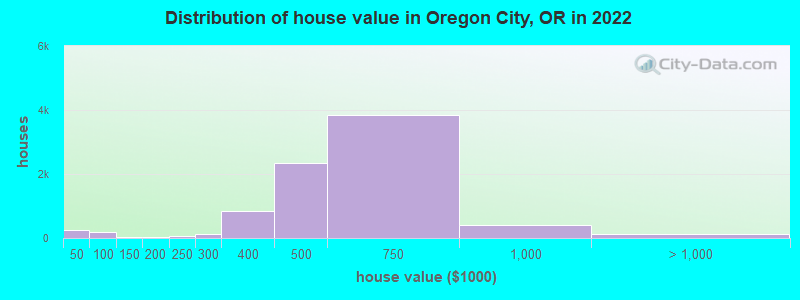
Estimated median house or condo value in 2022: $546,383 (it was $161,900 in 2000 )
Oregon City:
$546,383Oregon:
$475,600
Lower value quartile - upper value quartile: $433,965 - $698,754Mean price in 2022: Detached houses: $552,833 Here:
$552,833State:
$562,872
Townhouses or other attached units: $440,861 Here:
$440,861State:
$463,029
In 2-unit structures: $487,550 Here:
$487,550State:
$505,105
Mobile homes: $180,469 Here:
$180,469State:
$214,044
Total population: 35,266 (Urban population: 25,507, Rural population: 26 (all nonfarm) )
Houses: 14,563 (14,095 occupied: 9,167 owner occupied, 4,875 renter occupied )
% of renters here:
35%State:
37%
Housing density: 1,789 houses/condos per square mile
Median price asked for vacant for-sale houses and condos in 2022: $420,249.
Median contract rent in 2022: $1,368 (lower quartile is $1,020, upper quartile is $1,814)
Median rent asked for vacant for-rent units in 2022: $2,097
Median gross rent in Oregon City, OR in 2022: $1,527
Housing units in Oregon City with a mortgage: 7,077 (1,008 second mortgage, 104 home equity loan, 845 both second mortgage and home equity loan )Houses without a mortgage: 213
Median household income for houses/condos with a mortgage: $124,954
Median household income for apartments without a mortgage: $70,900
Median monthly housing costs: $1,795
Data:
Median house or condo value ($)
Median house or condo value ($ change since 2000)
Median house or condo value ($) - White
Median house or condo value ($) - Black or African American
Median house or condo value ($) - Asian
Median house or condo value ($) - Hispanic or Latino
Median house or condo value ($) - American Indian and Alaska Native
Median house or condo value ($) - Multirace
Median house or condo value ($) - Other Race
Median price asked for mobile homes ($)
Household density (households per square mile)
Mean house or condo value by units in structure - 1, detached ($)
Mean house or condo value by units in structure - 1, attached ($)
Mean house or condo value by units in structure - 2 ($)
Mean house or condo value by units in structure by units in structure - 3 or 4 ($)
Mean house or condo value by units in structure - 5 or more ($)
Mean house or condo value by units in structure - Boat, RV, van, etc. ($)
Mean house or condo value by units in structure - Mobile home ($)
Median contract rent ($)
Median contract rent - Lower quartile ($)
Median contract rent - Upper quartile ($)
Median gross rent ($)
Urban houses (%)
Rural houses (%)
Houses occupied (%)
Houses occupied (% change since 2000)
Houses owner occupied (%)
Houses owner occupied (% change since 2000)
Houses renter occupied (%)
Houses renter occupied (% change since 2000)
Vacant housing units - For rent (%)
Vacant housing units - For rent (% change since 2000)
Vacant housing units - For sale only (%)
Vacant housing units - For sale only (% change since 2000)
Vacant housing units - Rented or sold, not occupied (%)
Vacant housing units - Rented or sold, not occupied (% change since 2000)
Vacant housing units - For seasonal, recreational, or occasional use (%)
Vacant housing units - For seasonal, recreational, or occasional use (% change since 2000)
Vacant housing units - For migrant workers (%)
Vacant housing units - For migrant workers (% change since 2000)
Vacant housing units - Other vacant (%)
Vacant housing units - Other vacant (% change since 2000)
Median monthly housing costs ($)
Median household income for houses/condos with a mortgage ($)
Median household income for houses/condos without a mortgage ($)
Median household income ($)
Median household income ($) - White
Median household income ($) - Black or African American
Median household income ($) - Asian
Median household income ($) - Hispanic or Latino
Median household income ($) - American Indian and Alaska Native
Median household income ($) - Multirace
Median household income ($) - Other Race
Mortgage status - with mortgage (%)
Mortgage status - with second mortgage (%)
Mortgage status - with home equity loan (%)
Mortgage status - with both second mortgage and home equity loan (%)
Mortgage status - without a mortgage (%)
Median year house/condo built
Median year apartment built
Household type by relationship - Male householder living alone (%)
Household type by relationship - Male householder not living alone (%)
Household type by relationship - Female householder living alone (%)
Household type by relationship - Female householder not living alone (%)
Household type by relationship - Opposite-Sex spouse (%)
Household type by relationship - Same-Sex spouse (%)
Household type by relationship - Opposite-Sex unmarried partner (%)
Household type by relationship - Same-Sex unmarried partner (%)
Household type by relationship - In group quarters (%)
Size of family households - 2-person household (%)
Size of family households - 3-person household (%)
Size of family households - 4-person household (%)
Size of family households - 5-person household (%)
Size of family households - 6-person household (%)
Size of family households - 7-or-more-person household (%)
Size of nonfamily households - 1-person household (%)
Size of nonfamily households - 2-person household (%)
Size of nonfamily households - 3-person household (%)
Size of nonfamily households - 4-person household (%)
Size of nonfamily households - 5-person household (%)
Size of nonfamily households - 6-person household (%)
Size of nonfamily households - 7-or-moreperson household (%)
Year house built - Built 2010 or later (%)
Year house built - Built 2000 to 2009 (%)
Year house built - Built 1990 to 1999 (%)
Year house built - Built 1980 to 1989 (%)
Year house built - Built 1970 to 1979 (%)
Year house built - Built 1960 to 1969 (%)
Year house built - Built 1950 to 1959 (%)
Year house built - Built 1940 to 1949 (%)
Year house built - Built 1939 or earlier (%)
Median number of rooms in houses and condos
Median number of rooms in apartments
Median number of bedrooms in owner occupied houses
Mean number of bedrooms in owner occupied houses
Median number of bedrooms in renter occupied houses
Mean number of bedrooms in renter occupied houses
Median number of vehichles in owner occupied houses
Mean number of vehichles in owner occupied houses
Median number of vehichles in renter occupied houses
Mean number of vehichles in renter occupied houses
Rooms in owner-occupied houses - 1 room (%)
Rooms in owner-occupied houses - 2 rooms (%)
Rooms in owner-occupied houses - 3 rooms (%)
Rooms in owner-occupied houses - 4 rooms (%)
Rooms in owner-occupied houses - 5 rooms (%)
Rooms in owner-occupied houses - 6 rooms (%)
Rooms in owner-occupied houses - 7 rooms (%)
Rooms in owner-occupied houses - 8 rooms (%)
Rooms in owner-occupied houses - 9+ rooms (%)
Rooms in renter-occupied houses - 1 room (%)
Rooms in renter-occupied houses - 2 rooms (%)
Rooms in renter-occupied houses - 3 rooms (%)
Rooms in renter-occupied houses - 4 rooms (%)
Rooms in renter-occupied houses - 5 rooms (%)
Rooms in renter-occupied houses - 6 rooms (%)
Rooms in renter-occupied houses - 7 rooms (%)
Rooms in renter-occupied houses - 8 rooms (%)
Rooms in renter-occupied houses - 9+ rooms (%)
Bedrooms in owner-occupied houses - no bedrooms (%)
Bedrooms in owner-occupied houses - 1 bedroom (%)
Bedrooms in owner-occupied houses - 2 bedrooms (%)
Bedrooms in owner-occupied houses - 3 bedrooms (%)
Bedrooms in owner-occupied houses - 4 bedrooms (%)
Bedrooms in owner-occupied houses - 5+ bedrooms (%)
Bedrooms in renter-occupied houses - no bedrooms (%)
Bedrooms in renter-occupied houses - 1 bedroom (%)
Bedrooms in renter-occupied houses - 2 bedrooms (%)
Bedrooms in renter-occupied houses - 3 bedrooms (%)
Bedrooms in renter-occupied houses - 4 bedrooms (%)
Bedrooms in renter-occupied houses - 5+ bedrooms (%)
Vehicles available in owner-occupied houses - no vehicle available (%)
Vehicles available in owner-occupied houses - 1 vehicle available(%)
Vehicles available in owner-occupied houses - 2 Vehicles available (%)
Vehicles available in owner-occupied houses - 3 Vehicles available (%)
Vehicles available in owner-occupied houses - 4 Vehicles available (%)
Vehicles available in owner-occupied houses - 5+ Vehicles available (%)
Vehicles available in renter-occupied houses - no vehicle available (%)
Vehicles available in renter-occupied houses - 1 vehicle available (%)
Vehicles available in renter-occupied houses - 2 Vehicles available (%)
Vehicles available in renter-occupied houses - 3 Vehicles available (%)
Vehicles available in renter-occupied houses - 4 Vehicles available (%)
Vehicles available in renter-occupied houses - 5+ Vehicles available (%)
Housing units in structures - 1, detached (%)
Housing units in structures - 1, attached (%)
Housing units in structures - 2 (%)
Housing units in structures - 3 or 4 (%)
Housing units in structures - 5 to 9 (%)
Housing units in structures - 10 to 19 (%)
Housing units in structures - 20 to 49 (%)
Housing units in structures - 50 or more (%)
Housing units in structures - Mobile home (%)
Housing units in structures - Boat, RV, van, etc. (%)
Housing units in structures - Owners - 1, detached (%)
Housing units in structures - Owners - 1, attached (%)
Housing units in structures - Owners - 2 (%)
Housing units in structures - Owners - 3 or 4 (%)
Housing units in structures - Owners - 5 to 9 (%)
Housing units in structures - Owners - 10 to 19 (%)
Housing units in structures - Owners - 20 to 49 (%)
Housing units in structures - Owners - 50 or more (%)
Housing units in structures - Owners - Mobile home (%)
Housing units in structures - Owners - Boat, RV, van, etc. (%)
Housing units in structures - Renters - 1, detached (%)
Housing units in structures - Renters - 1, attached (%)
Housing units in structures - Renters - 2 (%)
Housing units in structures - Renters - 3 or 4 (%)
Housing units in structures - Renters - 5 to 9 (%)
Housing units in structures - Renters - 10 to 19 (%)
Housing units in structures - Renters - 20 to 49 (%)
Housing units in structures - Renters - 50 or more (%)
Housing units in structures - Renters - Mobile home (%)
Housing units in structures - Renters - Boat, RV, van, etc. (%)
House/condo owner moved in on average (years ago)
Renter moved in on average (years ago)
Year householder moved into unit - Moved in 1999 to March 2000 (%)
Year householder moved into unit - Moved in 1999 to March 2000 (%) - White
Year householder moved into unit - Moved in 1999 to March 2000 (%) - Black or African American
Year householder moved into unit - Moved in 1999 to March 2000 (%) - Asian
Year householder moved into unit - Moved in 1999 to March 2000 (%) - Hispanic or Latino
Year householder moved into unit - Moved in 1999 to March 2000 (%) - American Indian and Alaska Native
Year householder moved into unit - Moved in 1999 to March 2000 (%) - Multirace
Year householder moved into unit - Moved in 1999 to March 2000 (%) - Other Race
Year householder moved into unit - Moved in 1995 to 1998 (%)
Year householder moved into unit - Moved in 1995 to 1998 (%) - White
Year householder moved into unit - Moved in 1995 to 1998 (%) - Black or African American
Year householder moved into unit - Moved in 1995 to 1998 (%) - Asian
Year householder moved into unit - Moved in 1995 to 1998 (%) - Hispanic or Latino
Year householder moved into unit - Moved in 1995 to 1998 (%) - American Indian and Alaska Native
Year householder moved into unit - Moved in 1995 to 1998 (%) - Multirace
Year householder moved into unit - Moved in 1995 to 1998 (%) - Other Race
Year householder moved into unit - Moved in 1990 to 1994 (%)
Year householder moved into unit - Moved in 1990 to 1994 (%) - White
Year householder moved into unit - Moved in 1990 to 1994 (%) - Black or African American
Year householder moved into unit - Moved in 1990 to 1994 (%) - Asian
Year householder moved into unit - Moved in 1990 to 1994 (%) - Hispanic or Latino
Year householder moved into unit - Moved in 1990 to 1994 (%) - American Indian and Alaska Native
Year householder moved into unit - Moved in 1990 to 1994 (%) - Multirace
Year householder moved into unit - Moved in 1990 to 1994 (%) - Other Race
Year householder moved into unit - Moved in 1980 to 1989 (%)
Year householder moved into unit - Moved in 1980 to 1989 (%) - White
Year householder moved into unit - Moved in 1980 to 1989 (%) - Black or African American
Year householder moved into unit - Moved in 1980 to 1989 (%) - Asian
Year householder moved into unit - Moved in 1980 to 1989 (%) - Hispanic or Latino
Year householder moved into unit - Moved in 1980 to 1989 (%) - American Indian and Alaska Native
Year householder moved into unit - Moved in 1980 to 1989 (%) - Multirace
Year householder moved into unit - Moved in 1980 to 1989 (%) - Other Race
Year householder moved into unit - Moved in 1970 to 1979 (%)
Year householder moved into unit - Moved in 1970 to 1979 (%) - White
Year householder moved into unit - Moved in 1970 to 1979 (%) - Black or African American
Year householder moved into unit - Moved in 1970 to 1979 (%) - Asian
Year householder moved into unit - Moved in 1970 to 1979 (%) - Hispanic or Latino
Year householder moved into unit - Moved in 1970 to 1979 (%) - American Indian and Alaska Native
Year householder moved into unit - Moved in 1970 to 1979 (%) - Multirace
Year householder moved into unit - Moved in 1970 to 1979 (%) - Other Race
Year householder moved into unit - Moved in 1969 or earlier (%)
Year householder moved into unit - Moved in 1969 or earlier (%) - White
Year householder moved into unit - Moved in 1969 or earlier (%) - Black or African American
Year householder moved into unit - Moved in 1969 or earlier (%) - Asian
Year householder moved into unit - Moved in 1969 or earlier (%) - Hispanic or Latino
Year householder moved into unit - Moved in 1969 or earlier (%) - American Indian and Alaska Native
Year householder moved into unit - Moved in 1969 or earlier (%) - Multirace
Year householder moved into unit - Moved in 1969 or earlier (%) - Other Race
Housing units lacking complete plumbing facilities (%)
Housing units lacking complete kitchen facilities (%)
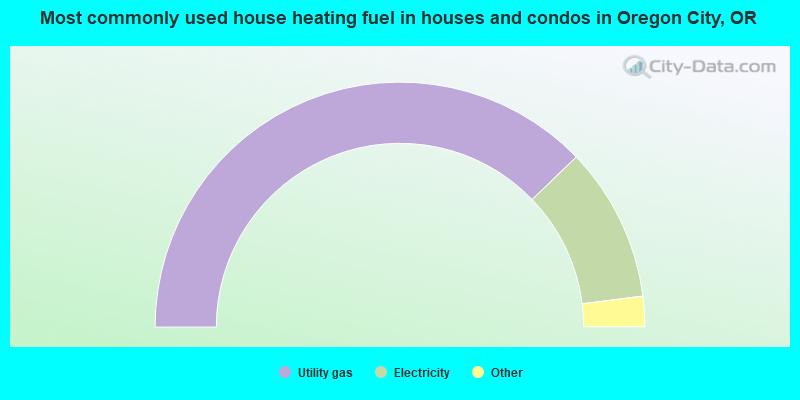
House heating fuel used in houses and condos - Utility gas (%)
House heating fuel used in houses and condos - Bottled, tank, or LP gas (%)
House heating fuel used in houses and condos - Electricity (%)
House heating fuel used in houses and condos - Fuel oil, kerosene, etc. (%)
House heating fuel used in houses and condos - Coal or coke (%)
House heating fuel used in houses and condos - Wood (%)
House heating fuel used in houses and condos - Solar energy (%)
House heating fuel used in houses and condos - Other fuel (%)
House heating fuel used in houses and condos - No fuel used (%)
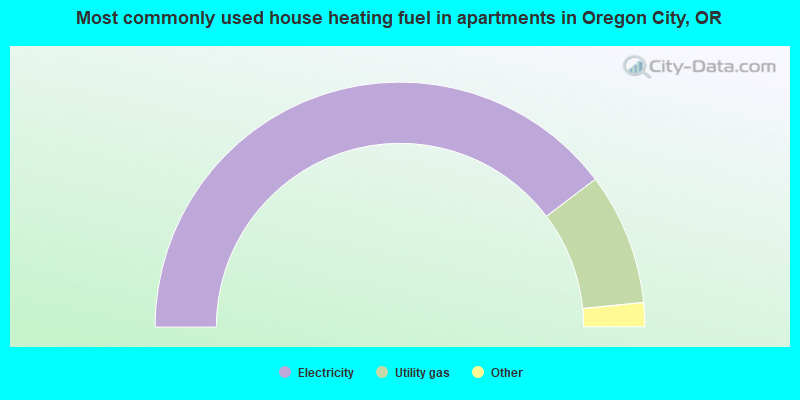
House heating fuel used in apartments - Utility gas (%)
House heating fuel used in apartments - Bottled, tank, or LP gas (%)
House heating fuel used in apartments - Electricity (%)
House heating fuel used in apartments - Fuel oil, kerosene, etc. (%)
House heating fuel used in apartments - Coal or coke (%)
House heating fuel used in apartments - Wood (%)
House heating fuel used in apartments - Solar energy (%)
House heating fuel used in apartments - Other fuel (%)
House heating fuel used in apartments - No fuel used (%)
Median year house/condo built: 1993Median year apartment built: 1985Household type by relationship:
Households: 37,618
Male householders: 7,046 (1,350 living alone ), Female householders: 6,829 (1,725 living alone )7,092 spouses (6,971 opposite-sex spouses ), 1,260 unmarried partners , (1,242 opposite-sex unmarried partners ), 11,125 children (10,258 natural , 248 adopted , 618 stepchildren ), 511 grandchildren , 200 brothers or sisters , 310 parents , 49 foster children , 481 other relatives , 1,780 non-relatives In group quarters: 929
Size of family households: 3,880 2-persons , 2,274 3-persons , 2,042 4-persons , 1,051 5-persons , 129 6-persons , 203 7-or-more-persons .
Size of nonfamily households: 3,064 1-person , 1,163 2-persons , 235 3-persons , 22 5-persons .
6,012 married couples with children. single-parent households (296 men , 1,029 women ).
91.6% of residents of Oregon City speak English at home. of residents speak Spanish at home (59% speak English very well , 29% speak English well , 11% speak English not well , 2% don't speak English at all ).of residents speak other Indo-European language at home (88% speak English very well , 4% speak English well , 8% speak English not well ).of residents speak Asian or Pacific Island language at home (80% speak English very well , 20% speak English well ).of residents speak other language at home (50% speak English very well , 25% speak English well , 25% speak English not well ).
Foreign born population: 1,819 (4.8%)of them are naturalized citizens )
Median number of rooms in houses and condos:
Median number of rooms in apartments
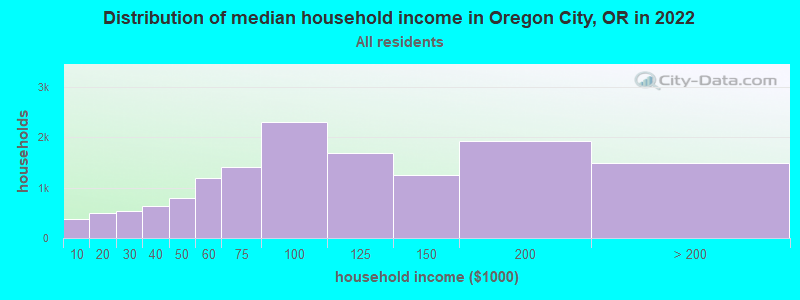
Oregon City, OR household income distribution 381 Less than $10,000488 $10,000 to $19,999535 $20,000 to $29,999642 $30,000 to $39,999798 $40,000 to $49,9991,188 $50,000 to $59,9991,400 $60,000 to $74,9992,300 $75,000 to $99,9991,694 $100,000 to $124,9991,244 $125,000 to $149,9991,918 $150,000 to $199,9991,489 $200,000 or more
Home value of owner - occupied houses in 2022 in Oregon City, OR 28 Less than $10,00057 $20,000 to $24,99969 $25,000 to $29,99922 $35,000 to $39,99971 $40,000 to $49,99911 $50,000 to $59,9995 $60,000 to $69,99991 $80,000 to $89,9994 $100,000 to $124,99920 $125,000 to $149,9999 $150,000 to $174,99918 $175,000 to $199,99962 $200,000 to $249,999132 $250,000 to $299,999856 $300,000 to $399,9992,351 $400,000 to $499,9993,856 $500,000 to $749,999420 $750,000 to $999,99955 $1,000,000 to $1,499,99958 $2,000,000 or moreRent paid by renters in 2022 in Oregon City, OR 51 Less than $100125 $100 to $14971 $150 to $19923 $250 to $29941 $300 to $34975 $350 to $39914 $450 to $49944 $550 to $59926 $600 to $649113 $650 to $69991 $700 to $749180 $750 to $799104 $800 to $899218 $900 to $999769 $1,000 to $1,249847 $1,250 to $1,4991,199 $1,500 to $1,999493 $2,000 to $2,49996 $2,500 to $2,99917 $3,000 to $3,4991 $3,500 or more107 No cash rent
Percentage of workers working in this county: 67.1%Number of people working at home: 3,411 (17.5% of all workers )
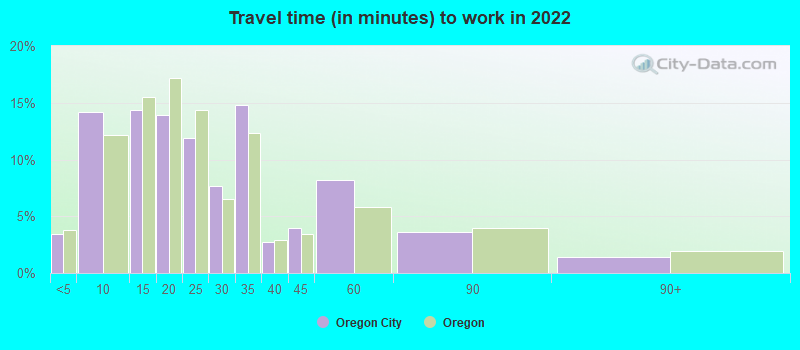
Travel time to work (commute)
Less than 5 minutes: 4315 to 9 minutes: 1,80410 to 14 minutes: 1,61815 to 19 minutes: 1,83420 to 24 minutes: 2,73125 to 29 minutes: 1,55530 to 34 minutes: 2,40935 to 39 minutes: 51240 to 44 minutes: 72345 to 59 minutes: 1,24660 to 89 minutes: 71790 or more minutes: 231
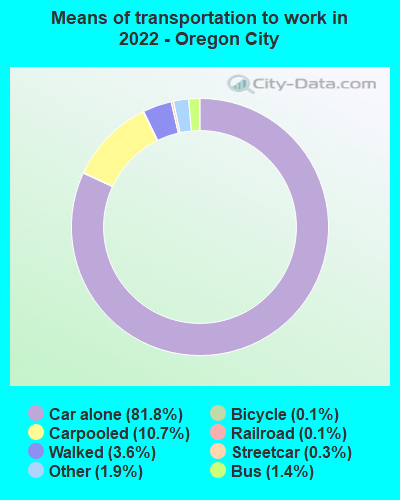
Means of transportation to work:
Drove a car alone: 11,749 (64.6%)Carpooled: 1,484 (8.2%)Bus : 225 (1.2%)Subway or elevated rail : 38 (0.2%)Light rail, streetcar or trolley : 42 (0.2%)Ferryboat: 4 (0.0%)Taxi: 251 (1.4%)Bicycle: 22 (0.1%)Walked: 662 (3.6%)Worked at home: 3,411 (18.7%)
Unemployment by race in 2022
Unemployment rate for White non-Hispanic residents 3.3% Males3.0% FemalesUnemployment rate for Black residents 26.5% Males100.0% FemalesUnemployment rate for Asian residents 18.6% MalesUnemployment rate for two or more race residents 1.9% Males1.7% FemalesUnemployment rate for Hispanic or Latino residents 1.0% Males2.5% Females
Year of entry for the foreign-born population in Oregon City, Oregon
351 2010 or later 419 2000 to 2009 588 1990 to 1999 408 1980 to 1989 196 1970 to 1979 235 Before 1970
First ancestries reported:
German: 2,948 (17.6%)
English: 1,823 (10.9%)
American: 1,748 (10.4%)
Ukrainian: 1,092 (6.5%)
European: 1,049 (6.3%)
Irish: 851 (5.1%)
Norwegian: 573 (3.4%)
Romanian: 304 (1.8%)
Scottish: 301 (1.8%)
Swedish: 245 (1.5%)
Italian: 226 (1.3%)
Scandinavian: 211 (1.3%)
Nigerian: 189 (1.1%)
Polish: 180 (1.1%)
German Russian: 175 (1.0%)
French: 163 (1.0%)
Scotch-Irish: 143 (0.9%)
Hungarian: 122 (0.7%)
Eastern European: 111 (0.7%)
Dutch: 90 (0.5%)
Portuguese: 83 (0.5%)
Northern European: 83 (0.5%)
Greek: 78 (0.5%)
British: 71 (0.4%)
Finnish: 66 (0.4%)
Lithuanian: 42 (0.3%)
Canadian: 37 (0.2%)
Swiss: 28 (0.2%)
Welsh: 26 (0.2%)
Iranian: 22 (0.1%)
Lebanese: 21 (0.1%)
Czechoslovakian: 21 (0.1%)
French Canadian: 20 (0.1%)
Belgian: 16 (0.10%)
Bahamian: 16 (0.10%)
Bulgarian: 15 (0.09%)
Maltese: 15 (0.09%)
Austrian: 11 (0.07%)
Czech: 11 (0.07%)
Somali: 11 (0.07%)
Danish: 10 (0.06%)
Russian: 10 (0.06%)
Croatian: 6 (0.04%)
African: 4 (0.02%)
New Zealander: 1 (0.01%) Most common places of birth for foreign-born residents (%): Ukraine Oregon City:
25.9% (512)Oregon:
2.1% (8,469)
Mexico Oregon City:
13.4% (264)Oregon:
33.9% (140,109)
Germany Oregon City:
10.6% (209)Oregon:
1.9% (8,005)
China, excluding Hong Kong and Taiwan Oregon City:
6.3% (124)Oregon:
5.2% (21,429)
Romania Oregon City:
5.6% (111)Oregon:
1.0% (4,043)
Philippines Oregon City:
5.1% (100)Oregon:
3.5% (14,530)
Canada Oregon City:
5.0% (98)Oregon:
3.7% (15,229)
Other Eastern Europe Oregon City:
4.2% (84)Oregon:
0.3% (1,202)
England Oregon City:
3.9% (77)Oregon:
1.5% (6,313)
United Kingdom, excluding England and Scotland Oregon City:
1.9% (37)Oregon:
1.2% (5,082)
Other South Central Asia Oregon City:
1.8% (35)Oregon:
0.1% (306)
Singapore Oregon City:
1.6% (31)Oregon:
0.2% (700)
Place of birth for U.S.-born residents:
This state: 22,362Other state: 13,194Northeast: 757Midwest: 2,681South: 1,528West: 8,201 87.3% of Oregon City residents lived in the same house 1 years ago.
Out of people who lived in different houses, 32.1% lived in this county.
Out of people who lived in different counties, 71.1% lived in Oregon.
Oregon City:
87.3%State average:
85.5%
Education attainment for males 25 years and older:
No schooling: 62Nursery to 4th grade: 05th and 6th grade: 157th and 8th grade: 769th grade: 5310th grade: 16111th grade: 5512th grade, no diploma: 129High school graduate (or equivalency): 4,054Less than 1 year of college: 1,636Some college more than 1 year, no degree: 2,068Associate degree: 1,293Bachelor's degree: 2,607Master's degree: 937Professional school degree: 123Doctorate degree: 95
Education attainment for females 25 years and older:
No schooling: 57Nursery to 4th grade: 85th and 6th grade: 97th and 8th grade: 2089th grade: 5210th grade: 13311th grade: 12512th grade, no diploma: 165High school graduate (or equivalency): 3,294Less than 1 year of college: 1,348Some college more than 1 year, no degree: 2,035Associate degree: 1,271Bachelor's degree: 3,461Master's degree: 753Professional school degree: 177Doctorate degree: 72
Housing units in structures:
One, detached: 9,982One, attached: 1,112Two: 4163 or 4: 7215 to 9: 58510 to 19: 44320 to 49: 47250 or more: 494Mobile homes: 300Boats, RVs, vans, etc.: 34Median worth of mobile homes: $66,655
Housing units lacking complete plumbing facilities in 2022: 0.1%Housing units lacking complete kitchen facilities in 2022: 1.7%House/condo owner moved in on average 9 years ago
Renter moved in on average 1 years ago
Private vs. public school enrollment:
Students in private schools in grades 1 to 8 (elementary and middle school): 1,193 Students in private schools in grades 9 to 12 (high school): 128 Students in private undergraduate colleges: 386