Housing density: 5,743 houses/condos per square mile
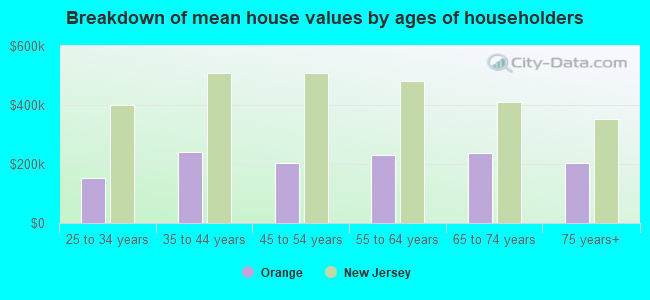
Median price asked for vacant for-sale houses and condos in 2022 in this county: $231,294.
Median contract rent in 2022: $1,258 (lower quartile is $983, upper quartile is $1,629)
Median rent asked for vacant for-rent units in 2022: $1,230
Median gross rent in Orange, NJ in 2022: $1,400
Housing units in Orange with a mortgage: 1,380 (167 second mortgage, 170 home equity loan, 0 both second mortgage and home equity loan) Houses without a mortgage: 435
In family households: 645,040 (104,343 male householders, 84,996 female householders)
113,673 spouses, 245,726 children (232,723 natural, 5,793 adopted, 7,210 stepchildren), 20,627 grandchildren, 15,422 brothers or sisters, 11,923 parents, foster children, 19,910 other relatives, 22,762 non-relatives
In nonfamily households: 115,157 (42,135 male householders (33,262 living alone)), 52,238 female householders (45,266 living alone)), 20,784 nonrelatives
In group quarters: 23,772 (12,126 institutionalized population)
108,634 married couples with children.
65,899 single-parent households (10,059 men, 55,840 women).
72.6% of residents of Orange speak English at home.
12.0% of residents speak Spanish at home (35% speak English very well, 24% speak English well, 31% speak English not well, 11% don't speak English at all).
13.0% of residents speak other Indo-European language at home (51% speak English very well, 31% speak English well, 16% speak English not well, 2% don't speak English at all).
0.5% of residents speak Asian or Pacific Island language at home (28% speak English very well, 43% speak English well, 29% speak English not well).
1.9% of residents speak other language at home (75% speak English very well, 21% speak English well, 3% speak English not well, 1% don't speak English at all).
Foreign born population: 15,243 (43.3%)
(48.1% of them are naturalized citizens)
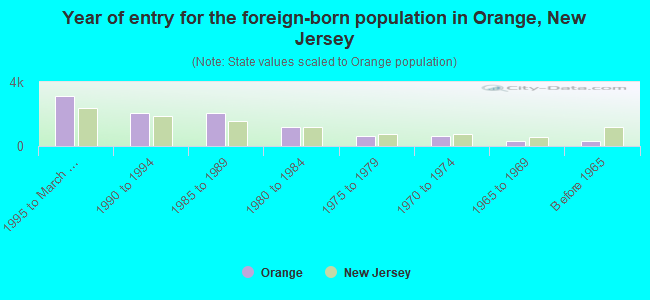
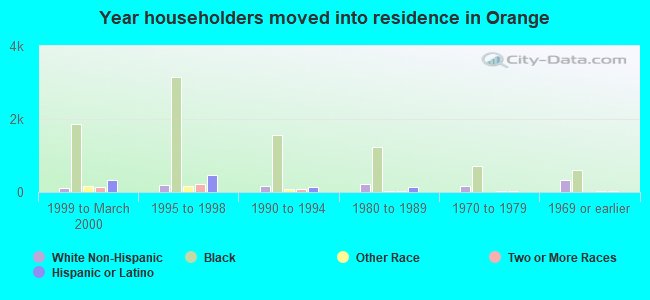
Year of entry for the foreign-born population in Orange, New Jersey
3,1031995 to March 2000
2,0731990 to 1994
2,0411985 to 1989
1,2041980 to 1984
6481975 to 1979
5991970 to 1974
3121965 to 1969
313Before 1965
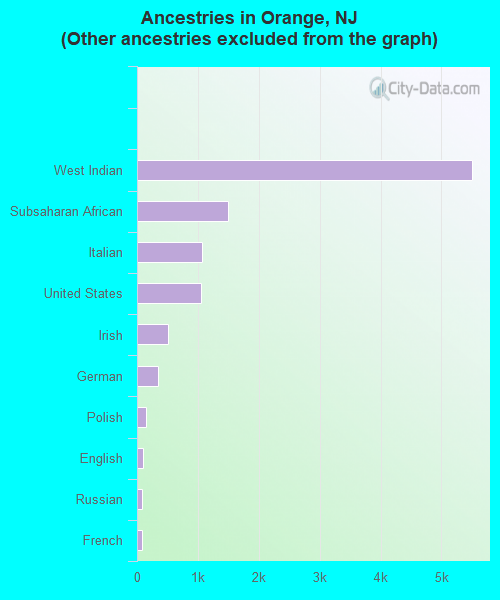
First ancestries reported:
Other: 18,012 (62.9%)
West Indian: 5,505 (19.2%)
Subsaharan African: 1,492 (5.2%)
Italian: 1,061 (3.7%)
United States: 1,051 (3.7%)
Irish: 508 (1.8%)
German: 340 (1.2%)
Polish: 140 (0.5%)
English: 92 (0.3%)
Russian: 82 (0.3%)
French: 78 (0.3%)
Scottish: 46 (0.2%)
Greek: 36 (0.1%)
Ukrainian: 32 (0.1%)
Arab: 26 (0.09%)
Hungarian: 23 (0.08%)
Slovak: 19 (0.07%)
Swedish: 18 (0.06%)
Czech: 16 (0.06%)
Dutch: 14 (0.05%)
Scotch-Irish: 13 (0.05%)
Welsh: 11 (0.04%)
Portuguese: 6 (0.02%)
Danish: 5 (0.02%)
Most common places of birth for foreign-born residents (%):
Haiti
Orange:
26.8% (2,757)
New Jersey:
2.2% (31,963)
Jamaica
Orange:
12.2% (1,254)
New Jersey:
2.5% (36,443)
Guyana
Orange:
9.1% (939)
New Jersey:
1.2% (17,746)
Trinidad and Tobago
Orange:
7.5% (775)
New Jersey:
0.9% (13,289)
El Salvador
Orange:
6.0% (614)
New Jersey:
1.9% (28,595)
Peru
Orange:
5.1% (524)
New Jersey:
3.1% (45,151)
Nigeria
Orange:
3.2% (326)
New Jersey:
0.6% (8,389)
Dominican Republic
Orange:
3.0% (305)
New Jersey:
6.2% (91,316)
Ecuador
Orange:
2.8% (293)
New Jersey:
3.6% (53,482)
Other South America
Orange:
2.4% (250)
New Jersey:
0.5% (7,095)
Mexico
Orange:
2.3% (236)
New Jersey:
4.6% (67,667)
Other Caribbean
Orange:
2.1% (220)
New Jersey:
0.5% (7,928)
Ghana
Orange:
1.8% (189)
New Jersey:
0.5% (7,079)
Place of birth for U.S.-born residents:
This state: 15,504
Other state: 6,682
Northeast: 2,163
Midwest: 206
South: 4,204
West: 109
57% of Orange residents lived in the same house 5 years ago. Out of people who lived in different houses, 81% lived in this county. Out of people who lived in different counties, 38% lived in New Jersey.
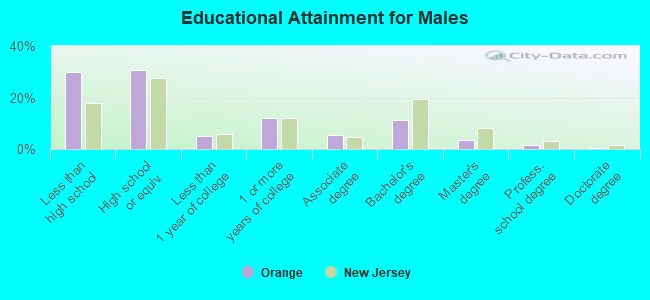
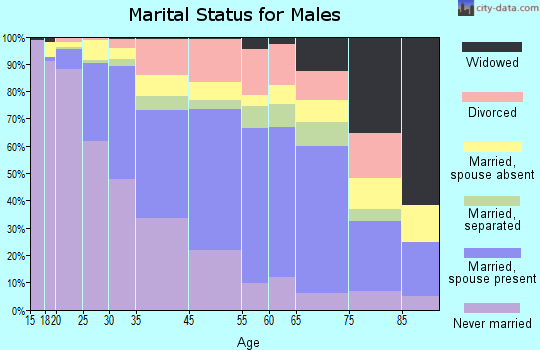
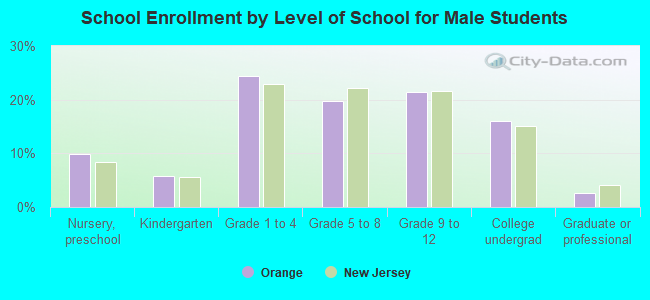
Education attainment for males 25 years and older:
No schooling: 260
Nursery to 4th grade: 139
5th and 6th grade: 160
7th and 8th grade: 383
9th grade: 302
10th grade: 271
11th grade: 298
12th grade, no diploma: 862
High school graduate (or equivalency): 2,738
Less than 1 year of college: 452
Some college more than 1 year, no degree: 1,078
Associate degree: 495
Bachelor's degree: 991
Master's degree: 328
Professional school degree: 136
Doctorate degree: 51
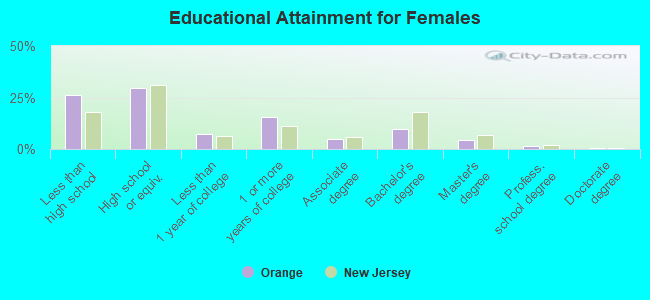
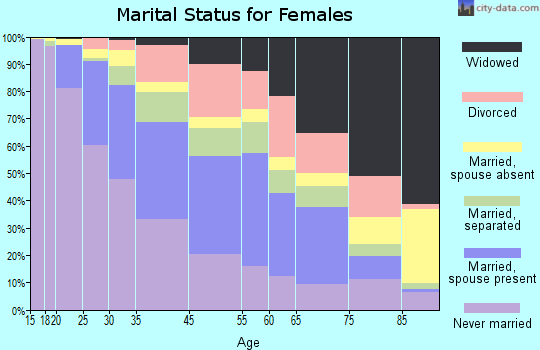
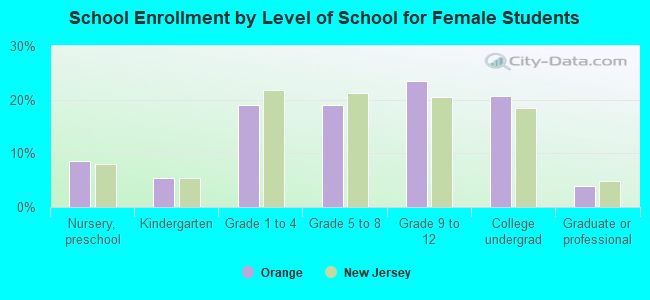
Education attainment for females 25 years and older:
No schooling: 299
Nursery to 4th grade: 106
5th and 6th grade: 264
7th and 8th grade: 442
9th grade: 343
10th grade: 387
11th grade: 330
12th grade, no diploma: 888
High school graduate (or equivalency): 3,447
Less than 1 year of college: 828
Some college more than 1 year, no degree: 1,825
Associate degree: 590
Bachelor's degree: 1,156
Master's degree: 533
Professional school degree: 187
Doctorate degree: 59
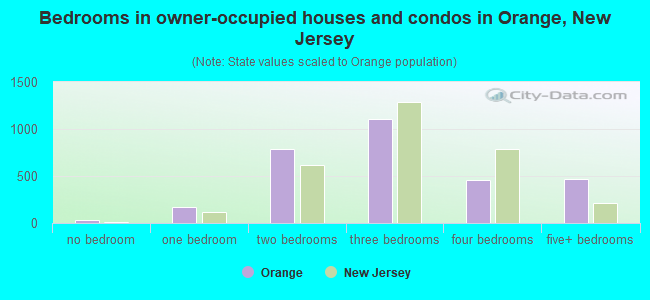
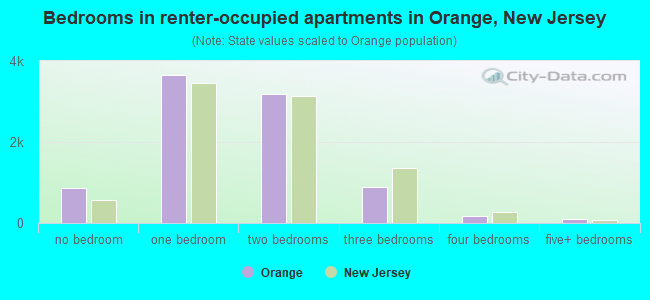
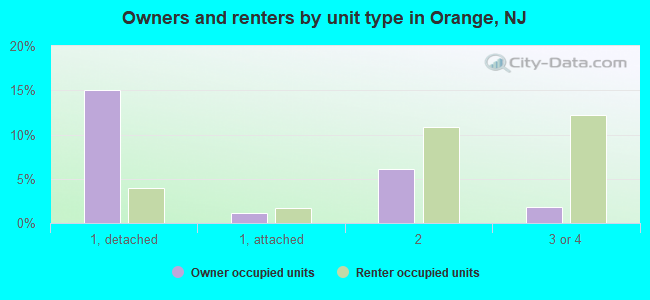
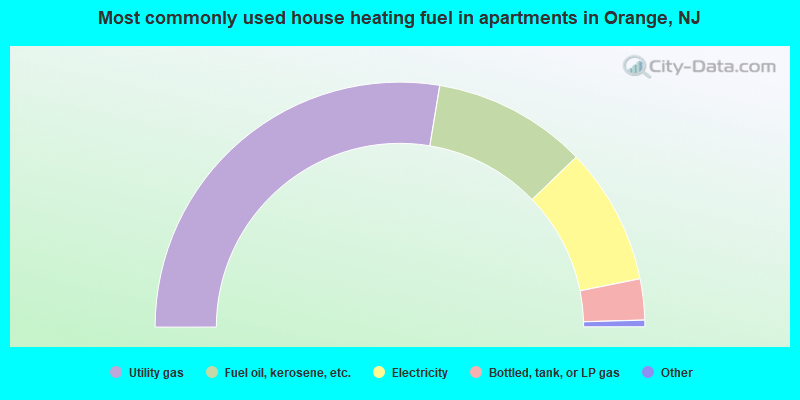
Housing units in structures:
One, detached: 2,314
One, attached: 351
Two: 2,083
3 or 4: 1,971
5 to 9: 652
10 to 19: 789
20 to 49: 2,195
50 or more: 2,310
Housing units lacking complete plumbing facilities: 2.2%
Housing units lacking complete kitchen facilities: 1.7%