Ontario, NY (New York) Houses and Residents
Estimated median house or condo value in 2022: $206,022 (it was $105,200 in 2000 )
Ontario:
$206,022New York:
$400,400
Lower value quartile - upper value quartile: $135,752 - $314,180Total population: 10,136 (Urban population: 4,120, Rural population: 5,658 (43 farm, 5,615 nonfarm ))
Houses: 3,814 (3,617 occupied: 3,001 owner occupied, 616 renter occupied )
% of renters here:
17%State:
46%
Housing density: 118 houses/condos per square mile
Median price asked for vacant for-sale houses and condos in 2022 in this county: $95,939.
Median contract rent in 2022: $765 (lower quartile is $470, upper quartile is $1,021)
Median rent asked for vacant for-rent units in 2022: $847
Median gross rent in Ontario, NY in 2022: $975
Housing units in Ontario with a mortgage: 1,864 (227 second mortgage, 367 home equity loan, 0 both second mortgage and home equity loan )Houses without a mortgage: 473
Data:
Median house or condo value ($)
Median house or condo value ($ change since 2000)
Median house or condo value ($) - White
Median house or condo value ($) - Black or African American
Median house or condo value ($) - Asian
Median house or condo value ($) - Hispanic or Latino
Median house or condo value ($) - American Indian and Alaska Native
Median house or condo value ($) - Multirace
Median house or condo value ($) - Other Race
Median price asked for mobile homes ($)
Household density (households per square mile)
Mean house or condo value by units in structure - 1, detached ($)
Mean house or condo value by units in structure - 1, attached ($)
Mean house or condo value by units in structure - 2 ($)
Mean house or condo value by units in structure by units in structure - 3 or 4 ($)
Mean house or condo value by units in structure - 5 or more ($)
Mean house or condo value by units in structure - Boat, RV, van, etc. ($)
Mean house or condo value by units in structure - Mobile home ($)
Median contract rent ($)
Median contract rent - Lower quartile ($)
Median contract rent - Upper quartile ($)
Median gross rent ($)
Urban houses (%)
Rural houses (%)
Houses occupied (%)
Houses occupied (% change since 2000)
Houses owner occupied (%)
Houses owner occupied (% change since 2000)
Houses renter occupied (%)
Houses renter occupied (% change since 2000)
Vacant housing units - For rent (%)
Vacant housing units - For rent (% change since 2000)
Vacant housing units - For sale only (%)
Vacant housing units - For sale only (% change since 2000)
Vacant housing units - Rented or sold, not occupied (%)
Vacant housing units - Rented or sold, not occupied (% change since 2000)
Vacant housing units - For seasonal, recreational, or occasional use (%)
Vacant housing units - For seasonal, recreational, or occasional use (% change since 2000)
Vacant housing units - For migrant workers (%)
Vacant housing units - For migrant workers (% change since 2000)
Vacant housing units - Other vacant (%)
Vacant housing units - Other vacant (% change since 2000)
Median monthly housing costs ($)
Median household income for houses/condos with a mortgage ($)
Median household income for houses/condos without a mortgage ($)
Median household income ($)
Median household income ($) - White
Median household income ($) - Black or African American
Median household income ($) - Asian
Median household income ($) - Hispanic or Latino
Median household income ($) - American Indian and Alaska Native
Median household income ($) - Multirace
Median household income ($) - Other Race
Mortgage status - with mortgage (%)
Mortgage status - with second mortgage (%)
Mortgage status - with home equity loan (%)
Mortgage status - with both second mortgage and home equity loan (%)
Mortgage status - without a mortgage (%)
Median year house/condo built
Median year apartment built
Household type by relationship - Male householder living alone (%)
Household type by relationship - Male householder not living alone (%)
Household type by relationship - Female householder living alone (%)
Household type by relationship - Female householder not living alone (%)
Household type by relationship - Opposite-Sex spouse (%)
Household type by relationship - Same-Sex spouse (%)
Household type by relationship - Opposite-Sex unmarried partner (%)
Household type by relationship - Same-Sex unmarried partner (%)
Household type by relationship - In group quarters (%)
Size of family households - 2-person household (%)
Size of family households - 3-person household (%)
Size of family households - 4-person household (%)
Size of family households - 5-person household (%)
Size of family households - 6-person household (%)
Size of family households - 7-or-more-person household (%)
Size of nonfamily households - 1-person household (%)
Size of nonfamily households - 2-person household (%)
Size of nonfamily households - 3-person household (%)
Size of nonfamily households - 4-person household (%)
Size of nonfamily households - 5-person household (%)
Size of nonfamily households - 6-person household (%)
Size of nonfamily households - 7-or-moreperson household (%)
Year house built - Built 2010 or later (%)
Year house built - Built 2000 to 2009 (%)
Year house built - Built 1990 to 1999 (%)
Year house built - Built 1980 to 1989 (%)
Year house built - Built 1970 to 1979 (%)
Year house built - Built 1960 to 1969 (%)
Year house built - Built 1950 to 1959 (%)
Year house built - Built 1940 to 1949 (%)
Year house built - Built 1939 or earlier (%)
Median number of rooms in houses and condos
Median number of rooms in apartments
Median number of bedrooms in owner occupied houses
Mean number of bedrooms in owner occupied houses
Median number of bedrooms in renter occupied houses
Mean number of bedrooms in renter occupied houses
Median number of vehichles in owner occupied houses
Mean number of vehichles in owner occupied houses
Median number of vehichles in renter occupied houses
Mean number of vehichles in renter occupied houses
Rooms in owner-occupied houses - 1 room (%)
Rooms in owner-occupied houses - 2 rooms (%)
Rooms in owner-occupied houses - 3 rooms (%)
Rooms in owner-occupied houses - 4 rooms (%)
Rooms in owner-occupied houses - 5 rooms (%)
Rooms in owner-occupied houses - 6 rooms (%)
Rooms in owner-occupied houses - 7 rooms (%)
Rooms in owner-occupied houses - 8 rooms (%)
Rooms in owner-occupied houses - 9+ rooms (%)
Rooms in renter-occupied houses - 1 room (%)
Rooms in renter-occupied houses - 2 rooms (%)
Rooms in renter-occupied houses - 3 rooms (%)
Rooms in renter-occupied houses - 4 rooms (%)
Rooms in renter-occupied houses - 5 rooms (%)
Rooms in renter-occupied houses - 6 rooms (%)
Rooms in renter-occupied houses - 7 rooms (%)
Rooms in renter-occupied houses - 8 rooms (%)
Rooms in renter-occupied houses - 9+ rooms (%)
Bedrooms in owner-occupied houses - no bedrooms (%)
Bedrooms in owner-occupied houses - 1 bedroom (%)
Bedrooms in owner-occupied houses - 2 bedrooms (%)
Bedrooms in owner-occupied houses - 3 bedrooms (%)
Bedrooms in owner-occupied houses - 4 bedrooms (%)
Bedrooms in owner-occupied houses - 5+ bedrooms (%)
Bedrooms in renter-occupied houses - no bedrooms (%)
Bedrooms in renter-occupied houses - 1 bedroom (%)
Bedrooms in renter-occupied houses - 2 bedrooms (%)
Bedrooms in renter-occupied houses - 3 bedrooms (%)
Bedrooms in renter-occupied houses - 4 bedrooms (%)
Bedrooms in renter-occupied houses - 5+ bedrooms (%)
Vehicles available in owner-occupied houses - no vehicle available (%)
Vehicles available in owner-occupied houses - 1 vehicle available(%)
Vehicles available in owner-occupied houses - 2 Vehicles available (%)
Vehicles available in owner-occupied houses - 3 Vehicles available (%)
Vehicles available in owner-occupied houses - 4 Vehicles available (%)
Vehicles available in owner-occupied houses - 5+ Vehicles available (%)
Vehicles available in renter-occupied houses - no vehicle available (%)
Vehicles available in renter-occupied houses - 1 vehicle available (%)
Vehicles available in renter-occupied houses - 2 Vehicles available (%)
Vehicles available in renter-occupied houses - 3 Vehicles available (%)
Vehicles available in renter-occupied houses - 4 Vehicles available (%)
Vehicles available in renter-occupied houses - 5+ Vehicles available (%)
Housing units in structures - 1, detached (%)
Housing units in structures - 1, attached (%)
Housing units in structures - 2 (%)
Housing units in structures - 3 or 4 (%)
Housing units in structures - 5 to 9 (%)
Housing units in structures - 10 to 19 (%)
Housing units in structures - 20 to 49 (%)
Housing units in structures - 50 or more (%)
Housing units in structures - Mobile home (%)
Housing units in structures - Boat, RV, van, etc. (%)
Housing units in structures - Owners - 1, detached (%)
Housing units in structures - Owners - 1, attached (%)
Housing units in structures - Owners - 2 (%)
Housing units in structures - Owners - 3 or 4 (%)
Housing units in structures - Owners - 5 to 9 (%)
Housing units in structures - Owners - 10 to 19 (%)
Housing units in structures - Owners - 20 to 49 (%)
Housing units in structures - Owners - 50 or more (%)
Housing units in structures - Owners - Mobile home (%)
Housing units in structures - Owners - Boat, RV, van, etc. (%)
Housing units in structures - Renters - 1, detached (%)
Housing units in structures - Renters - 1, attached (%)
Housing units in structures - Renters - 2 (%)
Housing units in structures - Renters - 3 or 4 (%)
Housing units in structures - Renters - 5 to 9 (%)
Housing units in structures - Renters - 10 to 19 (%)
Housing units in structures - Renters - 20 to 49 (%)
Housing units in structures - Renters - 50 or more (%)
Housing units in structures - Renters - Mobile home (%)
Housing units in structures - Renters - Boat, RV, van, etc. (%)
House/condo owner moved in on average (years ago)
Renter moved in on average (years ago)
Year householder moved into unit - Moved in 1999 to March 2000 (%)
Year householder moved into unit - Moved in 1999 to March 2000 (%) - White
Year householder moved into unit - Moved in 1999 to March 2000 (%) - Black or African American
Year householder moved into unit - Moved in 1999 to March 2000 (%) - Asian
Year householder moved into unit - Moved in 1999 to March 2000 (%) - Hispanic or Latino
Year householder moved into unit - Moved in 1999 to March 2000 (%) - American Indian and Alaska Native
Year householder moved into unit - Moved in 1999 to March 2000 (%) - Multirace
Year householder moved into unit - Moved in 1999 to March 2000 (%) - Other Race
Year householder moved into unit - Moved in 1995 to 1998 (%)
Year householder moved into unit - Moved in 1995 to 1998 (%) - White
Year householder moved into unit - Moved in 1995 to 1998 (%) - Black or African American
Year householder moved into unit - Moved in 1995 to 1998 (%) - Asian
Year householder moved into unit - Moved in 1995 to 1998 (%) - Hispanic or Latino
Year householder moved into unit - Moved in 1995 to 1998 (%) - American Indian and Alaska Native
Year householder moved into unit - Moved in 1995 to 1998 (%) - Multirace
Year householder moved into unit - Moved in 1995 to 1998 (%) - Other Race
Year householder moved into unit - Moved in 1990 to 1994 (%)
Year householder moved into unit - Moved in 1990 to 1994 (%) - White
Year householder moved into unit - Moved in 1990 to 1994 (%) - Black or African American
Year householder moved into unit - Moved in 1990 to 1994 (%) - Asian
Year householder moved into unit - Moved in 1990 to 1994 (%) - Hispanic or Latino
Year householder moved into unit - Moved in 1990 to 1994 (%) - American Indian and Alaska Native
Year householder moved into unit - Moved in 1990 to 1994 (%) - Multirace
Year householder moved into unit - Moved in 1990 to 1994 (%) - Other Race
Year householder moved into unit - Moved in 1980 to 1989 (%)
Year householder moved into unit - Moved in 1980 to 1989 (%) - White
Year householder moved into unit - Moved in 1980 to 1989 (%) - Black or African American
Year householder moved into unit - Moved in 1980 to 1989 (%) - Asian
Year householder moved into unit - Moved in 1980 to 1989 (%) - Hispanic or Latino
Year householder moved into unit - Moved in 1980 to 1989 (%) - American Indian and Alaska Native
Year householder moved into unit - Moved in 1980 to 1989 (%) - Multirace
Year householder moved into unit - Moved in 1980 to 1989 (%) - Other Race
Year householder moved into unit - Moved in 1970 to 1979 (%)
Year householder moved into unit - Moved in 1970 to 1979 (%) - White
Year householder moved into unit - Moved in 1970 to 1979 (%) - Black or African American
Year householder moved into unit - Moved in 1970 to 1979 (%) - Asian
Year householder moved into unit - Moved in 1970 to 1979 (%) - Hispanic or Latino
Year householder moved into unit - Moved in 1970 to 1979 (%) - American Indian and Alaska Native
Year householder moved into unit - Moved in 1970 to 1979 (%) - Multirace
Year householder moved into unit - Moved in 1970 to 1979 (%) - Other Race
Year householder moved into unit - Moved in 1969 or earlier (%)
Year householder moved into unit - Moved in 1969 or earlier (%) - White
Year householder moved into unit - Moved in 1969 or earlier (%) - Black or African American
Year householder moved into unit - Moved in 1969 or earlier (%) - Asian
Year householder moved into unit - Moved in 1969 or earlier (%) - Hispanic or Latino
Year householder moved into unit - Moved in 1969 or earlier (%) - American Indian and Alaska Native
Year householder moved into unit - Moved in 1969 or earlier (%) - Multirace
Year householder moved into unit - Moved in 1969 or earlier (%) - Other Race
Housing units lacking complete plumbing facilities (%)
Housing units lacking complete kitchen facilities (%)
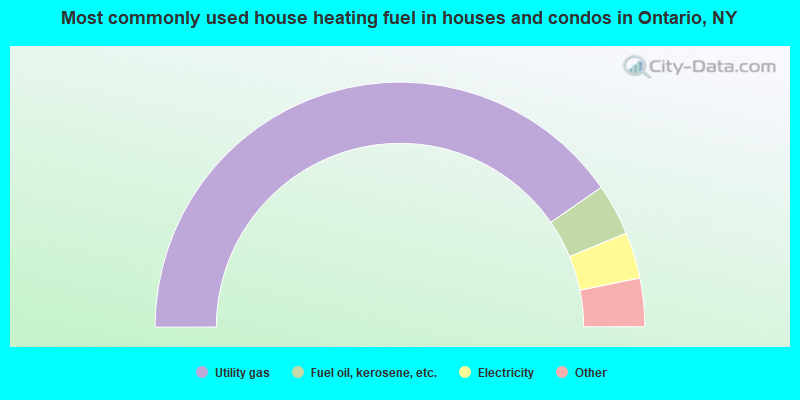
House heating fuel used in houses and condos - Utility gas (%)
House heating fuel used in houses and condos - Bottled, tank, or LP gas (%)
House heating fuel used in houses and condos - Electricity (%)
House heating fuel used in houses and condos - Fuel oil, kerosene, etc. (%)
House heating fuel used in houses and condos - Coal or coke (%)
House heating fuel used in houses and condos - Wood (%)
House heating fuel used in houses and condos - Solar energy (%)
House heating fuel used in houses and condos - Other fuel (%)
House heating fuel used in houses and condos - No fuel used (%)
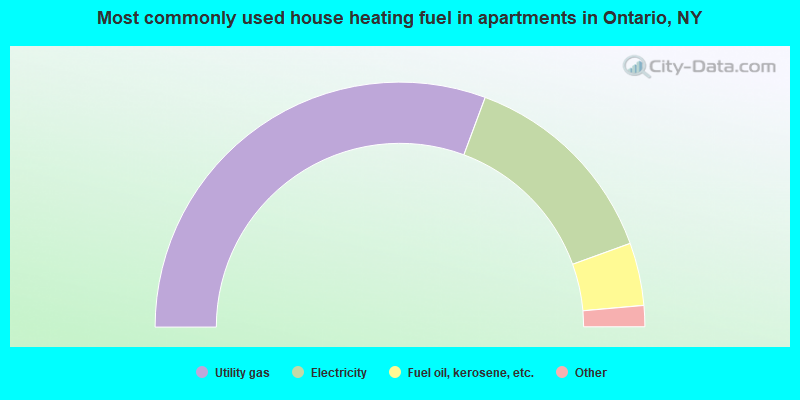
House heating fuel used in apartments - Utility gas (%)
House heating fuel used in apartments - Bottled, tank, or LP gas (%)
House heating fuel used in apartments - Electricity (%)
House heating fuel used in apartments - Fuel oil, kerosene, etc. (%)
House heating fuel used in apartments - Coal or coke (%)
House heating fuel used in apartments - Wood (%)
House heating fuel used in apartments - Solar energy (%)
House heating fuel used in apartments - Other fuel (%)
House heating fuel used in apartments - No fuel used (%)
Latest news about housing in Ontario, NY collected exclusively by city-data.com from local newspapers, TV, and radio stations
Household type by relationship:
Households: 92,382
In family households: 78,251 (18,060 male householders , 7,244 female householders )
19,384 spouses , 27,003 children (24,936 natural , 549 adopted , 1,518 stepchildren ), 1,761 grandchildren , 476 brothers or sisters , 575 parents , foster children , 607 other relatives , 2,704 non-relatives In nonfamily households: 14,131 (5,601 male householders (4,242 living alone )), 5,680 female householders (4,709 living alone )), 2,850 nonrelatives In group quarters: 1,390 (965 institutionalized population)
17,772 married couples with children. single-parent households (1,743 men , 4,208 women ).
95.8% of residents of Ontario speak English at home. of residents speak Spanish at home (76% speak English very well , 15% speak English well , 10% speak English not well ).of residents speak other Indo-European language at home (73% speak English very well , 9% speak English well , 18% speak English not well ).of residents speak Asian or Pacific Island language at home (57% speak English very well , 43% speak English not well ).
Foreign born population: 229 (2.4%)of them are naturalized citizens )
Median number of rooms in houses and condos:
Median number of rooms in apartments
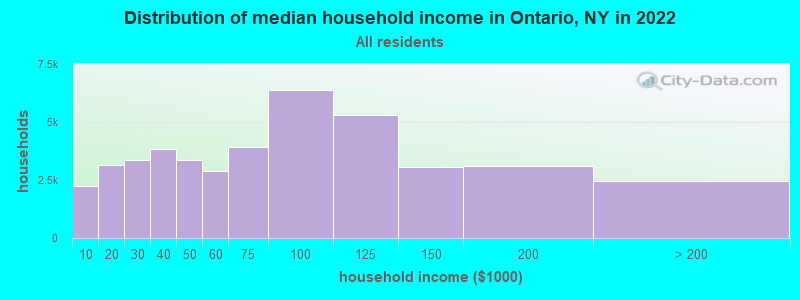
Ontario, NY household income distribution 2,255 Less than $10,0003,138 $10,000 to $19,9993,343 $20,000 to $29,9993,818 $30,000 to $39,9993,383 $40,000 to $49,9992,901 $50,000 to $59,9993,923 $60,000 to $74,9996,361 $75,000 to $99,9995,296 $100,000 to $124,9993,073 $125,000 to $149,9993,092 $150,000 to $199,9992,437 $200,000 or more
Percentage of workers working in this county: 30.5%Number of people working at home: 745 (13.4% of all workers )
Travel time to work (commute)
Less than 5 minutes: 1895 to 9 minutes: 56310 to 14 minutes: 78815 to 19 minutes: 50820 to 24 minutes: 74025 to 29 minutes: 43730 to 34 minutes: 81535 to 39 minutes: 17240 to 44 minutes: 26145 to 59 minutes: 27560 to 89 minutes: 8090 or more minutes: 61
Means of transportation to work:
Drove a car alone: 4,454 (88.6%)Carpooled: 334 (6.6%)Bus or trolley bus : 24 (0.5%)Walked: 71 (1.4%)Other means: 6 (0.1%)Worked at home: 137 (2.7%)
Year of entry for the foreign-born population in Ontario, New York
0 1995 to March 2000 29 1990 to 1994 0 1985 to 1989 9 1980 to 1984 17 1975 to 1979 6 1970 to 1974 9 1965 to 1969 115 Before 1965
First ancestries reported:
German: 2,813 (22.8%)
English: 1,775 (14.4%)
Italian: 1,623 (13.2%)
Irish: 1,546 (12.5%)
Dutch: 951 (7.7%)
Other: 766 (6.2%)
French: 610 (4.9%)
Polish: 536 (4.3%)
United States: 535 (4.3%)
Scottish: 204 (1.7%)
French Canadian: 165 (1.3%)
Swedish: 154 (1.2%)
Scotch-Irish: 145 (1.2%)
Ukrainian: 89 (0.7%)
Danish: 81 (0.7%)
Russian: 73 (0.6%)
Hungarian: 61 (0.5%)
Lithuanian: 61 (0.5%)
Welsh: 55 (0.4%)
Greek: 34 (0.3%)
Norwegian: 17 (0.1%)
Slovak: 17 (0.1%)
Swiss: 12 (0.10%)
Czech: 9 (0.07%)
Arab: 6 (0.05%) Most common places of birth for foreign-born residents (%): Canada Ontario:
38.9% (72)New York:
1.4% (54,876)
Other Western Europe Ontario:
10.3% (19)New York:
0.3% (10,672)
Austria Ontario:
9.2% (17)New York:
0.3% (11,299)
Armenia Ontario:
7.6% (14)New York:
0.1% (1,981)
Poland Ontario:
5.4% (10)New York:
2.4% (93,187)
Other Eastern Europe Ontario:
5.4% (10)New York:
1.4% (53,825)
United Kingdom Ontario:
4.9% (9)New York:
1.6% (62,237)
Germany Ontario:
4.9% (9)New York:
1.8% (69,327)
Netherlands Ontario:
4.9% (9)New York:
0.2% (6,545)
Brazil Ontario:
4.9% (9)New York:
0.6% (22,265)
Spain Ontario:
3.8% (7)New York:
0.3% (11,866)
Place of birth for U.S.-born residents:
This state: 8,477Other state: 1,099Northeast: 465Midwest: 268South: 256West: 110 64% of Ontario residents lived in the same house 5 years ago.
Out of people who lived in different houses, 45% lived in this county.
Out of people who lived in different counties, 93% lived in New York.
Education attainment for males 25 years and older:
No schooling: 23Nursery to 4th grade: 05th and 6th grade: 137th and 8th grade: 1079th grade: 5210th grade: 8411th grade: 7612th grade, no diploma: 109High school graduate (or equivalency): 983Less than 1 year of college: 252Some college more than 1 year, no degree: 387Associate degree: 387Bachelor's degree: 480Master's degree: 152Professional school degree: 21Doctorate degree: 10
Education attainment for females 25 years and older:
No schooling: 20Nursery to 4th grade: 05th and 6th grade: 07th and 8th grade: 899th grade: 5610th grade: 7011th grade: 4612th grade, no diploma: 59High school graduate (or equivalency): 1,148Less than 1 year of college: 297Some college more than 1 year, no degree: 385Associate degree: 405Bachelor's degree: 406Master's degree: 217Professional school degree: 46Doctorate degree: 6
Housing units in structures:
One, detached: 2,848One, attached: 61Two: 1113 or 4: 1225 to 9: 12310 to 19: 4620 to 49: 4550 or more: 23Mobile homes: 435Median worth of mobile homes: $30,590
Housing units lacking complete plumbing facilities: 0.7%Housing units lacking complete kitchen facilities: 0.2%Private vs. public school enrollment:
Students in private schools in grades 1 to 8 (elementary and middle school): 100 Students in private schools in grades 9 to 12 (high school): 7 Students in private undergraduate colleges: 71