Oceanside, NY (New York) Houses and Residents
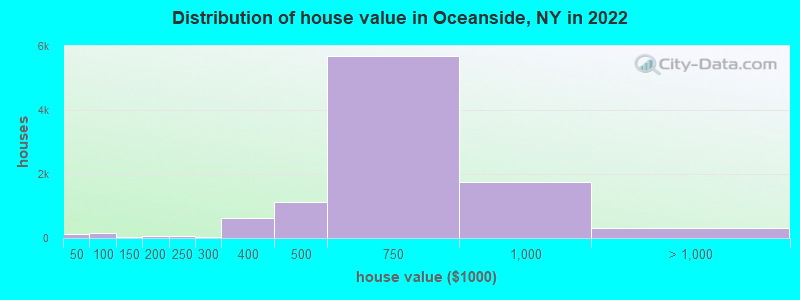
Estimated median house or condo value in 2022: $627,850 (it was $238,400 in 2000 )
Oceanside:
$627,850New York:
$400,400
Lower value quartile - upper value quartile: $520,447 - $746,548Mean price in 2022: Detached houses: $738,256 Here:
$738,256State:
$476,719
Townhouses or other attached units: $537,768 Here:
$537,768State:
$699,270
In 2-unit structures: $492,737 Here:
$492,737State:
$713,077
In 3-to-4-unit structures: $453,227 Here:
$453,227State:
$764,568
In 5-or-more-unit structures: $334,789 Here:
$334,789State:
$912,009
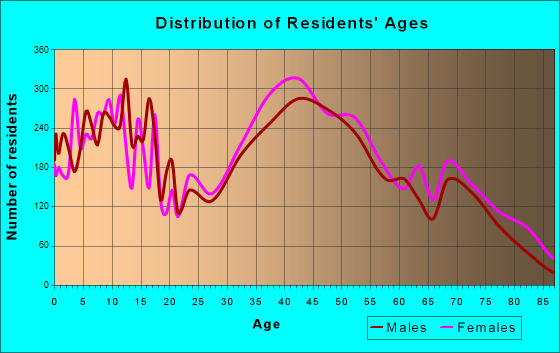
Total population: 32,109 (All urban)
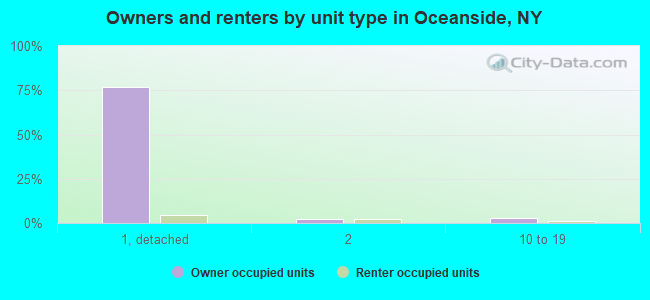
Houses: 11,199 (10,862 occupied: 9,964 owner occupied, 879 renter occupied )
% of renters here:
8%State:
46%
Housing density: 2,232 houses/condos per square mile
Median price asked for vacant for-sale houses and condos in 2022: $586,611.
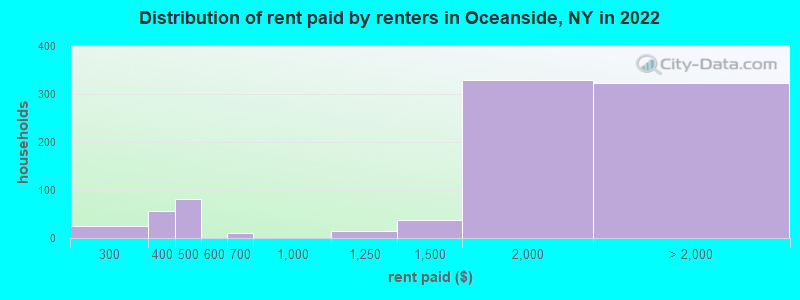
Median contract rent in 2022: $1,622
Median rent asked for vacant for-rent units in 2022: $4,553
Median gross rent in Oceanside, NY in 2022: $1,932
Housing units in Oceanside with a mortgage: 6,154 (924 second mortgage, 16 home equity loan, 868 both second mortgage and home equity loan )Houses without a mortgage: 199
Median household income for houses/condos with a mortgage: $169,511
Median household income for apartments without a mortgage: $103,789
Median monthly housing costs: $2,438
Data:
Median house or condo value ($)
Median house or condo value ($ change since 2000)
Median house or condo value ($) - White
Median house or condo value ($) - Black or African American
Median house or condo value ($) - Asian
Median house or condo value ($) - Hispanic or Latino
Median house or condo value ($) - American Indian and Alaska Native
Median house or condo value ($) - Multirace
Median house or condo value ($) - Other Race
Median price asked for mobile homes ($)
Household density (households per square mile)
Mean house or condo value by units in structure - 1, detached ($)
Mean house or condo value by units in structure - 1, attached ($)
Mean house or condo value by units in structure - 2 ($)
Mean house or condo value by units in structure by units in structure - 3 or 4 ($)
Mean house or condo value by units in structure - 5 or more ($)
Mean house or condo value by units in structure - Boat, RV, van, etc. ($)
Mean house or condo value by units in structure - Mobile home ($)
Median contract rent ($)
Median contract rent - Lower quartile ($)
Median contract rent - Upper quartile ($)
Median gross rent ($)
Urban houses (%)
Rural houses (%)
Houses occupied (%)
Houses occupied (% change since 2000)
Houses owner occupied (%)
Houses owner occupied (% change since 2000)
Houses renter occupied (%)
Houses renter occupied (% change since 2000)
Vacant housing units - For rent (%)
Vacant housing units - For rent (% change since 2000)
Vacant housing units - For sale only (%)
Vacant housing units - For sale only (% change since 2000)
Vacant housing units - Rented or sold, not occupied (%)
Vacant housing units - Rented or sold, not occupied (% change since 2000)
Vacant housing units - For seasonal, recreational, or occasional use (%)
Vacant housing units - For seasonal, recreational, or occasional use (% change since 2000)
Vacant housing units - For migrant workers (%)
Vacant housing units - For migrant workers (% change since 2000)
Vacant housing units - Other vacant (%)
Vacant housing units - Other vacant (% change since 2000)
Median monthly housing costs ($)
Median household income for houses/condos with a mortgage ($)
Median household income for houses/condos without a mortgage ($)
Median household income ($)
Median household income ($) - White
Median household income ($) - Black or African American
Median household income ($) - Asian
Median household income ($) - Hispanic or Latino
Median household income ($) - American Indian and Alaska Native
Median household income ($) - Multirace
Median household income ($) - Other Race
Mortgage status - with mortgage (%)
Mortgage status - with second mortgage (%)
Mortgage status - with home equity loan (%)
Mortgage status - with both second mortgage and home equity loan (%)
Mortgage status - without a mortgage (%)
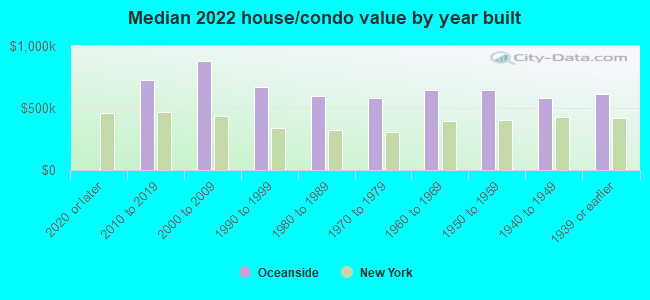
Median year house/condo built
Median year apartment built
Household type by relationship - Male householder living alone (%)
Household type by relationship - Male householder not living alone (%)
Household type by relationship - Female householder living alone (%)
Household type by relationship - Female householder not living alone (%)
Household type by relationship - Opposite-Sex spouse (%)
Household type by relationship - Same-Sex spouse (%)
Household type by relationship - Opposite-Sex unmarried partner (%)
Household type by relationship - Same-Sex unmarried partner (%)
Household type by relationship - In group quarters (%)
Size of family households - 2-person household (%)
Size of family households - 3-person household (%)
Size of family households - 4-person household (%)
Size of family households - 5-person household (%)
Size of family households - 6-person household (%)
Size of family households - 7-or-more-person household (%)
Size of nonfamily households - 1-person household (%)
Size of nonfamily households - 2-person household (%)
Size of nonfamily households - 3-person household (%)
Size of nonfamily households - 4-person household (%)
Size of nonfamily households - 5-person household (%)
Size of nonfamily households - 6-person household (%)
Size of nonfamily households - 7-or-moreperson household (%)
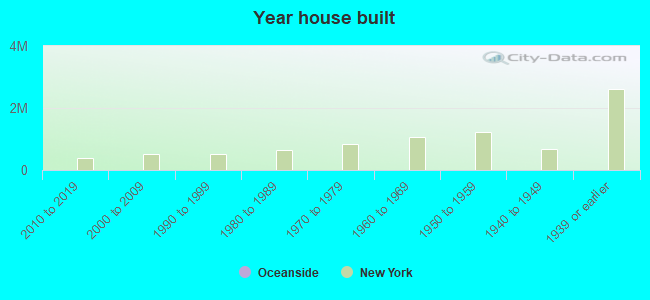
Year house built - Built 2010 or later (%)
Year house built - Built 2000 to 2009 (%)
Year house built - Built 1990 to 1999 (%)
Year house built - Built 1980 to 1989 (%)
Year house built - Built 1970 to 1979 (%)
Year house built - Built 1960 to 1969 (%)
Year house built - Built 1950 to 1959 (%)
Year house built - Built 1940 to 1949 (%)
Year house built - Built 1939 or earlier (%)
Median number of rooms in houses and condos
Median number of rooms in apartments
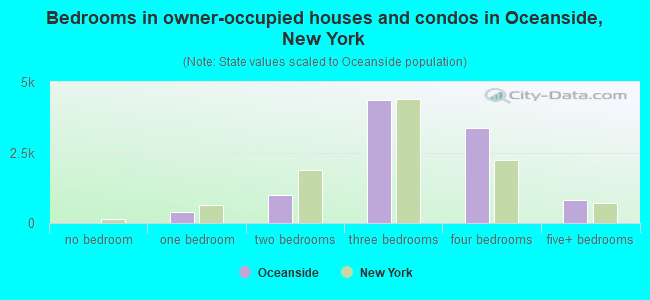
Median number of bedrooms in owner occupied houses
Mean number of bedrooms in owner occupied houses
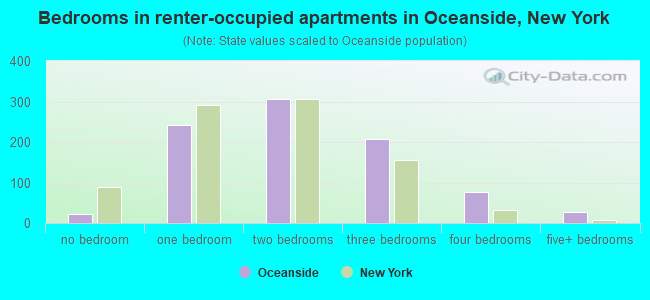
Median number of bedrooms in renter occupied houses
Mean number of bedrooms in renter occupied houses
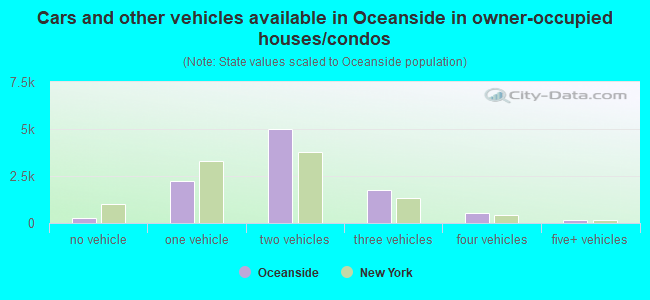
Median number of vehichles in owner occupied houses
Mean number of vehichles in owner occupied houses
Median number of vehichles in renter occupied houses
Mean number of vehichles in renter occupied houses
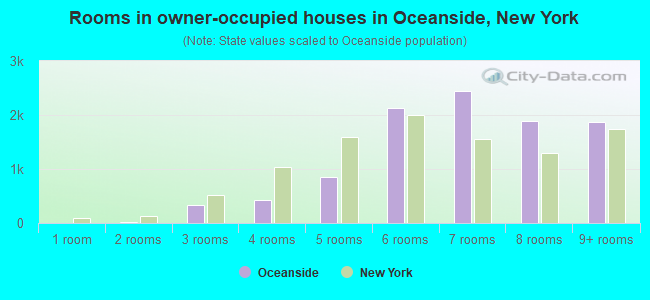
Rooms in owner-occupied houses - 1 room (%)
Rooms in owner-occupied houses - 2 rooms (%)
Rooms in owner-occupied houses - 3 rooms (%)
Rooms in owner-occupied houses - 4 rooms (%)
Rooms in owner-occupied houses - 5 rooms (%)
Rooms in owner-occupied houses - 6 rooms (%)
Rooms in owner-occupied houses - 7 rooms (%)
Rooms in owner-occupied houses - 8 rooms (%)
Rooms in owner-occupied houses - 9+ rooms (%)
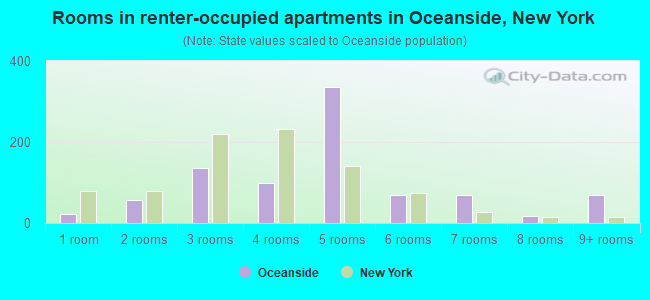
Rooms in renter-occupied houses - 1 room (%)
Rooms in renter-occupied houses - 2 rooms (%)
Rooms in renter-occupied houses - 3 rooms (%)
Rooms in renter-occupied houses - 4 rooms (%)
Rooms in renter-occupied houses - 5 rooms (%)
Rooms in renter-occupied houses - 6 rooms (%)
Rooms in renter-occupied houses - 7 rooms (%)
Rooms in renter-occupied houses - 8 rooms (%)
Rooms in renter-occupied houses - 9+ rooms (%)
Bedrooms in owner-occupied houses - no bedrooms (%)
Bedrooms in owner-occupied houses - 1 bedroom (%)
Bedrooms in owner-occupied houses - 2 bedrooms (%)
Bedrooms in owner-occupied houses - 3 bedrooms (%)
Bedrooms in owner-occupied houses - 4 bedrooms (%)
Bedrooms in owner-occupied houses - 5+ bedrooms (%)
Bedrooms in renter-occupied houses - no bedrooms (%)
Bedrooms in renter-occupied houses - 1 bedroom (%)
Bedrooms in renter-occupied houses - 2 bedrooms (%)
Bedrooms in renter-occupied houses - 3 bedrooms (%)
Bedrooms in renter-occupied houses - 4 bedrooms (%)
Bedrooms in renter-occupied houses - 5+ bedrooms (%)
Vehicles available in owner-occupied houses - no vehicle available (%)
Vehicles available in owner-occupied houses - 1 vehicle available(%)
Vehicles available in owner-occupied houses - 2 Vehicles available (%)
Vehicles available in owner-occupied houses - 3 Vehicles available (%)
Vehicles available in owner-occupied houses - 4 Vehicles available (%)
Vehicles available in owner-occupied houses - 5+ Vehicles available (%)
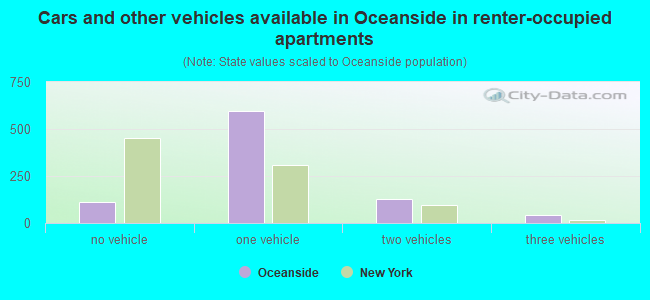
Vehicles available in renter-occupied houses - no vehicle available (%)
Vehicles available in renter-occupied houses - 1 vehicle available (%)
Vehicles available in renter-occupied houses - 2 Vehicles available (%)
Vehicles available in renter-occupied houses - 3 Vehicles available (%)
Vehicles available in renter-occupied houses - 4 Vehicles available (%)
Vehicles available in renter-occupied houses - 5+ Vehicles available (%)
Housing units in structures - 1, detached (%)
Housing units in structures - 1, attached (%)
Housing units in structures - 2 (%)
Housing units in structures - 3 or 4 (%)
Housing units in structures - 5 to 9 (%)
Housing units in structures - 10 to 19 (%)
Housing units in structures - 20 to 49 (%)
Housing units in structures - 50 or more (%)
Housing units in structures - Mobile home (%)
Housing units in structures - Boat, RV, van, etc. (%)
Housing units in structures - Owners - 1, detached (%)
Housing units in structures - Owners - 1, attached (%)
Housing units in structures - Owners - 2 (%)
Housing units in structures - Owners - 3 or 4 (%)
Housing units in structures - Owners - 5 to 9 (%)
Housing units in structures - Owners - 10 to 19 (%)
Housing units in structures - Owners - 20 to 49 (%)
Housing units in structures - Owners - 50 or more (%)
Housing units in structures - Owners - Mobile home (%)
Housing units in structures - Owners - Boat, RV, van, etc. (%)
Housing units in structures - Renters - 1, detached (%)
Housing units in structures - Renters - 1, attached (%)
Housing units in structures - Renters - 2 (%)
Housing units in structures - Renters - 3 or 4 (%)
Housing units in structures - Renters - 5 to 9 (%)
Housing units in structures - Renters - 10 to 19 (%)
Housing units in structures - Renters - 20 to 49 (%)
Housing units in structures - Renters - 50 or more (%)
Housing units in structures - Renters - Mobile home (%)
Housing units in structures - Renters - Boat, RV, van, etc. (%)
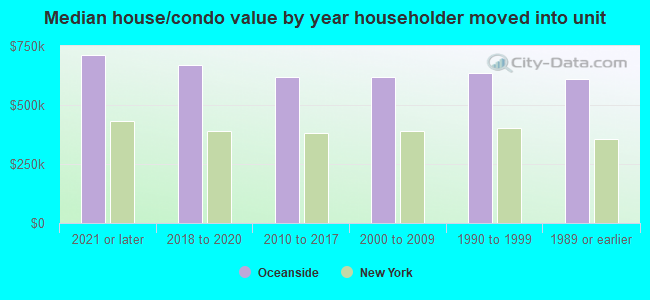
House/condo owner moved in on average (years ago)
Renter moved in on average (years ago)
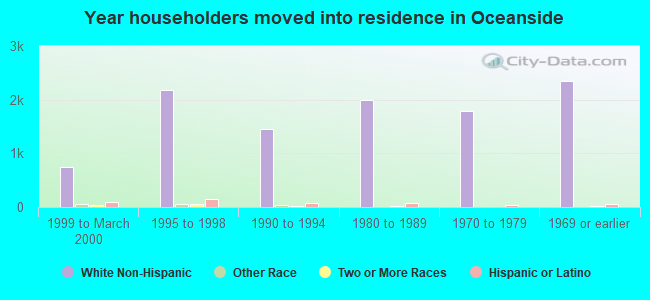
Year householder moved into unit - Moved in 1999 to March 2000 (%)
Year householder moved into unit - Moved in 1999 to March 2000 (%) - White
Year householder moved into unit - Moved in 1999 to March 2000 (%) - Black or African American
Year householder moved into unit - Moved in 1999 to March 2000 (%) - Asian
Year householder moved into unit - Moved in 1999 to March 2000 (%) - Hispanic or Latino
Year householder moved into unit - Moved in 1999 to March 2000 (%) - American Indian and Alaska Native
Year householder moved into unit - Moved in 1999 to March 2000 (%) - Multirace
Year householder moved into unit - Moved in 1999 to March 2000 (%) - Other Race
Year householder moved into unit - Moved in 1995 to 1998 (%)
Year householder moved into unit - Moved in 1995 to 1998 (%) - White
Year householder moved into unit - Moved in 1995 to 1998 (%) - Black or African American
Year householder moved into unit - Moved in 1995 to 1998 (%) - Asian
Year householder moved into unit - Moved in 1995 to 1998 (%) - Hispanic or Latino
Year householder moved into unit - Moved in 1995 to 1998 (%) - American Indian and Alaska Native
Year householder moved into unit - Moved in 1995 to 1998 (%) - Multirace
Year householder moved into unit - Moved in 1995 to 1998 (%) - Other Race
Year householder moved into unit - Moved in 1990 to 1994 (%)
Year householder moved into unit - Moved in 1990 to 1994 (%) - White
Year householder moved into unit - Moved in 1990 to 1994 (%) - Black or African American
Year householder moved into unit - Moved in 1990 to 1994 (%) - Asian
Year householder moved into unit - Moved in 1990 to 1994 (%) - Hispanic or Latino
Year householder moved into unit - Moved in 1990 to 1994 (%) - American Indian and Alaska Native
Year householder moved into unit - Moved in 1990 to 1994 (%) - Multirace
Year householder moved into unit - Moved in 1990 to 1994 (%) - Other Race
Year householder moved into unit - Moved in 1980 to 1989 (%)
Year householder moved into unit - Moved in 1980 to 1989 (%) - White
Year householder moved into unit - Moved in 1980 to 1989 (%) - Black or African American
Year householder moved into unit - Moved in 1980 to 1989 (%) - Asian
Year householder moved into unit - Moved in 1980 to 1989 (%) - Hispanic or Latino
Year householder moved into unit - Moved in 1980 to 1989 (%) - American Indian and Alaska Native
Year householder moved into unit - Moved in 1980 to 1989 (%) - Multirace
Year householder moved into unit - Moved in 1980 to 1989 (%) - Other Race
Year householder moved into unit - Moved in 1970 to 1979 (%)
Year householder moved into unit - Moved in 1970 to 1979 (%) - White
Year householder moved into unit - Moved in 1970 to 1979 (%) - Black or African American
Year householder moved into unit - Moved in 1970 to 1979 (%) - Asian
Year householder moved into unit - Moved in 1970 to 1979 (%) - Hispanic or Latino
Year householder moved into unit - Moved in 1970 to 1979 (%) - American Indian and Alaska Native
Year householder moved into unit - Moved in 1970 to 1979 (%) - Multirace
Year householder moved into unit - Moved in 1970 to 1979 (%) - Other Race
Year householder moved into unit - Moved in 1969 or earlier (%)
Year householder moved into unit - Moved in 1969 or earlier (%) - White
Year householder moved into unit - Moved in 1969 or earlier (%) - Black or African American
Year householder moved into unit - Moved in 1969 or earlier (%) - Asian
Year householder moved into unit - Moved in 1969 or earlier (%) - Hispanic or Latino
Year householder moved into unit - Moved in 1969 or earlier (%) - American Indian and Alaska Native
Year householder moved into unit - Moved in 1969 or earlier (%) - Multirace
Year householder moved into unit - Moved in 1969 or earlier (%) - Other Race
Housing units lacking complete plumbing facilities (%)
Housing units lacking complete kitchen facilities (%)
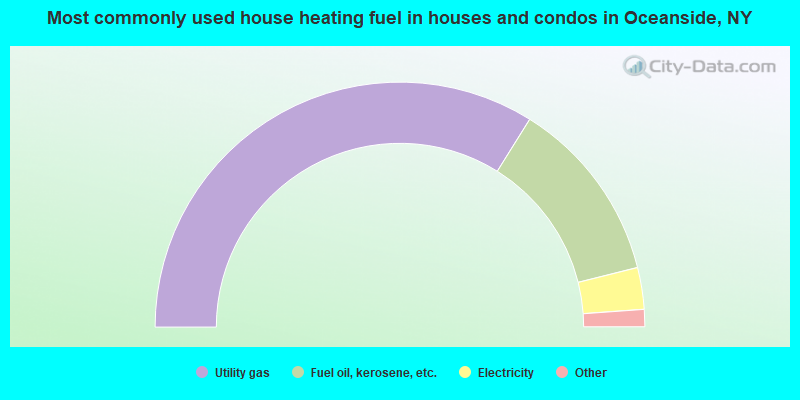
House heating fuel used in houses and condos - Utility gas (%)
House heating fuel used in houses and condos - Bottled, tank, or LP gas (%)
House heating fuel used in houses and condos - Electricity (%)
House heating fuel used in houses and condos - Fuel oil, kerosene, etc. (%)
House heating fuel used in houses and condos - Coal or coke (%)
House heating fuel used in houses and condos - Wood (%)
House heating fuel used in houses and condos - Solar energy (%)
House heating fuel used in houses and condos - Other fuel (%)
House heating fuel used in houses and condos - No fuel used (%)
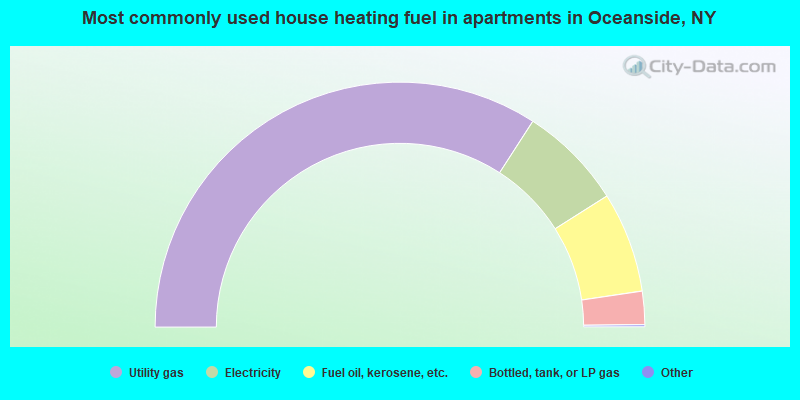
House heating fuel used in apartments - Utility gas (%)
House heating fuel used in apartments - Bottled, tank, or LP gas (%)
House heating fuel used in apartments - Electricity (%)
House heating fuel used in apartments - Fuel oil, kerosene, etc. (%)
House heating fuel used in apartments - Coal or coke (%)
House heating fuel used in apartments - Wood (%)
House heating fuel used in apartments - Solar energy (%)
House heating fuel used in apartments - Other fuel (%)
House heating fuel used in apartments - No fuel used (%)
Latest news about housing in Oceanside, NY collected exclusively by city-data.com from local newspapers, TV, and radio stations
Median year house/condo built: 1957Median year apartment built: 1960Household type by relationship:
Households: 31,364
Male householders: 5,151 (619 living alone ), Female householders: 5,616 (1,332 living alone )7,450 spouses (7,382 opposite-sex spouses ), 492 unmarried partners , (492 opposite-sex unmarried partners ), 10,197 children (9,707 natural , 189 adopted , 300 stepchildren ), 392 grandchildren , 196 brothers or sisters , 587 parents , 148 foster children , 556 other relatives , 415 non-relatives In group quarters: 158
Size of family households: 3,248 2-persons , 1,985 3-persons , 2,220 4-persons , 663 5-persons , 251 6-persons , 144 7-or-more-persons .
Size of nonfamily households: 2,035 1-person , 246 2-persons , 7 3-persons , 18 4-persons , 16 5-persons .
5,060 married couples with children. single-parent households (171 men , 403 women ).
82.1% of residents of Oceanside speak English at home. of residents speak Spanish at home (62% speak English very well , 25% speak English well , 11% speak English not well , 2% don't speak English at all ).of residents speak other Indo-European language at home (75% speak English very well , 18% speak English well , 6% speak English not well ).of residents speak Asian or Pacific Island language at home (47% speak English very well , 22% speak English well , 31% speak English not well ).of residents speak other language at home (84% speak English very well , 14% speak English well , 2% speak English not well ).
Foreign born population: 4,702 (15.0%)of them are naturalized citizens )
Median number of rooms in houses and condos:
Median number of rooms in apartments
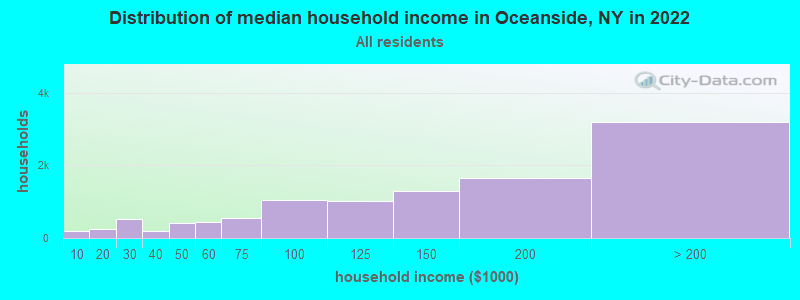
Oceanside, NY household income distribution 197 Less than $10,000260 $10,000 to $19,999529 $20,000 to $29,999200 $30,000 to $39,999420 $40,000 to $49,999450 $50,000 to $59,999552 $60,000 to $74,9991,060 $75,000 to $99,9991,020 $100,000 to $124,9991,284 $125,000 to $149,9991,659 $150,000 to $199,9993,199 $200,000 or more
Home value of owner - occupied houses in 2022 in Oceanside, NY 56 Less than $10,00017 $30,000 to $34,99911 $35,000 to $39,99925 $40,000 to $49,99943 $50,000 to $59,99927 $60,000 to $69,99937 $70,000 to $79,9998 $90,000 to $99,99917 $125,000 to $149,99953 $175,000 to $199,99951 $200,000 to $249,99946 $250,000 to $299,999635 $300,000 to $399,9991,117 $400,000 to $499,9995,682 $500,000 to $749,9991,761 $750,000 to $999,999121 $1,000,000 to $1,499,99933 $1,500,000 to $1,999,999173 $2,000,000 or moreRent paid by renters in 2022 in Oceanside, NY 15 $200 to $2498 $250 to $29944 $300 to $34913 $350 to $3997 $400 to $44973 $450 to $49910 $650 to $69913 $1,000 to $1,24938 $1,250 to $1,499329 $1,500 to $1,99986 $2,000 to $2,49938 $2,500 to $2,99920 $3,000 to $3,49914 $3,500 or more162 No cash rent
Percentage of workers working in this county: 69.1%Number of people working at home: 2,490 (15.3% of all workers )
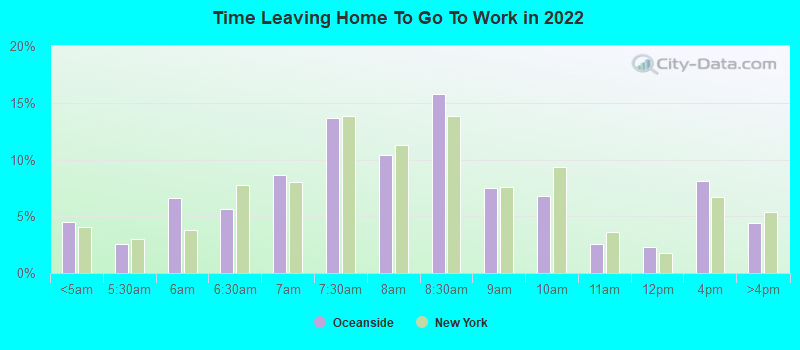
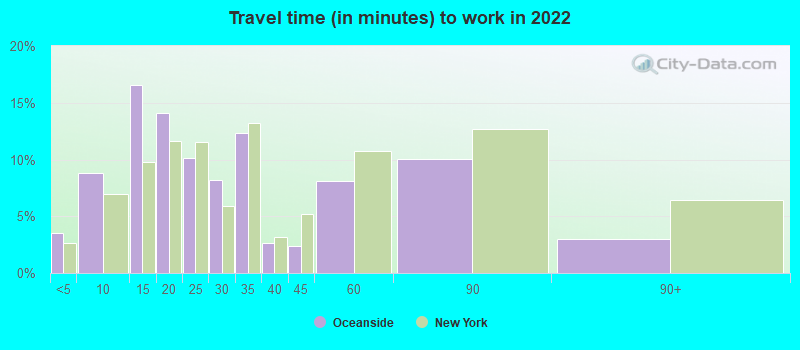
Travel time to work (commute)
Less than 5 minutes: 3885 to 9 minutes: 1,11210 to 14 minutes: 1,66215 to 19 minutes: 1,04520 to 24 minutes: 67225 to 29 minutes: 82730 to 34 minutes: 1,77335 to 39 minutes: 55440 to 44 minutes: 61545 to 59 minutes: 1,91660 to 89 minutes: 2,23990 or more minutes: 949
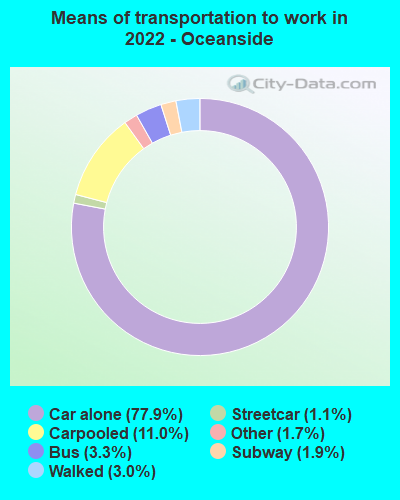
Means of transportation to work:
Drove a car alone: 8,271 (63.2%)Carpooled: 1,131 (8.6%)Bus : 343 (2.6%)Subway or elevated rail : 103 (0.8%)Long-distance train or commuter rail : 178 (1.4%)Light rail, streetcar or trolley : 6 (0.0%)Taxi: 257 (2.0%)Walked: 341 (2.6%)Worked at home: 2,490 (19.0%)
Unemployment by race in 2022
Unemployment rate for White non-Hispanic residents 4.4% Males4.0% FemalesUnemployment rate for Black residents 6.4% MalesUnemployment rate for Asian residents 8.8% FemalesUnemployment rate for other race residents 14.7% Males6.8% FemalesUnemployment rate for two or more race residents 6.1% Males8.7% FemalesUnemployment rate for Hispanic or Latino residents 8.0% Males7.4% Females
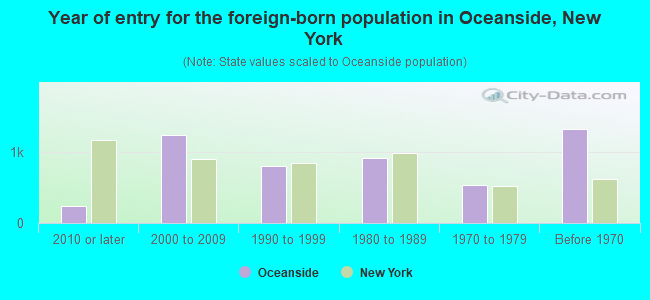
Year of entry for the foreign-born population in Oceanside, New York
232 2010 or later 1,229 2000 to 2009 801 1990 to 1999 906 1980 to 1989 534 1970 to 1979 1,317 Before 1970
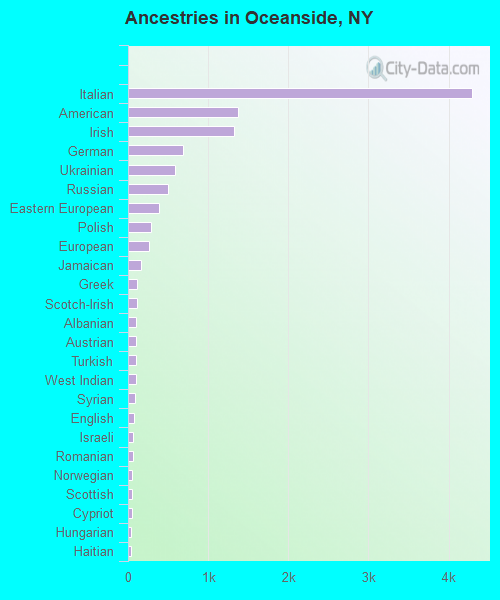
First ancestries reported:
Italian: 4,289 (29.3%)
American: 1,371 (9.4%)
Irish: 1,318 (9.0%)
German: 690 (4.7%)
Ukrainian: 581 (4.0%)
Russian: 493 (3.4%)
Eastern European: 391 (2.7%)
Polish: 285 (1.9%)
European: 261 (1.8%)
Jamaican: 158 (1.1%)
Greek: 111 (0.8%)
Scotch-Irish: 109 (0.7%)
Albanian: 106 (0.7%)
Austrian: 105 (0.7%)
Turkish: 105 (0.7%)
West Indian: 95 (0.6%)
Syrian: 90 (0.6%)
English: 77 (0.5%)
Israeli: 68 (0.5%)
Romanian: 65 (0.4%)
Norwegian: 56 (0.4%)
Scottish: 50 (0.3%)
Cypriot: 47 (0.3%)
Hungarian: 43 (0.3%)
Haitian: 41 (0.3%)
Dutch: 38 (0.3%)
Jordanian: 34 (0.2%)
Armenian: 33 (0.2%)
Slavic: 30 (0.2%)
British: 25 (0.2%)
Australian: 22 (0.2%)
Portuguese: 16 (0.1%)
Slovak: 15 (0.1%)
Moroccan: 11 (0.08%)
Slovene: 11 (0.08%)
Lebanese: 8 (0.05%)
Belgian: 8 (0.05%)
Canadian: 6 (0.04%)
French: 5 (0.03%)
Nigerian: 5 (0.03%)
Scandinavian: 4 (0.03%) Most common places of birth for foreign-born residents (%): Peru Oceanside:
11.3% (514)New York:
1.2% (54,759)
Dominican Republic Oceanside:
11.2% (508)New York:
11.1% (501,040)
Italy Oceanside:
8.6% (392)New York:
1.8% (81,374)
Ukraine Oceanside:
7.3% (334)New York:
1.7% (78,421)
Colombia Oceanside:
6.2% (281)New York:
2.5% (111,920)
Ireland Oceanside:
5.0% (226)New York:
0.6% (26,772)
Jamaica Oceanside:
4.6% (207)New York:
5.0% (227,557)
Philippines Oceanside:
3.1% (142)New York:
2.0% (91,070)
Germany Oceanside:
2.6% (116)New York:
0.9% (38,713)
India Oceanside:
2.5% (113)New York:
3.5% (158,432)
Chile Oceanside:
2.4% (108)New York:
0.3% (11,831)
Argentina Oceanside:
2.3% (103)New York:
0.5% (21,928)
Pakistan Oceanside:
2.2% (98)New York:
1.4% (62,442)
Israel Oceanside:
1.9% (87)New York:
0.7% (29,743)
Greece Oceanside:
1.8% (83)New York:
0.6% (28,604)
Poland Oceanside:
1.8% (80)New York:
1.4% (65,102)
Place of birth for U.S.-born residents:
This state: 24,858Other state: 1,285Northeast: 612Midwest: 205South: 287West: 173 94.2% of Oceanside residents lived in the same house 1 years ago.
Out of people who lived in different houses, 44.1% lived in this county.
Out of people who lived in different counties, 94.0% lived in New York.
Oceanside:
94.2%State average:
89.6%
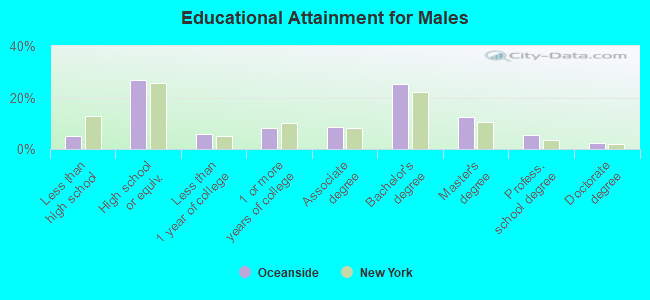
Education attainment for males 25 years and older:
No schooling: 177Nursery to 4th grade: 15th and 6th grade: 367th and 8th grade: 1059th grade: 110th grade: 1211th grade: 2312th grade, no diploma: 222High school graduate (or equivalency): 3,067Less than 1 year of college: 659Some college more than 1 year, no degree: 917Associate degree: 982Bachelor's degree: 2,896Master's degree: 1,412Professional school degree: 621Doctorate degree: 267
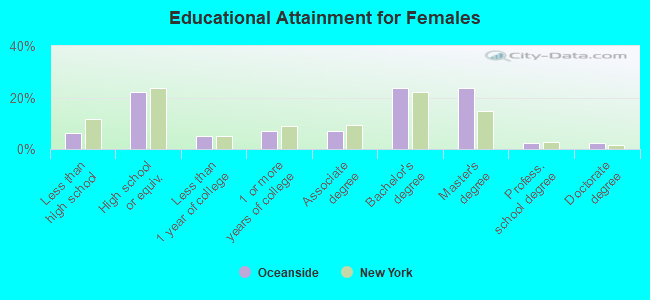
Education attainment for females 25 years and older:
No schooling: 156Nursery to 4th grade: 1185th and 6th grade: 397th and 8th grade: 889th grade: 810th grade: 2411th grade: 6612th grade, no diploma: 234High school graduate (or equivalency): 2,553Less than 1 year of college: 574Some college more than 1 year, no degree: 819Associate degree: 787Bachelor's degree: 2,707Master's degree: 2,730Professional school degree: 267Doctorate degree: 288
Housing units in structures:
One, detached: 9,551One, attached: 476Two: 5353 or 4: 1095 to 9: 14810 to 19: 17820 to 49: 9250 or more: 101Mobile homes: 6Housing units lacking complete plumbing facilities in 2022: 0.2%Housing units lacking complete kitchen facilities in 2022: 0.4%House/condo owner moved in on average 19 years ago
Renter moved in on average 10 years ago
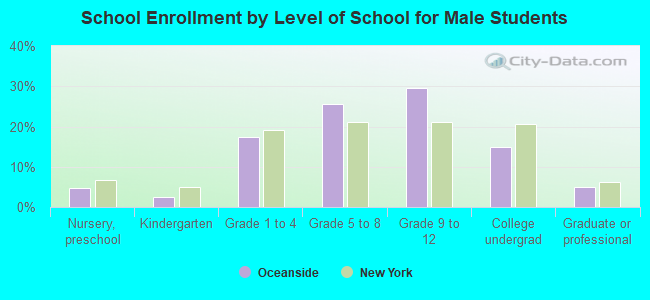
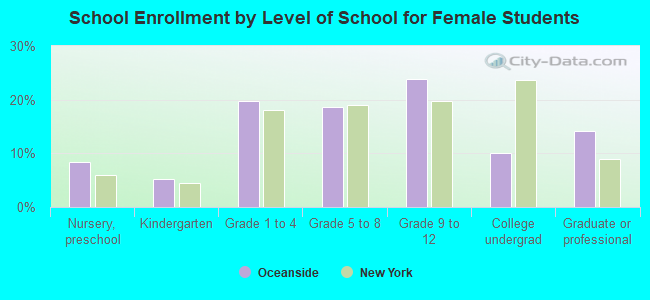
Private vs. public school enrollment:
Students in private schools in grades 1 to 8 (elementary and middle school): 150 Students in private schools in grades 9 to 12 (high school): 88 Students in private undergraduate colleges: 394