Ocean Springs, MS (Mississippi) Houses and Residents
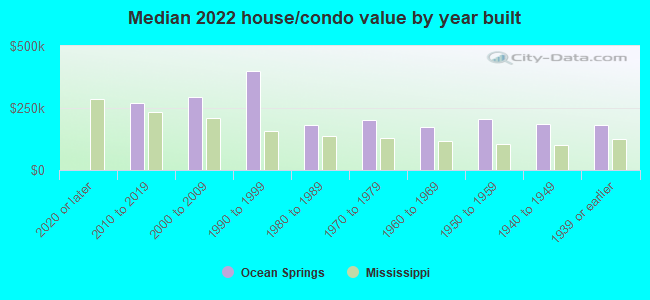
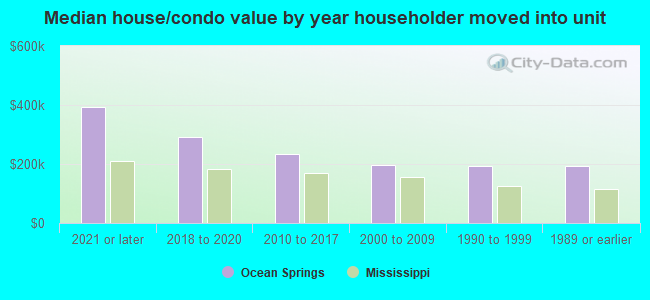
| Ocean Springs: | $229,369 |
| Mississippi: | $162,500 |
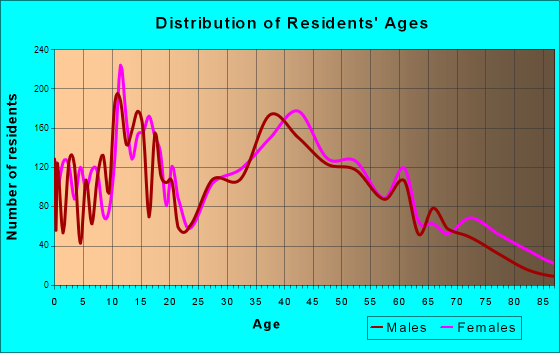
Total population: 17,530 (Urban population: 17,136, Rural population: 81 (all nonfarm))
Houses: 8,583 (8,045 occupied: 5,824 owner occupied, 2,499 renter occupied)
| % of renters here: | 30% |
| State: | 30% |
Housing density: 737 houses/condos per square mile
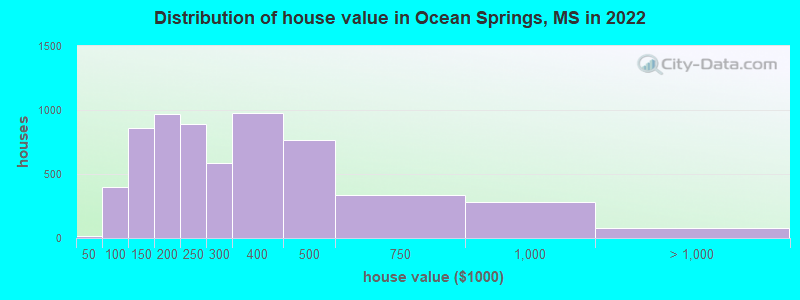
Median price asked for vacant for-sale houses and condos in 2022: $471,088.
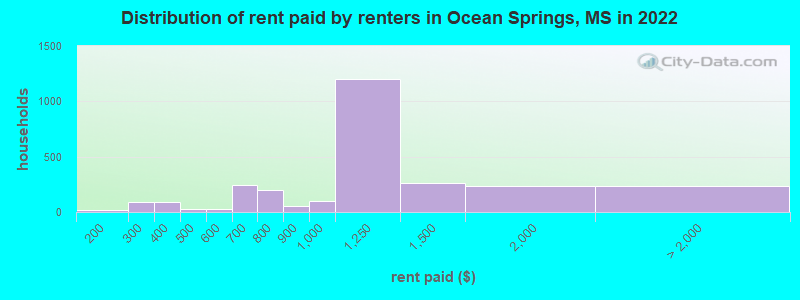
Median contract rent in 2022: $1,087 (lower quartile is $697, upper quartile is $1,406)
Median rent asked for vacant for-rent units in 2022: $3,192
Median gross rent in Ocean Springs, MS in 2022: $1,269
Housing units in Ocean Springs with a mortgage: 3,731 (245 second mortgage, 0 home equity loan, 192 both second mortgage and home equity loan)
Houses without a mortgage: 50
Median household income for houses/condos with a mortgage: $99,246
Median household income for apartments without a mortgage: $63,537
Median monthly housing costs: $1,288
Compare current foreclosures in Ocean Springs, MS:
| Photo | Address | Area | Beds / Baths | Price | Details |
|---|---|---|---|---|---|

|
#1
Suburban Dr
Ocean Springs, MS 39565
|
- sq. feet
|
- baths - beds |
$37,900
|
show details |

|
#2
Sunview Cv
Ocean Springs, MS 39565
|
1,561 sq. feet
|
2 baths - beds |
show details | |

|
#3
Fleetwood Pl
Ocean Springs, MS 39564
|
1,334 sq. feet
|
2 baths - beds |
show details | |

|
#4
Acorn Dr
Ocean Springs, MS 39565
|
1,891 sq. feet
|
2 baths - beds |
show details | |

|
#5
Florida St
Ocean Springs, MS 39565
|
2,134 sq. feet
|
3 baths - beds |
show details | |

|
#6
N 7th St
Ocean Springs, MS 39564
|
1,648 sq. feet
|
2 baths - beds |
show details | |

|
#7
Dogwood Dr
Ocean Springs, MS 39565
|
1,151 sq. feet
|
3 baths - beds |
show details | |

|
#8
Lynne Therese Cir
Ocean Springs, MS 39564
|
1,836 sq. feet
|
2 baths - beds |
show details | |

|
#9
Niagara Ave
Ocean Springs, MS 39564
|
1,066 sq. feet
|
2 baths - beds |
show details | |

|
#10
Eastland Blvd
Ocean Springs, MS 39564
|
1,070 sq. feet
|
2 baths - beds |
show details |
| Photo | Address | Area | Beds / Baths | Price | Details |
|---|---|---|---|---|---|

|
#11
W Simmons Cir
Ocean Springs, MS 39564
|
1,773 sq. feet
|
2 baths - beds |
show details | |

|
#12
Bayou Pl
Ocean Springs, MS 39564
|
1,344 sq. feet
|
3 baths - beds |
show details | |

|
#13
Woody Cir
Ocean Springs, MS 39564
|
1,572 sq. feet
|
1 baths - beds |
show details | |

|
#14
Kaiser Pl
Ocean Springs, MS 39564
|
1,312 sq. feet
|
2 baths - beds |
show details | |

|
#15
Booth Cir
Ocean Springs, MS 39564
|
1,513 sq. feet
|
2 baths - beds |
show details | |

|
#16
Chaucer Dr
Ocean Springs, MS 39564
|
1,325 sq. feet
|
2 baths - beds |
show details | |

|
#17
Sweetbriar St
Ocean Springs, MS 39564
|
1,324 sq. feet
|
2 baths - beds |
show details | |

|
#18
Ute Ct
Ocean Springs, MS 39564
|
1,347 sq. feet
|
2 baths - beds |
show details | |

|
#19
Fairley Mills Rd
Ocean Springs, MS 39565
|
1,418 sq. feet
|
2 baths - beds |
show details | |

|
#20
Ridgeland Rd
Ocean Springs, MS 39565
|
1,276 sq. feet
|
2 baths - beds |
show details |
| Photo | Address | Area | Beds / Baths | Price | Details |
|---|---|---|---|---|---|

|
#21
Hillsboro Rd
Ocean Springs, MS 39565
|
2,628 sq. feet
|
3 baths - beds |
show details | |

|
#22
Orange St
Ocean Springs, MS 39564
|
1,108 sq. feet
|
2 baths - beds |
show details | |

|
#23
Lake Dr W
Ocean Springs, MS 39565
|
3,210 sq. feet
|
4 baths - beds |
show details | |

|
#24
Rebecca Cv
Ocean Springs, MS 39564
|
1,744 sq. feet
|
2 baths - beds |
show details | |

|
#25
Guy St
Ocean Springs, MS 39564
|
1,004 sq. feet
|
1 baths - beds |
show details | |

|
#26
Swan Ln
Ocean Springs, MS 39565
|
1,700 sq. feet
|
1 baths - beds |
show details | |

|
#27
Old Kelly Rd
Ocean Springs, MS 39565
|
1,584 sq. feet
|
2 baths - beds |
show details | |

|
#28
Old Shell Landing Rd
Ocean Springs, MS 39564
|
1,806 sq. feet
|
2 baths - beds |
show details | |

|
#29
Mcgregor Rd
Ocean Springs, MS 39565
|
1,920 sq. feet
|
2 baths - beds |
show details | |

|
#30
Clamshell Ave
Ocean Springs, MS 39564
|
2,777 sq. feet
|
3 baths - beds |
show details |
| Photo | Address | Area | Beds / Baths | Price | Details |
|---|---|---|---|---|---|

|
#31
Rue Beaux Chenes
Ocean Springs, MS 39564
|
2,345 sq. feet
|
3 baths - beds |
show details | |

|
#32
Breezy Hill Ln
Ocean Springs, MS 39564
|
2,038 sq. feet
|
3 baths - beds |
show details | |

|
#33
Sweetbriar St
Ocean Springs, MS 39564
|
1,000 sq. feet
|
2 baths - beds |
show details | |

|
#34
Clark Ave
Ocean Springs, MS 39564
|
1,509 sq. feet
|
2 baths - beds |
show details | |

|
#35
Plymouth Rd
Ocean Springs, MS 39564
|
1,092 sq. feet
|
2 baths - beds |
show details | |

|
#36
Ravens Ct
Ocean Springs, MS 39564
|
2,319 sq. feet
|
3 baths - beds |
show details | |

|
#37
S 7th St
Ocean Springs, MS 39564
|
1,443 sq. feet
|
2 baths - beds |
show details | |

|
#38
Colmer Cir
Ocean Springs, MS 39564
|
1,521 sq. feet
|
2 baths - beds |
show details | |

|
#39
Popcorn Ave
Ocean Springs, MS 39565
|
1,716 sq. feet
|
2 baths - beds |
show details | |

|
#40
Bayou Landing Dr
Ocean Springs, MS 39564
|
1,336 sq. feet
|
2 baths - beds |
show details |
| Photo | Address | Area | Beds / Baths | Price | Details |
|---|---|---|---|---|---|

|
#41
N 6th St
Ocean Springs, MS 39564
|
1,334 sq. feet
|
3 baths - beds |
show details | |

|
#42
Dixie St
Ocean Springs, MS 39564
|
1,451 sq. feet
|
2 baths - beds |
show details | |

|
#43
Beacon St
Ocean Springs, MS 39564
|
1,310 sq. feet
|
2 baths - beds |
show details | |

|
#44
Linda Cir
Ocean Springs, MS 39564
|
888 sq. feet
|
1 baths - beds |
show details | |

|
#45
Connor Dr
Ocean Springs, MS 39564
|
1,836 sq. feet
|
2 baths - beds |
show details | |

|
#46
April Ln
Ocean Springs, MS 39564
|
1,188 sq. feet
|
2 baths - beds |
show details | |

|
#47
Old Fort Bayou Rd
Ocean Springs, MS 39564
|
1,050 sq. feet
|
1 baths - beds |
show details | |

|
#48
Penny Ct
Ocean Springs, MS 39564
|
2,108 sq. feet
|
2 baths - beds |
show details | |

|
#49
C Byrd Rd
Ocean Springs, MS 39564
|
1,654 sq. feet
|
2 baths - beds |
show details | |

|
Check over 1 million property listings on Foreclosure.com!
|
browse all offers | |||


 | Condos on Beachview Dive Ocean Springs (0 replies) |
| Apartments/Housing in or near Vancleave (17 replies) |
| Where to rent in Biloxi or Ocean Springs...for a 20-something year old male (2 replies) |
| Looking to move to Ocean Springs (0 replies) |
| All these states complaining about Californians moving there..... (116 replies) |
| A tranquil place / drug-free Hobbit home community (10 replies) |
Median year apartment built: 1980
Household type by relationship:
Households: 18,577- Male householders: 4,374 (1,364 living alone), Female householders: 3,596 (1,285 living alone)
3,610 spouses (3,610 opposite-sex spouses), 259 unmarried partners, (196 opposite-sex unmarried partners), 5,557 children (5,246 natural, 147 adopted, 163 stepchildren), 319 grandchildren, 109 brothers or sisters, 290 parents, 0 foster children, 60 other relatives, 252 non-relatives
- In group quarters: 147
Size of family households: 2,660 2-persons, 1,270 3-persons, 913 4-persons, 493 5-persons, 74 6-persons, 3 7-or-more-persons.
Size of nonfamily households: 2,708 1-person, 164 2-persons, 124 3-persons.
2,779 married couples with children.
1,301 single-parent households (424 men, 877 women).
94.6% of residents of Ocean Springs speak English at home.
2.7% of residents speak Spanish at home (77% speak English very well, 13% speak English well, 7% speak English not well, 3% don't speak English at all).
1.5% of residents speak other Indo-European language at home (38% speak English very well, 12% speak English well, 50% speak English not well).
1.4% of residents speak Asian or Pacific Island language at home (78% speak English very well, 17% speak English well, 2% speak English not well, 2% don't speak English at all).
0.1% of residents speak other language at home (100% speak English well).
Foreign born population: 721 (3.9%)
(95.7% of them are naturalized citizens)
| Here: | 6.2 |
| State: | 6.3 |
| Here: | 4.5 |
| State: | 4.8 |
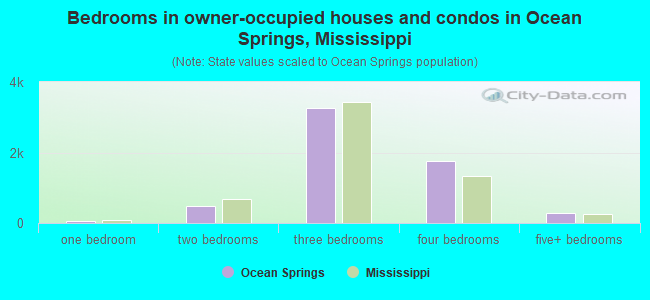
- Bedrooms in owner-occupied houses and condos in Ocean Springs, Mississippi
- 0no bedroom
- 511 bedroom
- 4712 bedrooms
- 3,2543 bedrooms
- 1,7564 bedrooms
- 2935+ bedrooms
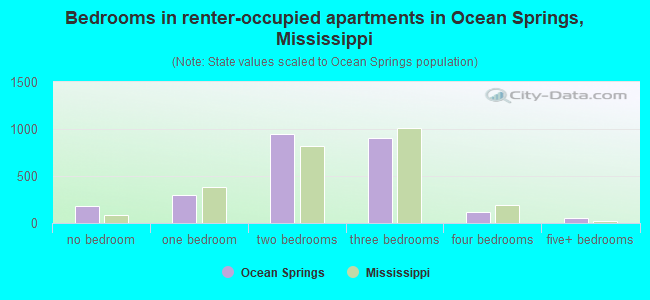
- Bedrooms in renter-occupied apartments in Ocean Springs, Mississippi
- 176no bedroom
- 2991 bedroom
- 9492 bedrooms
- 9023 bedrooms
- 1194 bedrooms
- 555+ bedrooms
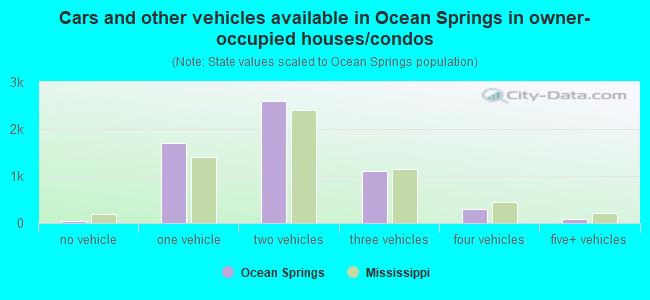
- Cars and other vehicles available in Ocean Springs in owner-occupied houses/condos
- 33no vehicle
- 1,7031 vehicle
- 2,5882 vehicles
- 1,1163 vehicles
- 2914 vehicles
- 945+ vehicles
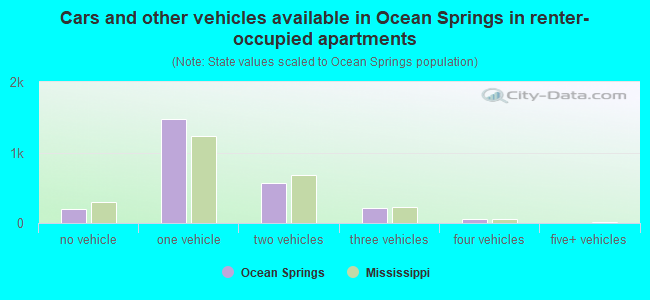
- Cars and other vehicles available in Ocean Springs in renter-occupied apartments
- 194no vehicle
- 1,4791 vehicle
- 5672 vehicles
- 2103 vehicles
- 514 vehicles
- 05+ vehicles
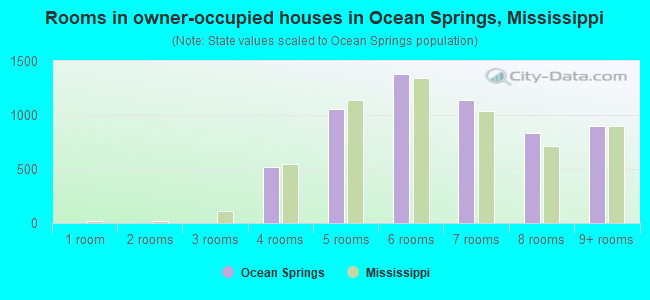
- Rooms in owner-occupied houses in Ocean Springs, Mississippi
- 01 room
- 02 rooms
- 03 rooms
- 5204 rooms
- 1,0575 rooms
- 1,3776 rooms
- 1,1397 rooms
- 8368 rooms
- 8959+ rooms
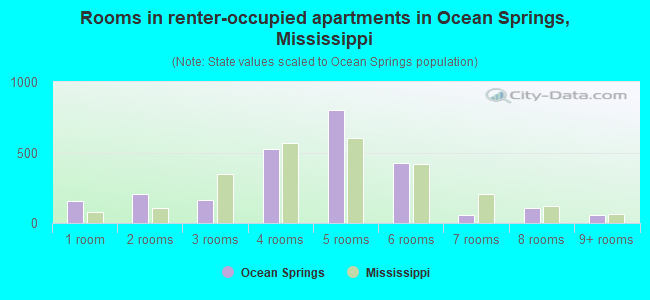
- Rooms in renter-occupied apartments in Ocean Springs, Mississippi
- 1551 room
- 2092 rooms
- 1643 rooms
- 5224 rooms
- 8035 rooms
- 4266 rooms
- 587 rooms
- 1048 rooms
- 599+ rooms
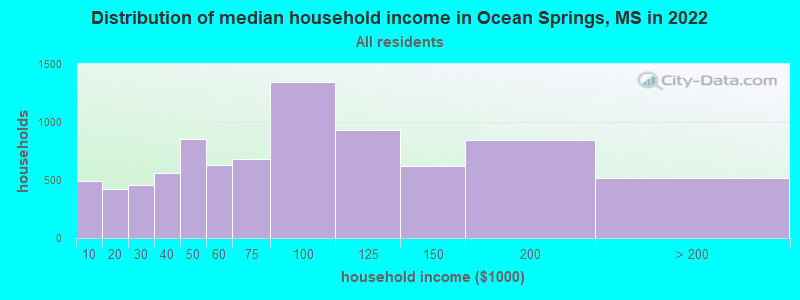
Ocean Springs, MS household income distribution

- 489Less than $10,000
- 423$10,000 to $19,999
- 455$20,000 to $29,999
- 564$30,000 to $39,999
- 855$40,000 to $49,999
- 628$50,000 to $59,999
- 678$60,000 to $74,999
- 1,345$75,000 to $99,999
- 928$100,000 to $124,999
- 622$125,000 to $149,999
- 848$150,000 to $199,999
- 518$200,000 or more
Home value of owner - occupied houses in 2022 in Ocean Springs, MS
-
- 12$20,000 to $24,999
- 21$50,000 to $59,999
- 67$60,000 to $69,999
- 103$70,000 to $79,999
- 130$80,000 to $89,999
- 73$90,000 to $99,999
- 458$100,000 to $124,999
- 400$125,000 to $149,999
- 500$150,000 to $174,999
- 467$175,000 to $199,999
- 892$200,000 to $249,999
- 584$250,000 to $299,999
- 976$300,000 to $399,999
- 763$400,000 to $499,999
- 338$500,000 to $749,999
- 282$750,000 to $999,999
- 33$1,000,000 to $1,499,999
- 11$1,500,000 to $1,999,999
- 31$2,000,000 or more
Rent paid by renters in 2022 in Ocean Springs, MS
-
- 19$150 to $199
- 70$200 to $249
- 16$250 to $299
- 81$300 to $349
- 10$350 to $399
- 25$450 to $499
- 29$550 to $599
- 183$600 to $649
- 58$650 to $699
- 111$700 to $749
- 85$750 to $799
- 57$800 to $899
- 100$900 to $999
- 1,200$1,000 to $1,249
- 263$1,250 to $1,499
- 237$1,500 to $1,999
- 17$2,000 to $2,499
- 68$3,000 to $3,499
- 43$3,500 or more
- 106No cash rent
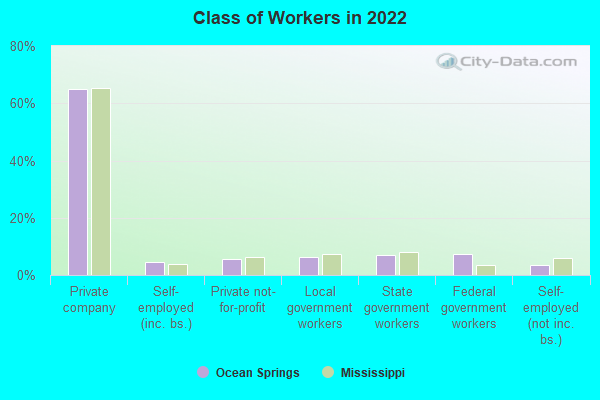
Percentage of workers working in this county: 59.9%
Number of people working at home: 856 (9.9% of all workers)
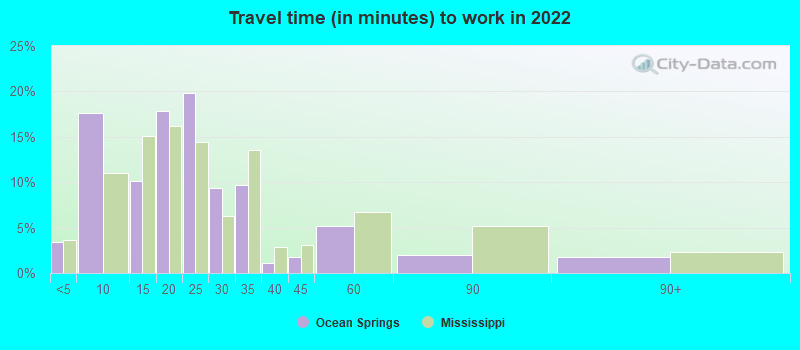
Travel time to work (commute)
- Less than 5 minutes: 294
- 5 to 9 minutes: 883
- 10 to 14 minutes: 915
- 15 to 19 minutes: 1,303
- 20 to 24 minutes: 1,191
- 25 to 29 minutes: 605
- 30 to 34 minutes: 1,207
- 35 to 39 minutes: 219
- 40 to 44 minutes: 163
- 45 to 59 minutes: 899
- 60 to 89 minutes: 214
- 90 or more minutes: 435
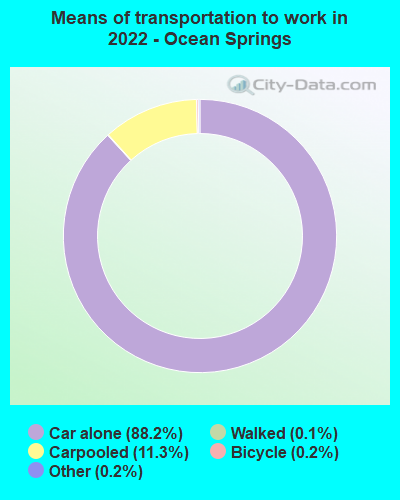
Means of transportation to work:
- Drove a car alone: 8,240 (80.3%)
- Carpooled: 1,171 (11.4%)
- Taxi: 16 (0.2%)
- Bicycle: 16 (0.2%)
- Walked: 15 (0.1%)
- Worked at home: 856 (8.3%)
- Unemployment by race in 2022
- Unemployment rate for White non-Hispanic residents
- 3.7%Males
- 3.3%Females
- Unemployment rate for American Indian and Alaska Native residents
- 100.0%Males
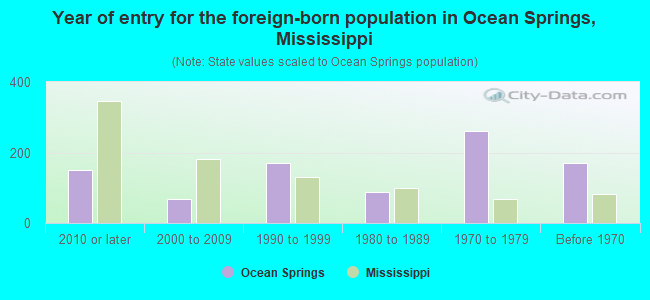
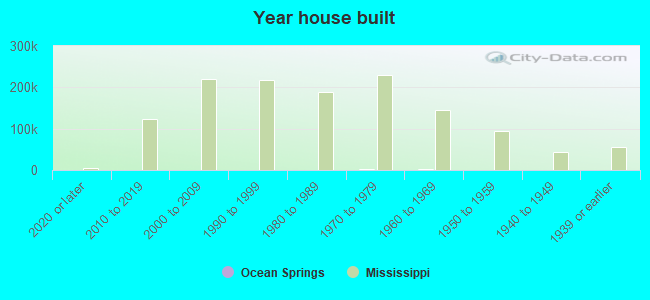
- Year of entry for the foreign-born population in Ocean Springs, Mississippi
- 1512010 or later
- 672000 to 2009
- 1701990 to 1999
- 891980 to 1989
- 2611970 to 1979
- 170Before 1970
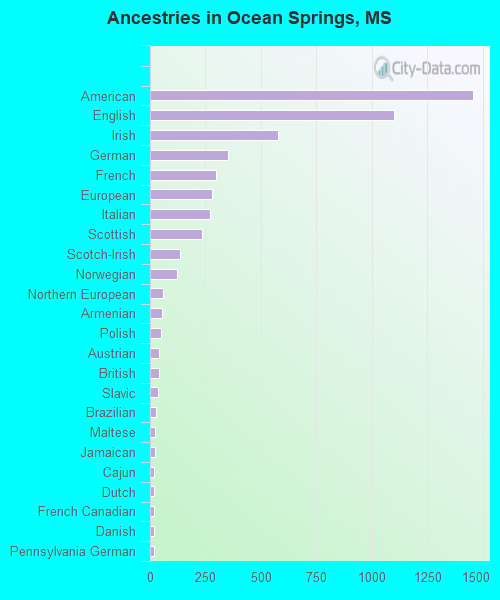
First ancestries reported:
- American: 1,456 (18.3%)
- English: 1,102 (13.9%)
- Irish: 576 (7.3%)
- German: 352 (4.4%)
- French: 296 (3.7%)
- European: 279 (3.5%)
- Italian: 271 (3.4%)
- Scottish: 235 (3.0%)
- Scotch-Irish: 136 (1.7%)
- Norwegian: 124 (1.6%)
- Northern European: 60 (0.8%)
- Armenian: 52 (0.7%)
- Polish: 49 (0.6%)
- Austrian: 41 (0.5%)
- British: 41 (0.5%)
- Slavic: 38 (0.5%)
- Brazilian: 26 (0.3%)
- Maltese: 22 (0.3%)
- Jamaican: 22 (0.3%)
- Cajun: 19 (0.2%)
- Dutch: 19 (0.2%)
- French Canadian: 18 (0.2%)
- Danish: 16 (0.2%)
- Pennsylvania German: 16 (0.2%)
- Greek: 13 (0.2%)
- Swedish: 13 (0.2%)
- Canadian: 10 (0.1%)
- Portuguese: 10 (0.1%)
- Hungarian: 9 (0.1%)
- Eastern European: 6 (0.08%)
Most common places of birth for foreign-born residents (%):
| Ocean Springs: | 14.7% (148) |
| Mississippi: | 4.7% (3,211) |
| Ocean Springs: | 12.5% (126) |
| Mississippi: | 5.1% (3,475) |
| Ocean Springs: | 8.3% (83) |
| Mississippi: | 5.8% (3,948) |
| Ocean Springs: | 7.8% (78) |
| Mississippi: | 1.5% (1,043) |
| Ocean Springs: | 6.2% (62) |
| Mississippi: | 25.4% (17,354) |
| Ocean Springs: | 5.4% (54) |
| Mississippi: | 0.1% (54) |
| Ocean Springs: | 4.9% (49) |
| Mississippi: | 0.7% (455) |
| Ocean Springs: | 4.7% (47) |
| Mississippi: | 0.3% (221) |
| Ocean Springs: | 4.6% (46) |
| Mississippi: | 1.5% (1,053) |
| Ocean Springs: | 3.9% (39) |
| Mississippi: | 0.8% (556) |
| Ocean Springs: | 3.9% (39) |
| Mississippi: | 2.0% (1,390) |
| Ocean Springs: | 3.7% (37) |
| Mississippi: | 1.4% (941) |
| Ocean Springs: | 3.2% (32) |
| Mississippi: | 0.4% (259) |
| Ocean Springs: | 2.3% (23) |
| Mississippi: | 0.6% (414) |
| Ocean Springs: | 2.2% (22) |
| Mississippi: | 1.3% (899) |
| Ocean Springs: | 2.1% (21) |
| Mississippi: | 0.0% (22) |
| Ocean Springs: | 1.7% (17) |
| Mississippi: | 0.7% (458) |
| Ocean Springs: | 1.6% (16) |
| Mississippi: | 0.2% (115) |
Place of birth for U.S.-born residents:
- This state: 8,627
- Other state: 8,848
- Northeast: 989
- Midwest: 1,469
- South: 5,175
- West: 1,210
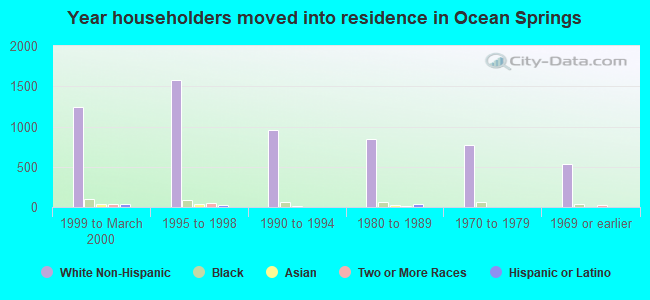
82.6% of Ocean Springs residents lived in the same house 1 years ago.
Out of people who lived in different houses, 38.1% lived in this county.
Out of people who lived in different counties, 37.2% lived in Mississippi.
| Ocean Springs: | 82.6% |
| State average: | 88.9% |
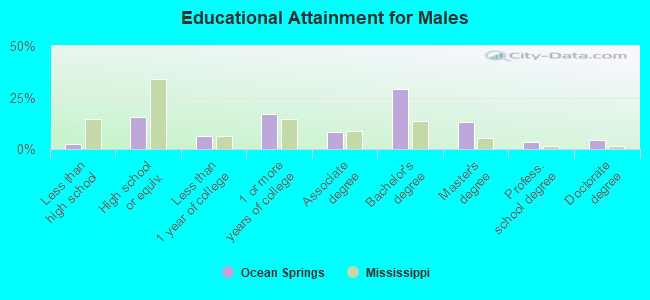
Education attainment for males 25 years and older:
- No schooling: 70
- Nursery to 4th grade: 0
- 5th and 6th grade: 26
- 7th and 8th grade: 18
- 9th grade: 3
- 10th grade: 16
- 11th grade: 0
- 12th grade, no diploma: 18
- High school graduate (or equivalency): 1,029
- Less than 1 year of college: 430
- Some college more than 1 year, no degree: 1,129
- Associate degree: 533
- Bachelor's degree: 1,936
- Master's degree: 862
- Professional school degree: 231
- Doctorate degree: 304
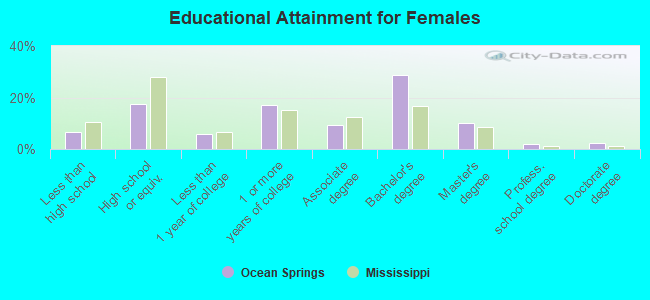
Education attainment for females 25 years and older:
- No schooling: 242
- Nursery to 4th grade: 0
- 5th and 6th grade: 1
- 7th and 8th grade: 45
- 9th grade: 33
- 10th grade: 69
- 11th grade: 13
- 12th grade, no diploma: 54
- High school graduate (or equivalency): 1,207
- Less than 1 year of college: 391
- Some college more than 1 year, no degree: 1,170
- Associate degree: 647
- Bachelor's degree: 1,964
- Master's degree: 694
- Professional school degree: 142
- Doctorate degree: 168
Housing units in structures:
- One, detached: 6,608
- One, attached: 185
- Two: 216
- 3 or 4: 247
- 5 to 9: 446
- 10 to 19: 270
- 20 to 49: 163
- 50 or more: 345
- Mobile homes: 98
Median worth of mobile homes: $197,342
Housing units lacking complete kitchen facilities in 2022: 1.2%
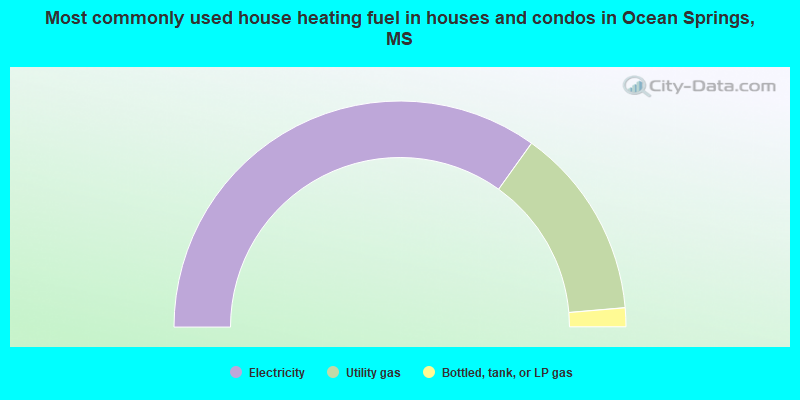
- 69.8%Electricity
- 27.5%Utility gas
- 2.7%Bottled, tank, or LP gas
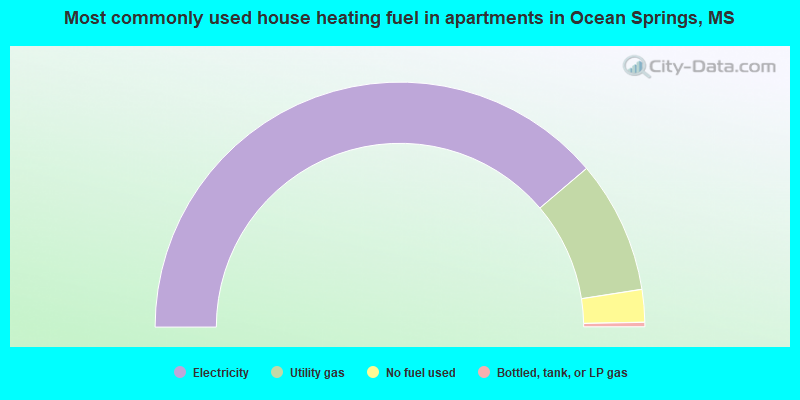
- 77.6%Electricity
- 17.5%Utility gas
- 4.3%No fuel used
- 0.6%Bottled, tank, or LP gas
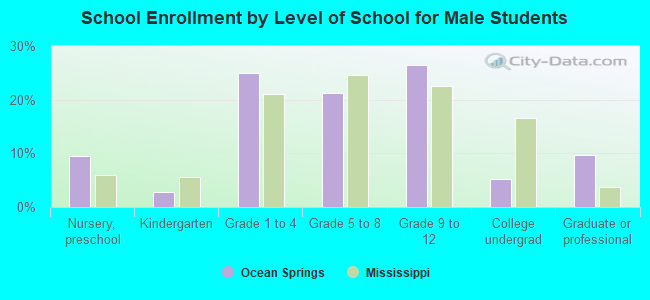
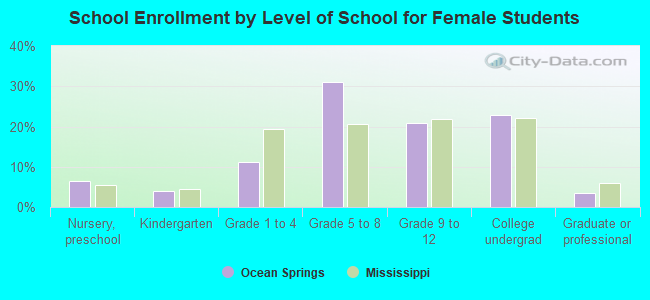
Private vs. public school enrollment:
| Here: | 12.1% |
| Mississippi: | 16.1% |
| Here: | 11.2% |
| Mississippi: | 14.6% |
| Here: | 10.9% |
| Mississippi: | 12.8% |