Nutley, NJ (New Jersey) Houses and Residents
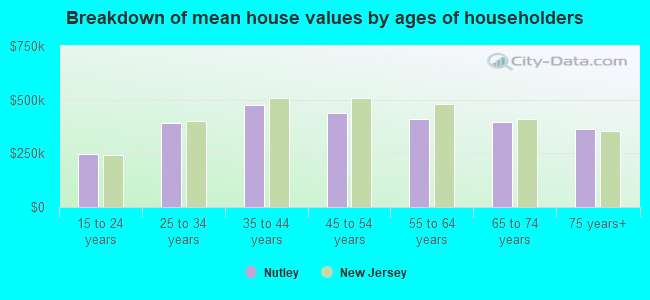
| Nutley: | $494,362 |
| New Jersey: | $428,900 |
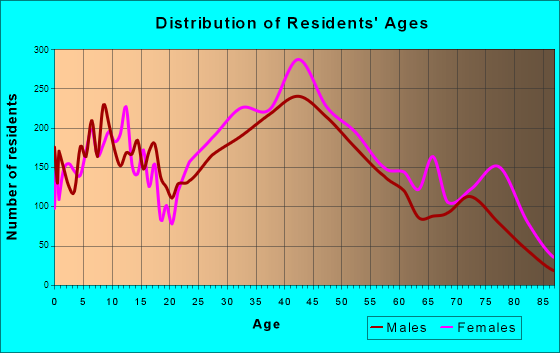
Total population: 26,562 (All urban)
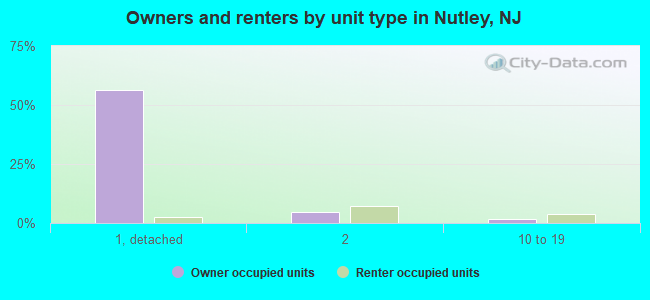
Houses: 11,118 (10,884 occupied: 7,276 owner occupied, 3,608 renter occupied)
| % of renters here: | 33% |
| State: | 35% |
Housing density: 3,301 houses/condos per square mile
Median price asked for vacant for-sale houses and condos in 2022 in this county: $231,294.
Median contract rent in 2022: $1,511 (lower quartile is $1,339, upper quartile is $1,966)
Median rent asked for vacant for-rent units in 2022: $1,573
Median gross rent in Nutley, NJ in 2022: $1,659
Housing units in Nutley with a mortgage: 4,099 (362 second mortgage, 716 home equity loan, 55 both second mortgage and home equity loan)
Houses without a mortgage: 2,097
Compare current foreclosures in Nutley, NJ:
| Photo | Address | Area | Beds / Baths | Price | Details |
|---|---|---|---|---|---|

|
#1
River Rd Apt C28
Nutley, NJ 07110
|
870 sq. feet
|
1 baths 2 beds |
show details | |

|
#2
Glenview Rd
Nutley, NJ 07110
|
2,173 sq. feet
|
2 baths 3 beds |
show details | |

|
#3
Howard Pl
Nutley, NJ 07110
|
1,548 sq. feet
|
- baths - beds |
show details | |

|
#4
Swathmore Dr
Nutley, NJ 07110
|
1,799 sq. feet
|
- baths - beds |
show details | |

|
#5
Mountainview Ave
Nutley, NJ 07110
|
1,058 sq. feet
|
- baths - beds |
show details | |

|
#6
Passaic Ave
Nutley, NJ 07110
|
1,848 sq. feet
|
- baths - beds |
show details | |

|
#7
River Rd Apt 2-2d
Nutley, NJ 07110
|
- sq. feet
|
- baths - beds |
show details | |

|
#8
Chestnut St Apt 308
Nutley, NJ 07110
|
- sq. feet
|
- baths - beds |
show details | |

|
#9
River Rd Apt B
Nutley, NJ 07110
|
- sq. feet
|
- baths - beds |
show details | |

|
#10
Union Ave Apt 5
Nutley, NJ 07110
|
- sq. feet
|
- baths - beds |
show details |
| Photo | Address | Area | Beds / Baths | Price | Details |
|---|---|---|---|---|---|

|
#11
River Rd Apt E
Nutley, NJ 07110
|
- sq. feet
|
- baths - beds |
show details | |

|
#12
River R E
Nutley, NJ 07110
|
- sq. feet
|
- baths - beds |
show details | |

|
#13
Adams Ct Apt 3a
Nutley, NJ 07110
|
- sq. feet
|
- baths - beds |
show details | |

|
#14
Hay Ave
Nutley, NJ 07110
|
1,223 sq. feet
|
- baths - beds |
show details | |

|
#15
Chestnut St Apt A4
Nutley, NJ 07110
|
- sq. feet
|
- baths - beds |
show details | |

|
#16
Laurel Pl
Nutley, NJ 07110
|
- sq. feet
|
- baths - beds |
show details | |

|
#17
Roma St # 1
Nutley, NJ 07110
|
- sq. feet
|
- baths - beds |
show details | |

|
#18
King St # 2
Nutley, NJ 07110
|
- sq. feet
|
- baths - beds |
show details | |

|
#19
Ackerman St
Nutley, NJ 07110
|
1,122 sq. feet
|
- baths - beds |
show details | |

|
#20
High St Apt 4
Nutley, NJ 07110
|
- sq. feet
|
- baths - beds |
show details |
| Photo | Address | Area | Beds / Baths | Price | Details |
|---|---|---|---|---|---|

|
#21
Overlook Ter
Nutley, NJ 07110
|
3,046 sq. feet
|
- baths - beds |
show details | |

|
#22
Hastings Ave
Nutley, NJ 07110
|
2,350 sq. feet
|
- baths - beds |
show details | |

|
#23
Warren St
Nutley, NJ 07110
|
- sq. feet
|
- baths - beds |
show details | |

|
#24
William St Apt 301
Nutley, NJ 07110
|
- sq. feet
|
- baths - beds |
show details | |

|
#25
Hillside Ave
Nutley, NJ 07110
|
- sq. feet
|
- baths - beds |
show details | |

|
#26
Watchung Pl
Nutley, NJ 07110
|
2,380 sq. feet
|
- baths - beds |
show details | |

|
#27
Satterthwaite Ave
Nutley, NJ 07110
|
- sq. feet
|
- baths - beds |
show details | |

|
#28
Centre St
Nutley, NJ 07110
|
- sq. feet
|
- baths - beds |
show details | |

|
#29
Brookfield Ave
Nutley, NJ 07110
|
- sq. feet
|
- baths - beds |
show details | |

|
#30
Centre St
Nutley, NJ 07110
|
- sq. feet
|
- baths - beds |
show details |
| Photo | Address | Area | Beds / Baths | Price | Details |
|---|---|---|---|---|---|

|
#31
Kierstead Ave
Nutley, NJ 07110
|
- sq. feet
|
- baths - beds |
show details | |

|
#32
Glendale St
Nutley, NJ 07110
|
- sq. feet
|
- baths - beds |
show details | |

|
#33
Oak Ridge Ave
Nutley, NJ 07110
|
- sq. feet
|
- baths - beds |
show details | |

|
#34
Bloomfield Ave
Nutley, NJ 07110
|
- sq. feet
|
- baths - beds |
show details | |

|
#35
Brookway
Nutley, NJ 07110
|
- sq. feet
|
- baths - beds |
show details | |

|
#36
Chestnut St
Nutley, NJ 07110
|
- sq. feet
|
- baths - beds |
show details | |

|
#37
Ravine Ave
Nutley, NJ 07110
|
- sq. feet
|
- baths - beds |
show details | |

|
#38
Mountainview Ave
Nutley, NJ 07110
|
- sq. feet
|
- baths - beds |
show details | |

|
#39
Alexander Ave
Nutley, NJ 07110
|
- sq. feet
|
- baths - beds |
show details | |

|
#40
Linn Rd
Nutley, NJ 07110
|
- sq. feet
|
- baths - beds |
show details |
| Photo | Address | Area | Beds / Baths | Price | Details |
|---|---|---|---|---|---|

|
#41
Beech St
Nutley, NJ 07110
|
- sq. feet
|
- baths - beds |
show details | |

|
#42
New St
Nutley, NJ 07110
|
- sq. feet
|
- baths - beds |
show details | |

|
#43
Lakeside Dr
Nutley, NJ 07110
|
- sq. feet
|
- baths - beds |
show details | |

|
#44
Hopper Ave
Nutley, NJ 07110
|
- sq. feet
|
- baths - beds |
show details | |

|
#45
Bloomfield Ave
Nutley, NJ 07110
|
- sq. feet
|
- baths - beds |
show details | |

|
#46
Swathmore D 3
Nutley, NJ 07110
|
- sq. feet
|
- baths - beds |
show details | |

|
#47
Hetherington Rd
Nutley, NJ 07110
|
- sq. feet
|
- baths - beds |
show details | |

|
#48
Prospect St
Nutley, NJ 07110
|
- sq. feet
|
- baths - beds |
show details | |

|
#49
Locust St
Nutley, NJ 07110
|
- sq. feet
|
- baths - beds |
show details | |

|
Check over 1 million property listings on Foreclosure.com!
|
browse all offers | |||
Latest news about housing in Nutley, NJ collected exclusively by city-data.com from local newspapers, TV, and radio stations

 | Riverwalk Condos, Clifton, NJ (0 replies) |
| Looking For apartment/Home Rental in Kearny, NA, Nutley (8 replies) |
| Gated townhome communities/ Cambridge Heights in Nutley (7 replies) |
| Room for Rent in Nutley, New Jersey (0 replies) |
| Daycare recommendations in / around Nutley (2 replies) |
| Lyndhurst Real Estate Values (3 replies) |
Household type by relationship:
Households: 760,197- In family households: 645,040 (104,343 male householders, 84,996 female householders)
113,673 spouses, 245,726 children (232,723 natural, 5,793 adopted, 7,210 stepchildren), 20,627 grandchildren, 15,422 brothers or sisters, 11,923 parents, foster children, 19,910 other relatives, 22,762 non-relatives
- In nonfamily households: 115,157 (42,135 male householders (33,262 living alone)), 52,238 female householders (45,266 living alone)), 20,784 nonrelatives
- In group quarters: 23,772 (12,126 institutionalized population)
108,634 married couples with children.
65,899 single-parent households (10,059 men, 55,840 women).
79.2% of residents of Nutley speak English at home.
6.0% of residents speak Spanish at home (66% speak English very well, 20% speak English well, 9% speak English not well, 5% don't speak English at all).
10.1% of residents speak other Indo-European language at home (69% speak English very well, 19% speak English well, 10% speak English not well, 2% don't speak English at all).
4.2% of residents speak Asian or Pacific Island language at home (56% speak English very well, 29% speak English well, 14% speak English not well, 1% don't speak English at all).
0.6% of residents speak other language at home (61% speak English very well, 23% speak English well, 17% speak English not well).
Foreign born population: 5,941 (20.3%)
(74.5% of them are naturalized citizens)
| Here: | 6.7 |
| State: | 6.8 |
| Here: | 4.1 |
| State: | 3.9 |
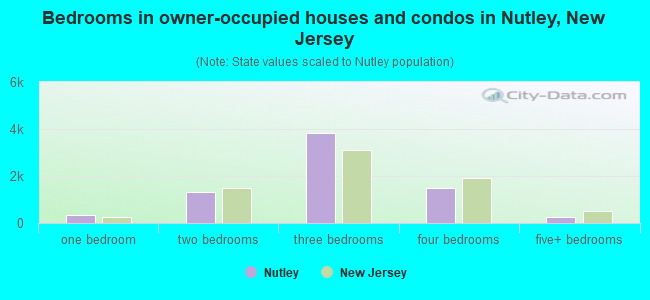
- Bedrooms in owner-occupied houses and condos in Nutley, New Jersey
- 22no bedroom
- 3551 bedroom
- 1,3012 bedrooms
- 3,8393 bedrooms
- 1,4864 bedrooms
- 2735+ bedrooms
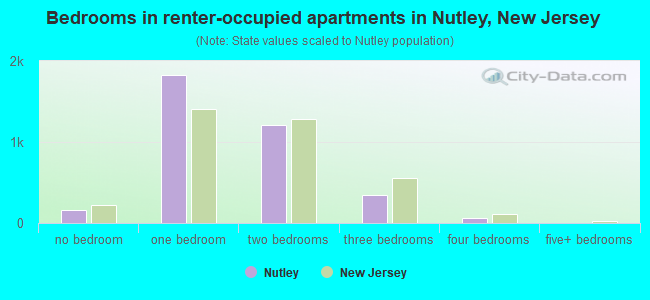
- Bedrooms in renter-occupied apartments in Nutley, New Jersey
- 163no bedroom
- 1,8241 bedroom
- 1,2112 bedrooms
- 3443 bedrooms
- 664 bedrooms
- 05+ bedrooms
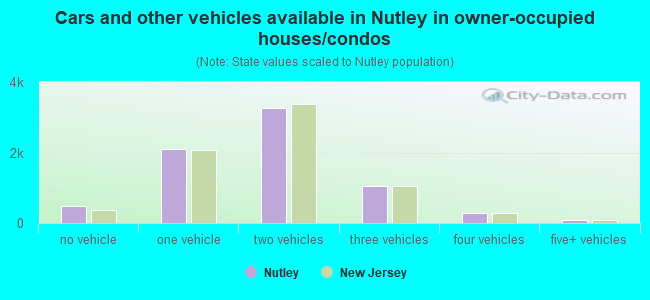
- Cars and other vehicles available in Nutley in owner-occupied houses/condos
- 485no vehicle
- 2,1021 vehicle
- 3,2582 vehicles
- 1,0623 vehicles
- 2844 vehicles
- 855+ vehicles
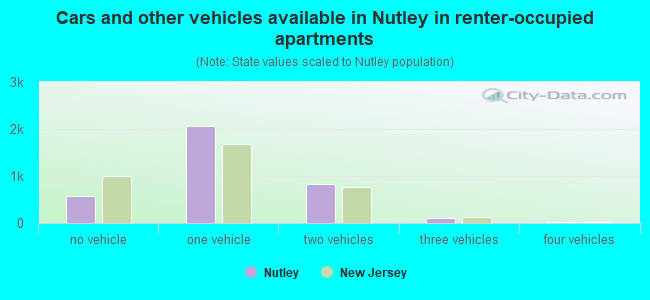
- Cars and other vehicles available in Nutley in renter-occupied apartments
- 576no vehicle
- 2,0541 vehicle
- 8232 vehicles
- 1133 vehicles
- 304 vehicles
- 125+ vehicles
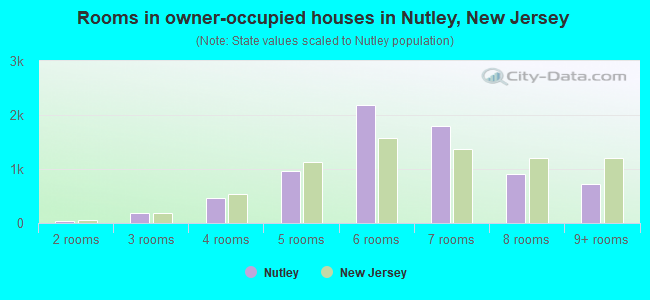
- Rooms in owner-occupied houses in Nutley, New Jersey
- 141 room
- 422 rooms
- 1863 rooms
- 4544 rooms
- 9585 rooms
- 2,1836 rooms
- 1,8017 rooms
- 9088 rooms
- 7309+ rooms
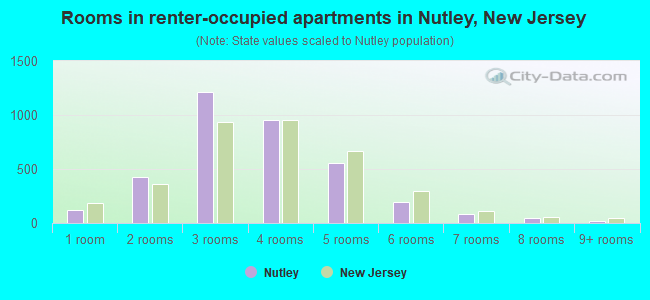
- Rooms in renter-occupied apartments in Nutley, New Jersey
- 1211 room
- 4272 rooms
- 1,2143 rooms
- 9504 rooms
- 5515 rooms
- 1936 rooms
- 847 rooms
- 458 rooms
- 239+ rooms
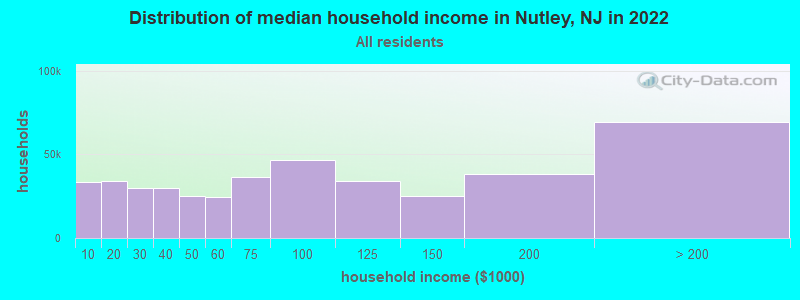
Nutley, NJ household income distribution

- 33,591Less than $10,000
- 34,118$10,000 to $19,999
- 30,094$20,000 to $29,999
- 29,811$30,000 to $39,999
- 25,032$40,000 to $49,999
- 24,410$50,000 to $59,999
- 36,166$60,000 to $74,999
- 46,851$75,000 to $99,999
- 33,841$100,000 to $124,999
- 25,148$125,000 to $149,999
- 38,016$150,000 to $199,999
- 69,335$200,000 or more
Percentage of workers working in this county: 50.2%
Number of people working at home: 2,650 (15.4% of all workers)
Travel time to work (commute)
- Less than 5 minutes: 599
- 5 to 9 minutes: 1,483
- 10 to 14 minutes: 1,727
- 15 to 19 minutes: 1,658
- 20 to 24 minutes: 2,180
- 25 to 29 minutes: 689
- 30 to 34 minutes: 1,885
- 35 to 39 minutes: 392
- 40 to 44 minutes: 493
- 45 to 59 minutes: 1,177
- 60 to 89 minutes: 847
- 90 or more minutes: 412
Means of transportation to work:
- Drove a car alone: 10,926 (78.5%)
- Carpooled: 1,072 (7.7%)
- Bus or trolley bus: 783 (5.6%)
- Streetcar or trolley car: 5 (0.0%)
- Subway or elevated: 113 (0.8%)
- Railroad: 214 (1.5%)
- Ferryboat: 12 (0.1%)
- Taxi: 13 (0.1%)
- Bicycle: 28 (0.2%)
- Walked: 339 (2.4%)
- Other means: 37 (0.3%)
- Worked at home: 384 (2.8%)
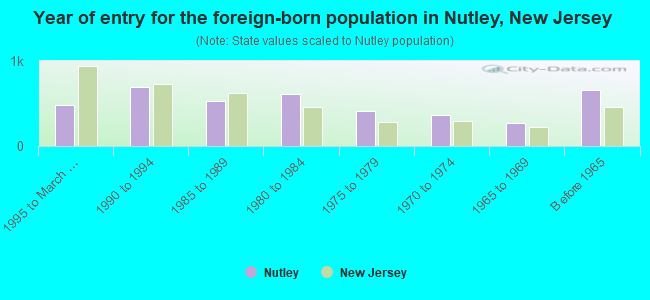
- Year of entry for the foreign-born population in Nutley, New Jersey
- 4881995 to March 2000
- 6901990 to 1994
- 5261985 to 1989
- 6131980 to 1984
- 4101975 to 1979
- 3621970 to 1974
- 2691965 to 1969
- 654Before 1965
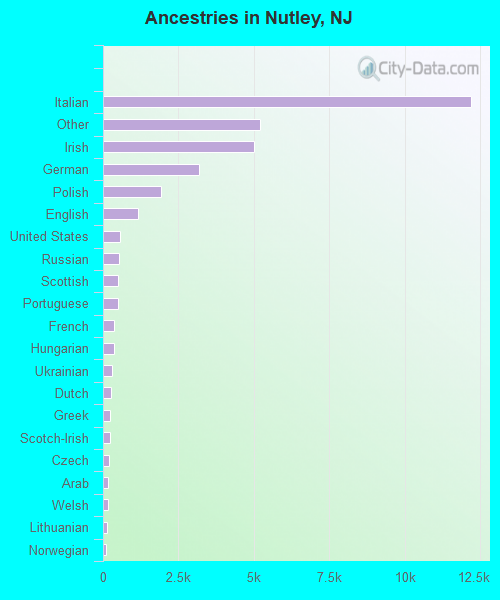
First ancestries reported:
- Italian: 12,183 (36.0%)
- Other: 5,219 (15.4%)
- Irish: 4,999 (14.8%)
- German: 3,166 (9.4%)
- Polish: 1,912 (5.7%)
- English: 1,152 (3.4%)
- United States: 563 (1.7%)
- Russian: 531 (1.6%)
- Scottish: 498 (1.5%)
- Portuguese: 493 (1.5%)
- French: 364 (1.1%)
- Hungarian: 358 (1.1%)
- Ukrainian: 292 (0.9%)
- Dutch: 261 (0.8%)
- Greek: 247 (0.7%)
- Scotch-Irish: 227 (0.7%)
- Czech: 201 (0.6%)
- Arab: 175 (0.5%)
- Welsh: 151 (0.4%)
- Lithuanian: 140 (0.4%)
- Norwegian: 112 (0.3%)
- West Indian: 109 (0.3%)
- Swedish: 102 (0.3%)
- French Canadian: 96 (0.3%)
- Slovak: 95 (0.3%)
- Swiss: 88 (0.3%)
- Danish: 51 (0.2%)
- Subsaharan African: 37 (0.1%)
Most common places of birth for foreign-born residents (%):
| Nutley: | 12.8% (514) |
| New Jersey: | 8.1% (119,497) |
| Nutley: | 11.8% (474) |
| New Jersey: | 4.0% (58,395) |
| Nutley: | 9.3% (372) |
| New Jersey: | 4.7% (69,773) |
| Nutley: | 4.9% (197) |
| New Jersey: | 3.5% (51,970) |
| Nutley: | 4.7% (188) |
| New Jersey: | 3.1% (45,151) |
| Nutley: | 3.4% (135) |
| New Jersey: | 2.7% (40,092) |
| Nutley: | 3.3% (134) |
| New Jersey: | 3.6% (53,482) |
| Nutley: | 3.3% (132) |
| New Jersey: | 4.7% (69,754) |
| Nutley: | 2.5% (102) |
| New Jersey: | 1.4% (20,079) |
| Nutley: | 2.5% (99) |
| New Jersey: | 6.2% (91,316) |
| Nutley: | 2.4% (97) |
| New Jersey: | 3.8% (55,466) |
| Nutley: | 2.3% (91) |
| New Jersey: | 1.0% (14,768) |
| Nutley: | 2.2% (89) |
| New Jersey: | 2.5% (37,183) |
| Nutley: | 2.0% (82) |
| New Jersey: | 2.1% (30,355) |
Place of birth for U.S.-born residents:
- This state: 18,948
- Other state: 4,130
- Northeast: 3,126
- Midwest: 313
- South: 533
- West: 158
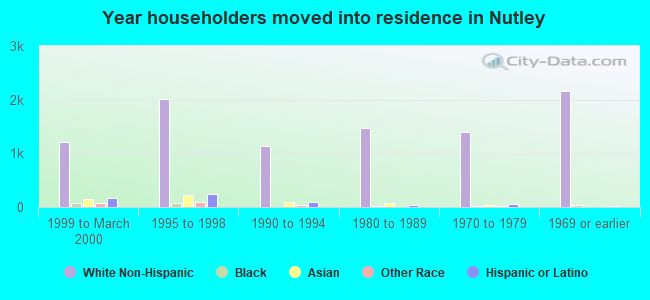
66% of Nutley residents lived in the same house 5 years ago.
Out of people who lived in different houses, 57% lived in this county.
Out of people who lived in different counties, 68% lived in New Jersey.
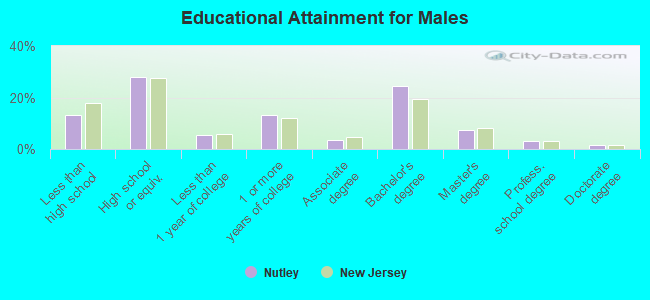
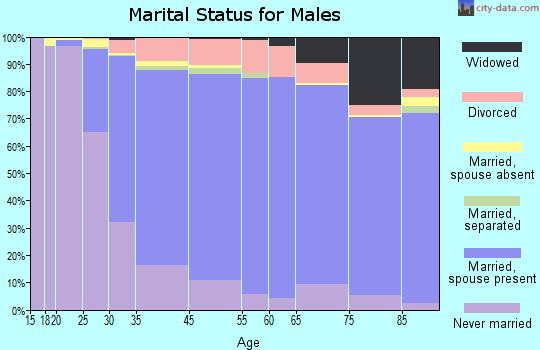
Education attainment for males 25 years and older:
- No schooling: 25
- Nursery to 4th grade: 21
- 5th and 6th grade: 76
- 7th and 8th grade: 171
- 9th grade: 160
- 10th grade: 210
- 11th grade: 168
- 12th grade, no diploma: 351
- High school graduate (or equivalency): 2,504
- Less than 1 year of college: 493
- Some college more than 1 year, no degree: 1,192
- Associate degree: 325
- Bachelor's degree: 2,176
- Master's degree: 642
- Professional school degree: 267
- Doctorate degree: 133
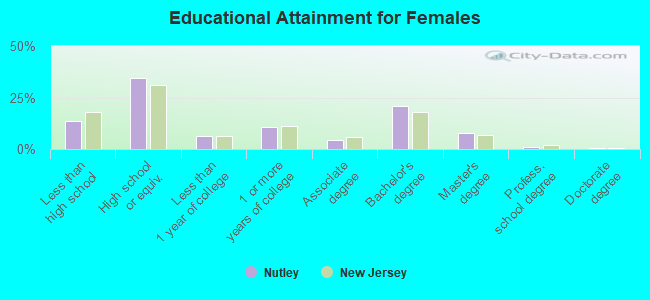
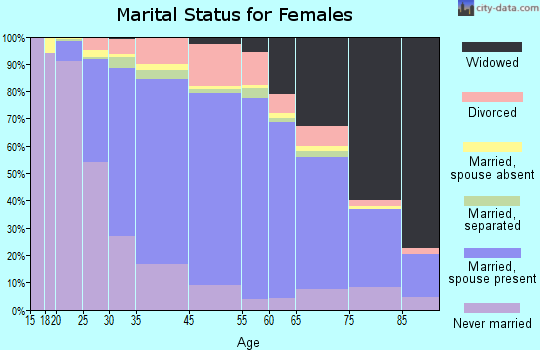
Education attainment for females 25 years and older:
- No schooling: 57
- Nursery to 4th grade: 30
- 5th and 6th grade: 121
- 7th and 8th grade: 366
- 9th grade: 161
- 10th grade: 237
- 11th grade: 189
- 12th grade, no diploma: 310
- High school graduate (or equivalency): 3,690
- Less than 1 year of college: 681
- Some college more than 1 year, no degree: 1,175
- Associate degree: 494
- Bachelor's degree: 2,244
- Master's degree: 853
- Professional school degree: 110
- Doctorate degree: 57
Housing units in structures:
- One, detached: 6,437
- One, attached: 244
- Two: 1,410
- 3 or 4: 606
- 5 to 9: 609
- 10 to 19: 629
- 20 to 49: 550
- 50 or more: 633
Housing units lacking complete kitchen facilities: 0.2%
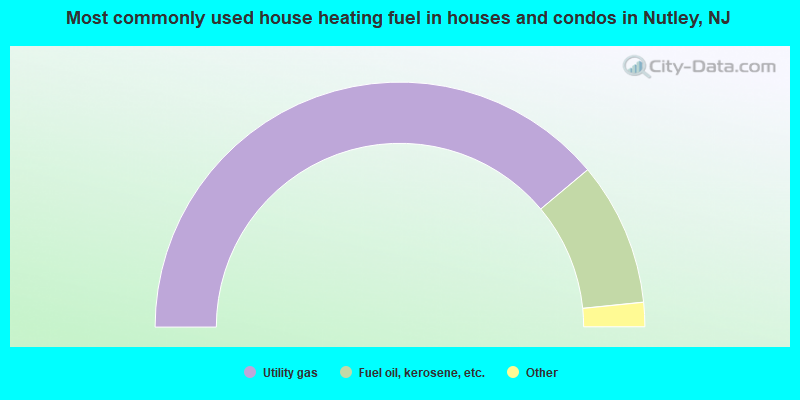
- 77.8%Utility gas
- 19.0%Fuel oil, kerosene, etc.
- 2.5%Electricity
- 0.5%Bottled, tank, or LP gas
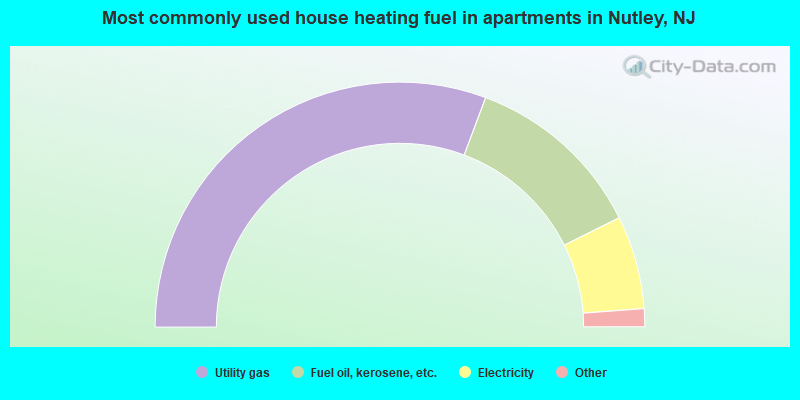
- 61.4%Utility gas
- 23.9%Fuel oil, kerosene, etc.
- 12.3%Electricity
- 1.6%Other fuel
- 0.6%Bottled, tank, or LP gas
- 0.2%No fuel used
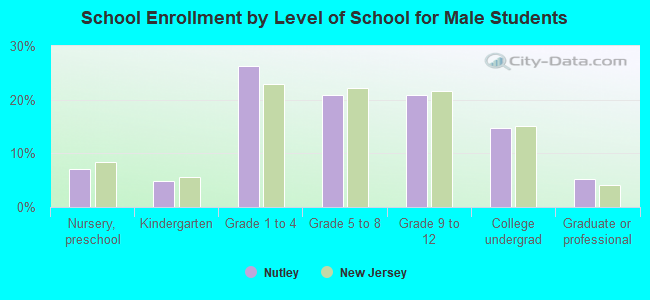
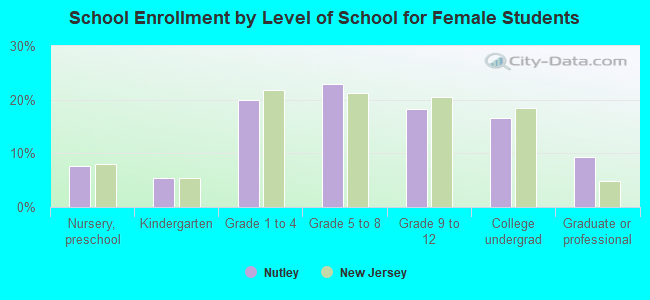
Private vs. public school enrollment:
| Here: | 6.3% |
| New Jersey: | 13.2% |
| Here: | 8.3% |
| New Jersey: | 13.0% |
| Here: | 35.3% |
| New Jersey: | 30.1% |