Norwalk, CT (Connecticut) Houses and Residents
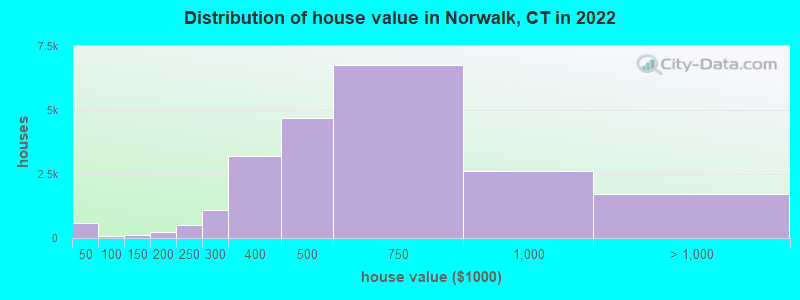
Estimated median house or condo value in 2022: $586,800 (it was $249,300 in 2000 )
Norwalk:
$586,800Connecticut:
$347,200
Lower value quartile - upper value quartile: $407,300 - $769,100Mean price in 2022: Detached houses: $671,092 Here:
$671,092State:
$503,946
Townhouses or other attached units: $443,066 Here:
$443,066State:
$304,959
In 2-unit structures: $368,186 Here:
$368,186State:
$304,133
In 3-to-4-unit structures: $443,080 Here:
$443,080State:
$272,970
In 5-or-more-unit structures: $277,935 Here:
$277,935State:
$249,308
Total population: 88,145 (Urban population: 82,951, Rural population: 0)
Houses: 38,917 (36,149 occupied: 19,153 owner occupied, 16,996 renter occupied )
% of renters here:
47%State:
34%
Housing density: 1,706 houses/condos per square mile
Median price asked for vacant for-sale houses and condos in 2022: $1,673,521.
Median contract rent in 2022: $1,688 (lower quartile is $1,212, upper quartile is over $2,000)
Median rent asked for vacant for-rent units in 2022: $930
Median gross rent in Norwalk, CT in 2022: $1,840
Housing units in Norwalk with a mortgage: 13,518 (2,088 second mortgage, 93 home equity loan, 1,619 both second mortgage and home equity loan )Houses without a mortgage: 185
Median household income for houses/condos with a mortgage: $156,556
Median household income for apartments without a mortgage: $93,576
Median monthly housing costs: $2,118
Data:
Median house or condo value ($)
Median house or condo value ($ change since 2000)
Median house or condo value ($) - White
Median house or condo value ($) - Black or African American
Median house or condo value ($) - Asian
Median house or condo value ($) - Hispanic or Latino
Median house or condo value ($) - American Indian and Alaska Native
Median house or condo value ($) - Multirace
Median house or condo value ($) - Other Race
Median price asked for mobile homes ($)
Household density (households per square mile)
Mean house or condo value by units in structure - 1, detached ($)
Mean house or condo value by units in structure - 1, attached ($)
Mean house or condo value by units in structure - 2 ($)
Mean house or condo value by units in structure by units in structure - 3 or 4 ($)
Mean house or condo value by units in structure - 5 or more ($)
Mean house or condo value by units in structure - Boat, RV, van, etc. ($)
Mean house or condo value by units in structure - Mobile home ($)
Median contract rent ($)
Median contract rent - Lower quartile ($)
Median contract rent - Upper quartile ($)
Median gross rent ($)
Urban houses (%)
Rural houses (%)
Houses occupied (%)
Houses occupied (% change since 2000)
Houses owner occupied (%)
Houses owner occupied (% change since 2000)
Houses renter occupied (%)
Houses renter occupied (% change since 2000)
Vacant housing units - For rent (%)
Vacant housing units - For rent (% change since 2000)
Vacant housing units - For sale only (%)
Vacant housing units - For sale only (% change since 2000)
Vacant housing units - Rented or sold, not occupied (%)
Vacant housing units - Rented or sold, not occupied (% change since 2000)
Vacant housing units - For seasonal, recreational, or occasional use (%)
Vacant housing units - For seasonal, recreational, or occasional use (% change since 2000)
Vacant housing units - For migrant workers (%)
Vacant housing units - For migrant workers (% change since 2000)
Vacant housing units - Other vacant (%)
Vacant housing units - Other vacant (% change since 2000)
Median monthly housing costs ($)
Median household income for houses/condos with a mortgage ($)
Median household income for houses/condos without a mortgage ($)
Median household income ($)
Median household income ($) - White
Median household income ($) - Black or African American
Median household income ($) - Asian
Median household income ($) - Hispanic or Latino
Median household income ($) - American Indian and Alaska Native
Median household income ($) - Multirace
Median household income ($) - Other Race
Mortgage status - with mortgage (%)
Mortgage status - with second mortgage (%)
Mortgage status - with home equity loan (%)
Mortgage status - with both second mortgage and home equity loan (%)
Mortgage status - without a mortgage (%)
Median year house/condo built
Median year apartment built
Household type by relationship - Male householder living alone (%)
Household type by relationship - Male householder not living alone (%)
Household type by relationship - Female householder living alone (%)
Household type by relationship - Female householder not living alone (%)
Household type by relationship - Opposite-Sex spouse (%)
Household type by relationship - Same-Sex spouse (%)
Household type by relationship - Opposite-Sex unmarried partner (%)
Household type by relationship - Same-Sex unmarried partner (%)
Household type by relationship - In group quarters (%)
Size of family households - 2-person household (%)
Size of family households - 3-person household (%)
Size of family households - 4-person household (%)
Size of family households - 5-person household (%)
Size of family households - 6-person household (%)
Size of family households - 7-or-more-person household (%)
Size of nonfamily households - 1-person household (%)
Size of nonfamily households - 2-person household (%)
Size of nonfamily households - 3-person household (%)
Size of nonfamily households - 4-person household (%)
Size of nonfamily households - 5-person household (%)
Size of nonfamily households - 6-person household (%)
Size of nonfamily households - 7-or-moreperson household (%)
Year house built - Built 2010 or later (%)
Year house built - Built 2000 to 2009 (%)
Year house built - Built 1990 to 1999 (%)
Year house built - Built 1980 to 1989 (%)
Year house built - Built 1970 to 1979 (%)
Year house built - Built 1960 to 1969 (%)
Year house built - Built 1950 to 1959 (%)
Year house built - Built 1940 to 1949 (%)
Year house built - Built 1939 or earlier (%)
Median number of rooms in houses and condos
Median number of rooms in apartments
Median number of bedrooms in owner occupied houses
Mean number of bedrooms in owner occupied houses
Median number of bedrooms in renter occupied houses
Mean number of bedrooms in renter occupied houses
Median number of vehichles in owner occupied houses
Mean number of vehichles in owner occupied houses
Median number of vehichles in renter occupied houses
Mean number of vehichles in renter occupied houses
Rooms in owner-occupied houses - 1 room (%)
Rooms in owner-occupied houses - 2 rooms (%)
Rooms in owner-occupied houses - 3 rooms (%)
Rooms in owner-occupied houses - 4 rooms (%)
Rooms in owner-occupied houses - 5 rooms (%)
Rooms in owner-occupied houses - 6 rooms (%)
Rooms in owner-occupied houses - 7 rooms (%)
Rooms in owner-occupied houses - 8 rooms (%)
Rooms in owner-occupied houses - 9+ rooms (%)
Rooms in renter-occupied houses - 1 room (%)
Rooms in renter-occupied houses - 2 rooms (%)
Rooms in renter-occupied houses - 3 rooms (%)
Rooms in renter-occupied houses - 4 rooms (%)
Rooms in renter-occupied houses - 5 rooms (%)
Rooms in renter-occupied houses - 6 rooms (%)
Rooms in renter-occupied houses - 7 rooms (%)
Rooms in renter-occupied houses - 8 rooms (%)
Rooms in renter-occupied houses - 9+ rooms (%)
Bedrooms in owner-occupied houses - no bedrooms (%)
Bedrooms in owner-occupied houses - 1 bedroom (%)
Bedrooms in owner-occupied houses - 2 bedrooms (%)
Bedrooms in owner-occupied houses - 3 bedrooms (%)
Bedrooms in owner-occupied houses - 4 bedrooms (%)
Bedrooms in owner-occupied houses - 5+ bedrooms (%)
Bedrooms in renter-occupied houses - no bedrooms (%)
Bedrooms in renter-occupied houses - 1 bedroom (%)
Bedrooms in renter-occupied houses - 2 bedrooms (%)
Bedrooms in renter-occupied houses - 3 bedrooms (%)
Bedrooms in renter-occupied houses - 4 bedrooms (%)
Bedrooms in renter-occupied houses - 5+ bedrooms (%)
Vehicles available in owner-occupied houses - no vehicle available (%)
Vehicles available in owner-occupied houses - 1 vehicle available(%)
Vehicles available in owner-occupied houses - 2 Vehicles available (%)
Vehicles available in owner-occupied houses - 3 Vehicles available (%)
Vehicles available in owner-occupied houses - 4 Vehicles available (%)
Vehicles available in owner-occupied houses - 5+ Vehicles available (%)
Vehicles available in renter-occupied houses - no vehicle available (%)
Vehicles available in renter-occupied houses - 1 vehicle available (%)
Vehicles available in renter-occupied houses - 2 Vehicles available (%)
Vehicles available in renter-occupied houses - 3 Vehicles available (%)
Vehicles available in renter-occupied houses - 4 Vehicles available (%)
Vehicles available in renter-occupied houses - 5+ Vehicles available (%)
Housing units in structures - 1, detached (%)
Housing units in structures - 1, attached (%)
Housing units in structures - 2 (%)
Housing units in structures - 3 or 4 (%)
Housing units in structures - 5 to 9 (%)
Housing units in structures - 10 to 19 (%)
Housing units in structures - 20 to 49 (%)
Housing units in structures - 50 or more (%)
Housing units in structures - Mobile home (%)
Housing units in structures - Boat, RV, van, etc. (%)
Housing units in structures - Owners - 1, detached (%)
Housing units in structures - Owners - 1, attached (%)
Housing units in structures - Owners - 2 (%)
Housing units in structures - Owners - 3 or 4 (%)
Housing units in structures - Owners - 5 to 9 (%)
Housing units in structures - Owners - 10 to 19 (%)
Housing units in structures - Owners - 20 to 49 (%)
Housing units in structures - Owners - 50 or more (%)
Housing units in structures - Owners - Mobile home (%)
Housing units in structures - Owners - Boat, RV, van, etc. (%)
Housing units in structures - Renters - 1, detached (%)
Housing units in structures - Renters - 1, attached (%)
Housing units in structures - Renters - 2 (%)
Housing units in structures - Renters - 3 or 4 (%)
Housing units in structures - Renters - 5 to 9 (%)
Housing units in structures - Renters - 10 to 19 (%)
Housing units in structures - Renters - 20 to 49 (%)
Housing units in structures - Renters - 50 or more (%)
Housing units in structures - Renters - Mobile home (%)
Housing units in structures - Renters - Boat, RV, van, etc. (%)
House/condo owner moved in on average (years ago)
Renter moved in on average (years ago)
Year householder moved into unit - Moved in 1999 to March 2000 (%)
Year householder moved into unit - Moved in 1999 to March 2000 (%) - White
Year householder moved into unit - Moved in 1999 to March 2000 (%) - Black or African American
Year householder moved into unit - Moved in 1999 to March 2000 (%) - Asian
Year householder moved into unit - Moved in 1999 to March 2000 (%) - Hispanic or Latino
Year householder moved into unit - Moved in 1999 to March 2000 (%) - American Indian and Alaska Native
Year householder moved into unit - Moved in 1999 to March 2000 (%) - Multirace
Year householder moved into unit - Moved in 1999 to March 2000 (%) - Other Race
Year householder moved into unit - Moved in 1995 to 1998 (%)
Year householder moved into unit - Moved in 1995 to 1998 (%) - White
Year householder moved into unit - Moved in 1995 to 1998 (%) - Black or African American
Year householder moved into unit - Moved in 1995 to 1998 (%) - Asian
Year householder moved into unit - Moved in 1995 to 1998 (%) - Hispanic or Latino
Year householder moved into unit - Moved in 1995 to 1998 (%) - American Indian and Alaska Native
Year householder moved into unit - Moved in 1995 to 1998 (%) - Multirace
Year householder moved into unit - Moved in 1995 to 1998 (%) - Other Race
Year householder moved into unit - Moved in 1990 to 1994 (%)
Year householder moved into unit - Moved in 1990 to 1994 (%) - White
Year householder moved into unit - Moved in 1990 to 1994 (%) - Black or African American
Year householder moved into unit - Moved in 1990 to 1994 (%) - Asian
Year householder moved into unit - Moved in 1990 to 1994 (%) - Hispanic or Latino
Year householder moved into unit - Moved in 1990 to 1994 (%) - American Indian and Alaska Native
Year householder moved into unit - Moved in 1990 to 1994 (%) - Multirace
Year householder moved into unit - Moved in 1990 to 1994 (%) - Other Race
Year householder moved into unit - Moved in 1980 to 1989 (%)
Year householder moved into unit - Moved in 1980 to 1989 (%) - White
Year householder moved into unit - Moved in 1980 to 1989 (%) - Black or African American
Year householder moved into unit - Moved in 1980 to 1989 (%) - Asian
Year householder moved into unit - Moved in 1980 to 1989 (%) - Hispanic or Latino
Year householder moved into unit - Moved in 1980 to 1989 (%) - American Indian and Alaska Native
Year householder moved into unit - Moved in 1980 to 1989 (%) - Multirace
Year householder moved into unit - Moved in 1980 to 1989 (%) - Other Race
Year householder moved into unit - Moved in 1970 to 1979 (%)
Year householder moved into unit - Moved in 1970 to 1979 (%) - White
Year householder moved into unit - Moved in 1970 to 1979 (%) - Black or African American
Year householder moved into unit - Moved in 1970 to 1979 (%) - Asian
Year householder moved into unit - Moved in 1970 to 1979 (%) - Hispanic or Latino
Year householder moved into unit - Moved in 1970 to 1979 (%) - American Indian and Alaska Native
Year householder moved into unit - Moved in 1970 to 1979 (%) - Multirace
Year householder moved into unit - Moved in 1970 to 1979 (%) - Other Race
Year householder moved into unit - Moved in 1969 or earlier (%)
Year householder moved into unit - Moved in 1969 or earlier (%) - White
Year householder moved into unit - Moved in 1969 or earlier (%) - Black or African American
Year householder moved into unit - Moved in 1969 or earlier (%) - Asian
Year householder moved into unit - Moved in 1969 or earlier (%) - Hispanic or Latino
Year householder moved into unit - Moved in 1969 or earlier (%) - American Indian and Alaska Native
Year householder moved into unit - Moved in 1969 or earlier (%) - Multirace
Year householder moved into unit - Moved in 1969 or earlier (%) - Other Race
Housing units lacking complete plumbing facilities (%)
Housing units lacking complete kitchen facilities (%)
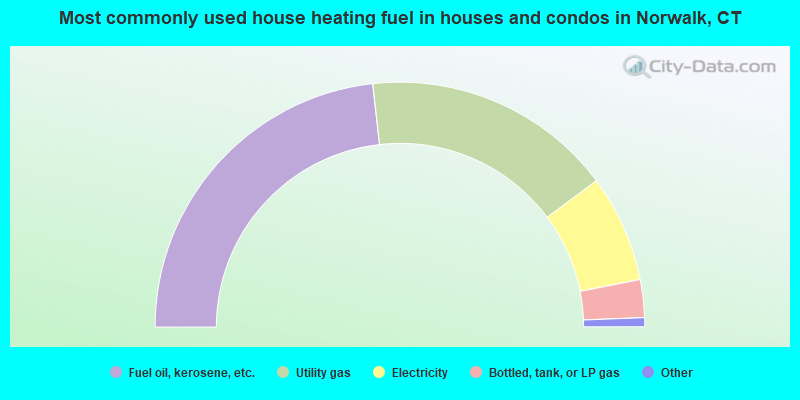
House heating fuel used in houses and condos - Utility gas (%)
House heating fuel used in houses and condos - Bottled, tank, or LP gas (%)
House heating fuel used in houses and condos - Electricity (%)
House heating fuel used in houses and condos - Fuel oil, kerosene, etc. (%)
House heating fuel used in houses and condos - Coal or coke (%)
House heating fuel used in houses and condos - Wood (%)
House heating fuel used in houses and condos - Solar energy (%)
House heating fuel used in houses and condos - Other fuel (%)
House heating fuel used in houses and condos - No fuel used (%)
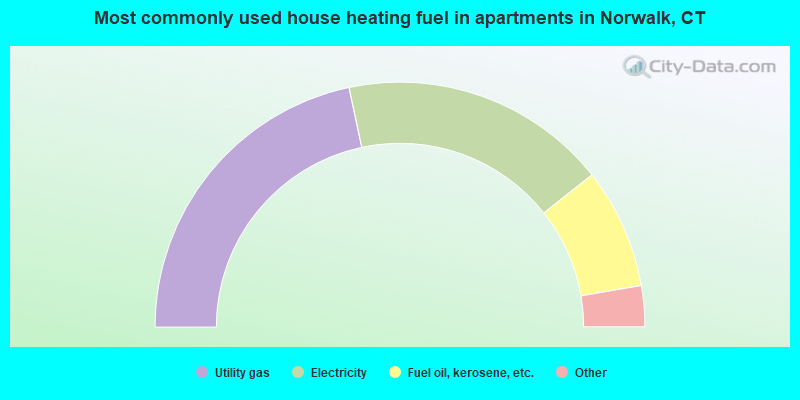
House heating fuel used in apartments - Utility gas (%)
House heating fuel used in apartments - Bottled, tank, or LP gas (%)
House heating fuel used in apartments - Electricity (%)
House heating fuel used in apartments - Fuel oil, kerosene, etc. (%)
House heating fuel used in apartments - Coal or coke (%)
House heating fuel used in apartments - Wood (%)
House heating fuel used in apartments - Solar energy (%)
House heating fuel used in apartments - Other fuel (%)
House heating fuel used in apartments - No fuel used (%)
Latest news about housing in Norwalk, CT collected exclusively by city-data.com from local newspapers, TV, and radio stations
Median year house/condo built: 1959Median year apartment built: 1977Household type by relationship:
Households: 91,381
Male householders: 17,068 (4,386 living alone ), Female householders: 19,081 (6,682 living alone )16,301 spouses (16,089 opposite-sex spouses ), 2,993 unmarried partners , (2,819 opposite-sex unmarried partners ), 24,130 children (23,311 natural , 157 adopted , 662 stepchildren ), 376 grandchildren , 1,758 brothers or sisters , 2,366 parents , 0 foster children , 4,126 other relatives , 2,669 non-relatives In group quarters: 513
Size of family households: 10,335 2-persons , 4,913 3-persons , 3,103 4-persons , 2,595 5-persons , 1,155 6-persons , 681 7-or-more-persons .
Size of nonfamily households: 11,068 1-person , 1,925 2-persons , 305 3-persons , 69 4-persons .
10,654 married couples with children. single-parent households (1,228 men , 3,084 women ).
62.3% of residents of Norwalk speak English at home. of residents speak Spanish at home (44% speak English very well , 25% speak English well , 22% speak English not well , 9% don't speak English at all ).of residents speak other Indo-European language at home (70% speak English very well , 23% speak English well , 6% speak English not well , 1% don't speak English at all ).of residents speak Asian or Pacific Island language at home (66% speak English very well , 21% speak English well , 12% speak English not well , 1% don't speak English at all ).of residents speak other language at home (83% speak English very well , 9% speak English well , 9% speak English not well ).
Foreign born population: 27,301 (29.9%)of them are naturalized citizens )
Median number of rooms in houses and condos:
Median number of rooms in apartments
Owner-occupied Renter-occupied
Rooms in owner-occupied houses in Norwalk, Connecticut
0 1 room 0 2 rooms 486 3 rooms 1,658 4 rooms 2,233 5 rooms 4,619 6 rooms 3,110 7 rooms 2,812 8 rooms 4,235 9+ rooms
Rooms in renter-occupied apartments in Norwalk, Connecticut
1,211 1 room 2,820 2 rooms 3,832 3 rooms 4,265 4 rooms 2,104 5 rooms 1,422 6 rooms 434 7 rooms 183 8 rooms 725 9+ rooms
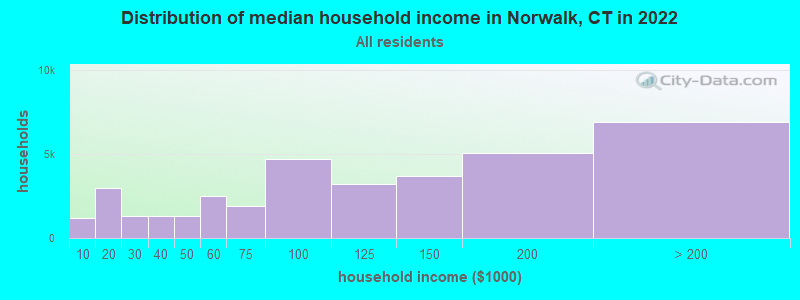
Norwalk, CT household income distribution 1,197 Less than $10,0002,985 $10,000 to $19,9991,307 $20,000 to $29,9991,336 $30,000 to $39,9991,335 $40,000 to $49,9992,518 $50,000 to $59,9991,885 $60,000 to $74,9994,717 $75,000 to $99,9993,233 $100,000 to $124,9993,668 $125,000 to $149,9995,066 $150,000 to $199,9996,902 $200,000 or more
Home value of owner - occupied houses in 2022 in Norwalk, CT 300 Less than $10,00015 $10,000 to $14,99986 $20,000 to $24,999117 $25,000 to $29,99918 $30,000 to $34,9997 $35,000 to $39,99950 $40,000 to $49,9993 $50,000 to $59,99914 $70,000 to $79,99913 $80,000 to $89,99911 $90,000 to $99,999103 $100,000 to $124,99916 $125,000 to $149,999104 $150,000 to $174,999120 $175,000 to $199,999515 $200,000 to $249,9991,112 $250,000 to $299,9993,185 $300,000 to $399,9994,684 $400,000 to $499,9996,774 $500,000 to $749,9992,602 $750,000 to $999,999861 $1,000,000 to $1,499,999448 $1,500,000 to $1,999,999392 $2,000,000 or moreRent paid by renters in 2022 in Norwalk, CT 296 Less than $100113 $100 to $149123 $150 to $199158 $200 to $24969 $250 to $299149 $300 to $349219 $350 to $399101 $400 to $44935 $450 to $499343 $500 to $549281 $550 to $59955 $600 to $64968 $650 to $69985 $700 to $749114 $750 to $799186 $800 to $899290 $900 to $9991,603 $1,000 to $1,2491,632 $1,250 to $1,4994,245 $1,500 to $1,9992,582 $2,000 to $2,4991,414 $2,500 to $2,999570 $3,000 to $3,499706 $3,500 or more547 No cash rent
Percentage of workers working in this county: 82.4%Number of people working at home: 7,213 (14.4% of all workers )
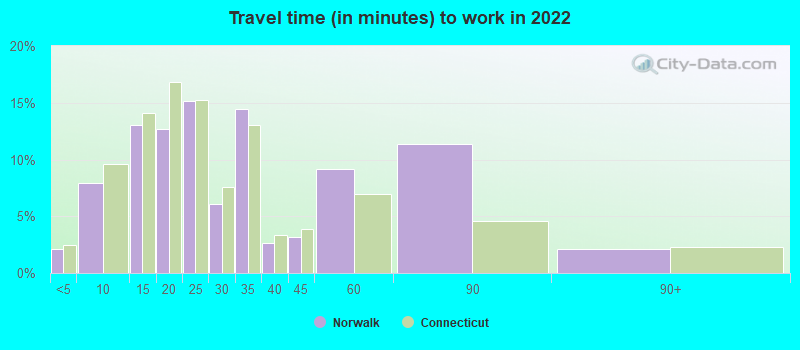
Travel time to work (commute)
Less than 5 minutes: 1,2745 to 9 minutes: 3,90410 to 14 minutes: 6,97815 to 19 minutes: 7,42720 to 24 minutes: 7,03925 to 29 minutes: 2,39530 to 34 minutes: 5,32135 to 39 minutes: 35740 to 44 minutes: 1,64745 to 59 minutes: 3,38160 to 89 minutes: 3,28490 or more minutes: 1,809
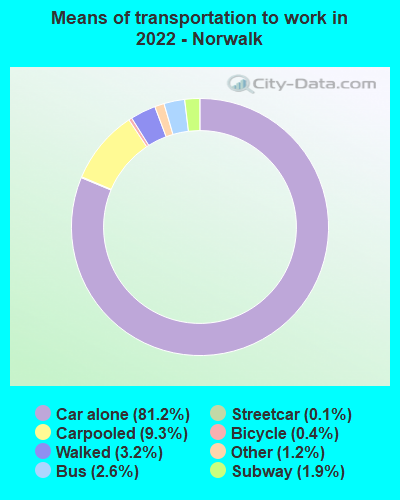
Means of transportation to work:
Drove a car alone: 30,264 (67.4%)Carpooled: 3,677 (8.2%)Bus : 962 (2.1%)Subway or elevated rail : 96 (0.2%)Long-distance train or commuter rail : 507 (1.1%)Light rail, streetcar or trolley : 37 (0.1%)Ferryboat: 14 (0.0%)Taxi: 536 (1.2%)Bicycle: 134 (0.3%)Walked: 1,292 (2.9%)Worked at home: 7,213 (16.1%)
Unemployment by race in 2022
Unemployment rate for White non-Hispanic residents 3.0% Males4.9% FemalesUnemployment rate for Black residents 1.2% MalesUnemployment rate for American Indian and Alaska Native residents 6.5% MalesUnemployment rate for Asian residents 1.5% Males5.2% FemalesUnemployment rate for other race residents 6.9% Males9.0% FemalesUnemployment rate for two or more race residents 6.3% Males6.8% FemalesUnemployment rate for Hispanic or Latino residents 5.3% Males12.2% Females
Year of entry for the foreign-born population in Norwalk, Connecticut
7,976 2010 or later 8,490 2000 to 2009 4,859 1990 to 1999 4,295 1980 to 1989 2,235 1970 to 1979 3,036 Before 1970
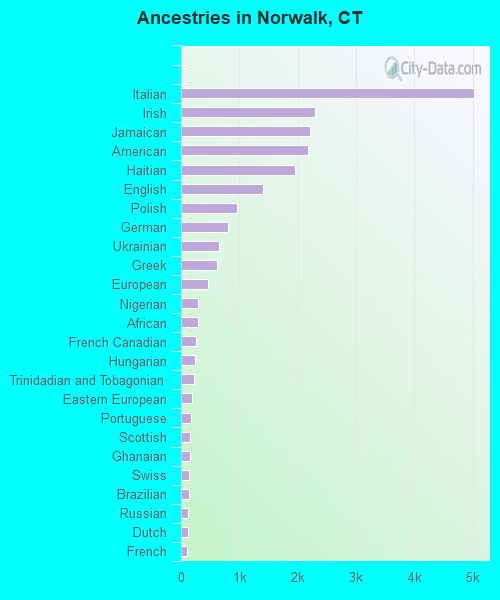
First ancestries reported:
Italian: 5,031 (10.2%)
Irish: 2,302 (4.7%)
Jamaican: 2,214 (4.5%)
American: 2,174 (4.4%)
Haitian: 1,956 (4.0%)
English: 1,409 (2.9%)
Polish: 962 (1.9%)
German: 812 (1.6%)
Ukrainian: 658 (1.3%)
Greek: 620 (1.3%)
European: 456 (0.9%)
Nigerian: 290 (0.6%)
African: 284 (0.6%)
French Canadian: 259 (0.5%)
Hungarian: 238 (0.5%)
Trinidadian and Tobagonian: 228 (0.5%)
Eastern European: 191 (0.4%)
Portuguese: 172 (0.3%)
Scottish: 161 (0.3%)
Ghanaian: 149 (0.3%)
Swiss: 142 (0.3%)
Brazilian: 135 (0.3%)
Russian: 127 (0.3%)
Dutch: 119 (0.2%)
French: 110 (0.2%)
Norwegian: 86 (0.2%)
Bahamian: 79 (0.2%)
Danish: 78 (0.2%)
Austrian: 77 (0.2%)
Canadian: 77 (0.2%)
Albanian: 76 (0.2%)
British: 75 (0.2%)
Sierra Leonean: 69 (0.1%)
Scotch-Irish: 66 (0.1%)
Romanian: 63 (0.1%)
Palestinian: 61 (0.1%)
British West Indian: 60 (0.1%)
Barbadian: 60 (0.1%)
Swedish: 53 (0.1%)
Turkish: 47 (0.10%)
Croatian: 40 (0.08%)
Iranian: 39 (0.08%)
Northern European: 32 (0.06%)
Guyanese: 29 (0.06%)
Lithuanian: 29 (0.06%)
Ethiopian: 23 (0.05%)
Celtic: 23 (0.05%)
Slovak: 20 (0.04%)
Scandinavian: 20 (0.04%)
Serbian: 20 (0.04%)
Syrian: 20 (0.04%)
Liberian: 19 (0.04%)
Latvian: 17 (0.03%)
Bulgarian: 16 (0.03%)
Macedonian: 15 (0.03%)
Belgian: 15 (0.03%)
Finnish: 14 (0.03%)
Moroccan: 14 (0.03%)
Lebanese: 14 (0.03%)
Armenian: 12 (0.02%)
Czech: 10 (0.02%)
Cypriot: 7 (0.01%)
South African: 5 (0.01%)
Most common places of birth for foreign-born residents (%): Honduras Norwalk:
9.9% (2,818)Connecticut:
1.3% (7,220)
Mexico Norwalk:
9.3% (2,647)Connecticut:
4.8% (25,802)
Colombia Norwalk:
9.2% (2,633)Connecticut:
3.3% (18,124)
Jamaica Norwalk:
8.4% (2,405)Connecticut:
7.5% (40,568)
Guatemala Norwalk:
6.5% (1,867)Connecticut:
3.2% (17,617)
Haiti Norwalk:
5.9% (1,673)Connecticut:
2.4% (12,881)
Dominican Republic Norwalk:
5.2% (1,476)Connecticut:
5.0% (27,361)
Ecuador Norwalk:
4.5% (1,297)Connecticut:
4.4% (24,026)
Costa Rica Norwalk:
4.4% (1,267)Connecticut:
0.5% (2,715)
India Norwalk:
3.4% (964)Connecticut:
7.3% (39,879)
China, excluding Hong Kong and Taiwan Norwalk:
2.8% (788)Connecticut:
4.4% (24,001)
Venezuela Norwalk:
2.6% (739)Connecticut:
0.7% (3,904)
Peru Norwalk:
2.3% (651)Connecticut:
2.5% (13,591)
Italy Norwalk:
1.9% (552)Connecticut:
2.8% (15,141)
Poland Norwalk:
1.7% (489)Connecticut:
4.0% (21,729)
Place of birth for U.S.-born residents:
This state: 37,659Other state: 24,678Northeast: 16,338Midwest: 2,103South: 5,673West: 564 88.3% of Norwalk residents lived in the same house 1 years ago.
Out of people who lived in different houses, 32.3% lived in this county.
Out of people who lived in different counties, 38.5% lived in Connecticut.
Norwalk:
88.3%State average:
88.4%
Education attainment for males 25 years and older:
No schooling: 684Nursery to 4th grade: 445th and 6th grade: 8087th and 8th grade: 6879th grade: 36010th grade: 3911th grade: 012th grade, no diploma: 377High school graduate (or equivalency): 8,810Less than 1 year of college: 2,368Some college more than 1 year, no degree: 3,130Associate degree: 2,512Bachelor's degree: 8,527Master's degree: 4,447Professional school degree: 711Doctorate degree: 798
Education attainment for females 25 years and older:
No schooling: 390Nursery to 4th grade: 1805th and 6th grade: 7247th and 8th grade: 2709th grade: 19610th grade: 32311th grade: 7012th grade, no diploma: 418High school graduate (or equivalency): 7,009Less than 1 year of college: 1,480Some college more than 1 year, no degree: 4,174Associate degree: 4,211Bachelor's degree: 8,744Master's degree: 4,729Professional school degree: 889Doctorate degree: 641
Housing units in structures:
One, detached: 17,940One, attached: 3,032Two: 3,8523 or 4: 4,7075 to 9: 1,73110 to 19: 1,73820 to 49: 2,67150 or more: 3,130Mobile homes: 116Housing units lacking complete plumbing facilities in 2022: 1.0%Housing units lacking complete kitchen facilities in 2022: 0.8%House/condo owner moved in on average 14 years ago
Renter moved in on average 3 years ago
Private vs. public school enrollment:
Students in private schools in grades 1 to 8 (elementary and middle school): 382 Here:
5.6%Connecticut:
9.5%
Students in private schools in grades 9 to 12 (high school): 897 Here:
19.1%Connecticut:
12.9%
Students in private undergraduate colleges: 1,810 Here:
36.7%Connecticut:
35.5%