North St. Paul, MN (Minnesota) Houses and Residents
| North St. Paul: | $293,610 |
| Minnesota: | $314,600 |
Total population: 12,224 (Urban population: 11,934, Rural population: 0)
Houses: 4,865 (4,778 occupied: 3,111 owner occupied, 1,660 renter occupied)
| % of renters here: | 35% |
| State: | 28% |
Housing density: 1,685 houses/condos per square mile
Median price asked for vacant for-sale houses and condos in 2022 in this county: $369,274.
Median contract rent in 2022: $1,134 (lower quartile is $936, upper quartile is $1,266)
Median rent asked for vacant for-rent units in 2022: $1,296
Median gross rent in North St. Paul, MN in 2022: $1,254
Housing units in North St. Paul with a mortgage: 2,082 (214 second mortgage, 0 home equity loan, 163 both second mortgage and home equity loan)
Houses without a mortgage: 40
Median household income for houses/condos with a mortgage: $90,844
Median household income for apartments without a mortgage: $80,365
Median monthly housing costs: $1,357
Compare current foreclosures near North St. Paul, MN:
| Photo | Address | Area | Beds / Baths | Price | Details |
|---|---|---|---|---|---|

|
#1
Saint Croix Ave W
Stillwater, MN 55082
|
2,314 sq. feet
|
2 baths 2 beds |
$311,000
|
show details |

|
#2
Granite St
Saint Paul, MN 55117
|
2,136 sq. feet
|
2 baths 4 beds |
$172,000
|
show details |

|
#3
W 44th St Apt 7
Minneapolis, MN 55410
|
710 sq. feet
|
1 baths 2 beds |
$147,500
|
show details |

|
#4
Groveland Ave Apt 1708
Minneapolis, MN 55403
|
739 sq. feet
|
1 baths 1 beds |
$93,100
|
show details |

|
#5
76th Street E. Unit
Inver Grove Heights, MN 55076
|
1,048 sq. feet
|
2 baths 2 beds |
$219,900
|
show details |

|
#6
1st Ave S
Minneapolis, MN 55408
|
1,932 sq. feet
|
2 baths 3 beds |
$344,900
|
show details |

|
#7
Charles Ave
Saint Paul, MN 55103
|
906 sq. feet
|
1 baths 2 beds |
$224,500
|
show details |

|
#8
26th Ave S
Minneapolis, MN 55406
|
1,232 sq. feet
|
1 baths 2 beds |
$309,900
|
show details |

|
#9
Wacouta St Unit Unit Gl-D
Saint Paul, MN 55101
|
- sq. feet
|
1 baths 1 beds |
$179,900
|
show details |

|
#10
Rice Creek Ter
Saint Paul, MN 55112
|
2,248 sq. feet
|
2 baths 4 beds |
show details |
| Photo | Address | Area | Beds / Baths | Price | Details |
|---|---|---|---|---|---|

|
#11
Hillwood Dr E
Saint Paul, MN 55119
|
1,429 sq. feet
|
2 baths 2 beds |
show details | |

|
#12
Arthur St NE
Minneapolis, MN 55432
|
1,174 sq. feet
|
2 baths 3 beds |
show details | |

|
#13
Arthur St NE
Minneapolis, MN 55432
|
1,174 sq. feet
|
2 baths 3 beds |
show details | |

|
#14
Hurley Ave E
Saint Paul, MN 55118
|
1,041 sq. feet
|
1 baths 2 beds |
show details | |

|
#15
Oliver Ave N
Minneapolis, MN 55411
|
1,285 sq. feet
|
1 baths 2 beds |
show details | |

|
#16
White Bear Pkwy # 2107
Saint Paul, MN 55110
|
941 sq. feet
|
1 baths 2 beds |
show details | |

|
#17
Margaret St
Saint Paul, MN 55106
|
1,275 sq. feet
|
1 baths 3 beds |
show details | |

|
#18
Oliver Ave N
Minneapolis, MN 55412
|
1,516 sq. feet
|
1 baths 3 beds |
show details | |

|
#19
Rosemary Curv
Hudson, WI 54016
|
1,659 sq. feet
|
2 baths 3 beds |
show details | |

|
#20
94th Ave NE
Minneapolis, MN 55434
|
1,044 sq. feet
|
2 baths 2 beds |
show details |
| Photo | Address | Area | Beds / Baths | Price | Details |
|---|---|---|---|---|---|

|
#21
Oliver Ave N
Minneapolis, MN 55411
|
1,012 sq. feet
|
1 baths 2 beds |
show details | |

|
#22
Newton Ave N
Minneapolis, MN 55411
|
1,380 sq. feet
|
1 baths 3 beds |
show details | |

|
#23
Hyde Ave S
Cottage Grove, MN 55016
|
998 sq. feet
|
2 baths 3 beds |
show details | |

|
#24
Hawthorne Ave E
Saint Paul, MN 55130
|
1,050 sq. feet
|
3 baths 3 beds |
show details | |

|
#25
Newton Ave N
Minneapolis, MN 55412
|
828 sq. feet
|
1 baths 2 beds |
show details | |

|
#26
Sherrie Ln
Saint Paul, MN 55125
|
1,002 sq. feet
|
1 baths 3 beds |
show details | |

|
#27
Center Rd
Circle Pines, MN 55014
|
825 sq. feet
|
2 baths 2 beds |
show details | |

|
#28
Edmund Ave
Saint Paul, MN 55104
|
2,132 sq. feet
|
2 baths 4 beds |
show details | |

|
#29
63rd Ln
Minneapolis, MN 55430
|
1,089 sq. feet
|
1 baths 2 beds |
show details | |

|
#30
Logan Ave N
Minneapolis, MN 55411
|
1,708 sq. feet
|
2 baths 4 beds |
show details |
| Photo | Address | Area | Beds / Baths | Price | Details |
|---|---|---|---|---|---|

|
#31
Canabury Dr Apt 309
Saint Paul, MN 55117
|
1,251 sq. feet
|
2 baths 2 beds |
show details | |

|
#32
E Danube Rd
Minneapolis, MN 55432
|
2,063 sq. feet
|
4 baths 4 beds |
show details | |

|
#33
Frattalone Ln
Saint Paul, MN 55117
|
1,825 sq. feet
|
3 baths 2 beds |
show details | |

|
#34
94th Ave NE
Minneapolis, MN 55434
|
1,044 sq. feet
|
2 baths 3 beds |
show details | |

|
#35
Gladstone Cir
Circle Pines, MN 55014
|
1,092 sq. feet
|
2 baths 3 beds |
show details | |

|
#36
Newton Ave N
Minneapolis, MN 55412
|
770 sq. feet
|
1 baths 3 beds |
show details | |

|
#37
Jessamine Ave E
Saint Paul, MN 55106
|
1,379 sq. feet
|
1 baths 3 beds |
show details | |

|
#38
Newton Ave N
Minneapolis, MN 55412
|
931 sq. feet
|
1 baths 2 beds |
show details | |

|
#39
Gladstone Cir
Circle Pines, MN 55014
|
1,272 sq. feet
|
1 baths 3 beds |
show details | |

|
#40
5th St E
Saint Paul, MN 55106
|
1,496 sq. feet
|
3 baths 3 beds |
show details |
| Photo | Address | Area | Beds / Baths | Price | Details |
|---|---|---|---|---|---|

|
#41
Penn Ave N
Minneapolis, MN 55412
|
846 sq. feet
|
1 baths 2 beds |
show details | |

|
#42
74th St E
Inver Grove Heights, MN 55076
|
2,232 sq. feet
|
2 baths 5 beds |
show details | |

|
#43
Penn Ave N
Minneapolis, MN 55411
|
1,089 sq. feet
|
1 baths 3 beds |
show details | |

|
#44
Hallam Curv
Saint Paul, MN 55115
|
1,614 sq. feet
|
2 baths 3 beds |
show details | |

|
#45
5th St E
Saint Paul, MN 55119
|
1,176 sq. feet
|
1 baths 3 beds |
show details | |

|
#46
Juliet Dr
Saint Paul, MN 55125
|
1,084 sq. feet
|
2 baths 2 beds |
show details | |

|
#47
Reaney Ave
Saint Paul, MN 55106
|
1,376 sq. feet
|
2 baths 4 beds |
show details | |

|
#48
Humboldt Ave N
Minneapolis, MN 55430
|
1,012 sq. feet
|
1 baths 2 beds |
show details | |

|
#49
Goodview Ave S
Cottage Grove, MN 55016
|
2,793 sq. feet
|
4 baths 6 beds |
show details | |

|
Check over 1 million property listings on Foreclosure.com!
|
browse all offers | |||


Median year apartment built: 1975
Household type by relationship:
Households: 12,219- Male householders: 2,001 (570 living alone), Female householders: 2,573 (738 living alone)
1,801 spouses (1,790 opposite-sex spouses), 496 unmarried partners, (481 opposite-sex unmarried partners), 4,073 children (3,849 natural, 0 adopted, 223 stepchildren), 165 grandchildren, 460 brothers or sisters, 289 parents, 0 foster children, 92 other relatives, 177 non-relatives
- In group quarters: 88
Size of family households: 1,349 2-persons, 759 3-persons, 423 4-persons, 350 5-persons, 80 6-persons, 164 7-or-more-persons.
Size of nonfamily households: 1,343 1-person, 289 2-persons, 8 3-persons, 4 4-persons.
1,382 married couples with children.
1,462 single-parent households (254 men, 1,208 women).
77.2% of residents of North St. Paul speak English at home.
4.1% of residents speak Spanish at home (56% speak English very well, 36% speak English well, 8% speak English not well).
3.6% of residents speak other Indo-European language at home (29% speak English very well, 64% speak English well, 6% speak English not well).
14.3% of residents speak Asian or Pacific Island language at home (57% speak English very well, 23% speak English well, 19% speak English not well, 1% don't speak English at all).
1.9% of residents speak other language at home (91% speak English very well, 9% speak English well).
Foreign born population: 1,299 (10.6%)
(67.7% of them are naturalized citizens)
| Here: | 6.7 |
| State: | 7.1 |
| Here: | 4.0 |
| State: | 3.8 |

- Bedrooms in owner-occupied houses and condos in North St. Paul, Minnesota
- 0no bedroom
- 251 bedroom
- 4552 bedrooms
- 1,4763 bedrooms
- 8944 bedrooms
- 2635+ bedrooms

- Bedrooms in renter-occupied apartments in North St. Paul, Minnesota
- 29no bedroom
- 5111 bedroom
- 7812 bedrooms
- 2733 bedrooms
- 664 bedrooms
- 05+ bedrooms

- Cars and other vehicles available in North St. Paul in owner-occupied houses/condos
- 101no vehicle
- 5501 vehicle
- 1,4162 vehicles
- 5353 vehicles
- 4144 vehicles
- 955+ vehicles

- Cars and other vehicles available in North St. Paul in renter-occupied apartments
- 280no vehicle
- 8911 vehicle
- 3882 vehicles
- 523 vehicles
- 414 vehicles
- 95+ vehicles

- Rooms in owner-occupied houses in North St. Paul, Minnesota
- 01 room
- 02 rooms
- 403 rooms
- 1884 rooms
- 3985 rooms
- 7846 rooms
- 6237 rooms
- 4348 rooms
- 6459+ rooms

- Rooms in renter-occupied apartments in North St. Paul, Minnesota
- 191 room
- 602 rooms
- 4003 rooms
- 7194 rooms
- 1885 rooms
- 1456 rooms
- 857 rooms
- 358 rooms
- 99+ rooms


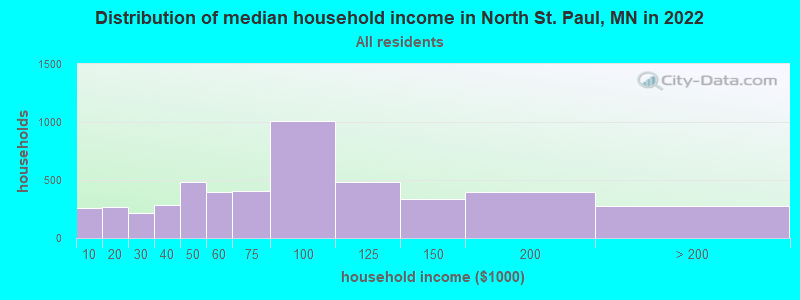
North St. Paul, MN household income distribution

- 262Less than $10,000
- 267$10,000 to $19,999
- 215$20,000 to $29,999
- 288$30,000 to $39,999
- 486$40,000 to $49,999
- 394$50,000 to $59,999
- 401$60,000 to $74,999
- 1,012$75,000 to $99,999
- 479$100,000 to $124,999
- 336$125,000 to $149,999
- 398$150,000 to $199,999
- 274$200,000 or more
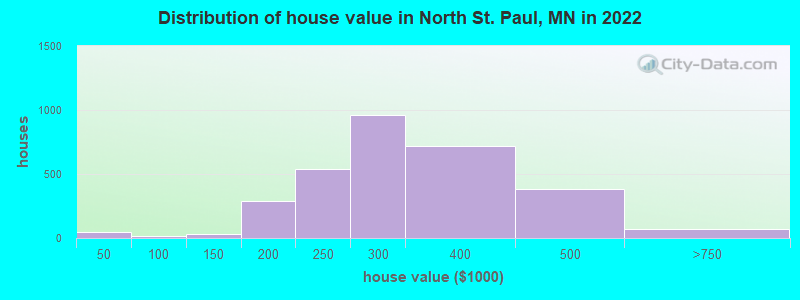
Home value of owner - occupied houses in 2022 in North St. Paul, MN
-
- 3$10,000 to $14,999
- 4$20,000 to $24,999
- 6$25,000 to $29,999
- 34$30,000 to $34,999
- 11$50,000 to $59,999
- 22$100,000 to $124,999
- 6$125,000 to $149,999
- 97$150,000 to $174,999
- 190$175,000 to $199,999
- 542$200,000 to $249,999
- 961$250,000 to $299,999
- 720$300,000 to $399,999
- 378$400,000 to $499,999
- 71$500,000 to $749,999
Rent paid by renters in 2022 in North St. Paul, MN
-
- 32$150 to $199
- 17$200 to $249
- 5$250 to $299
- 7$300 to $349
- 85$350 to $399
- 25$400 to $449
- 33$450 to $499
- 6$550 to $599
- 75$650 to $699
- 21$750 to $799
- 77$800 to $899
- 125$900 to $999
- 673$1,000 to $1,249
- 295$1,250 to $1,499
- 113$1,500 to $1,999
- 19$2,000 to $2,499
- 12$3,500 or more
- 28No cash rent


Percentage of workers working in this county: 56.3%
Number of people working at home: 532 (8.7% of all workers)
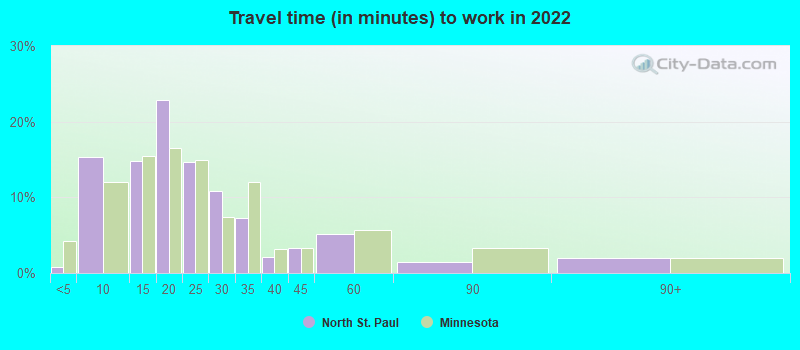
Travel time to work (commute)
- Less than 5 minutes: 71
- 5 to 9 minutes: 218
- 10 to 14 minutes: 1,071
- 15 to 19 minutes: 1,205
- 20 to 24 minutes: 904
- 25 to 29 minutes: 625
- 30 to 34 minutes: 535
- 35 to 39 minutes: 137
- 40 to 44 minutes: 255
- 45 to 59 minutes: 310
- 60 to 89 minutes: 93
- 90 or more minutes: 0
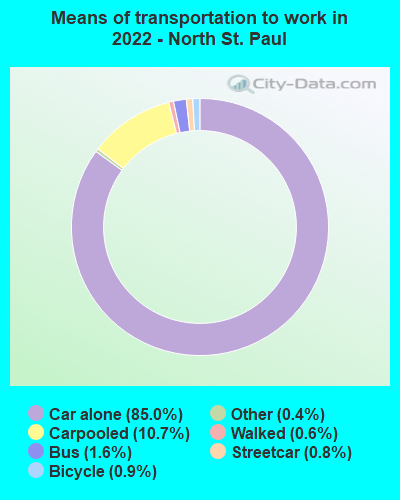
Means of transportation to work:
- Drove a car alone: 2,529 (72.0%)
- Carpooled: 319 (9.1%)
- Bus: 40 (1.1%)
- Subway or elevated rail: 29 (0.8%)
- Taxi: 19 (0.5%)
- Bicycle: 19 (0.5%)
- Walked: 18 (0.5%)
- Worked at home: 532 (15.2%)

- Unemployment by race in 2022
- Unemployment rate for White non-Hispanic residents
- 3.2%Males
- 1.7%Females
- Unemployment rate for Black residents
- 9.3%Females
- Unemployment rate for Asian residents
- 14.1%Males
- Unemployment rate for other race residents
- 0.8%Males
- Unemployment rate for two or more race residents
- 4.7%Males
- 8.4%Females
- Unemployment rate for Hispanic or Latino residents
- 1.0%Males
- 4.5%Females

- Year of entry for the foreign-born population in North St. Paul, Minnesota
- 7382010 or later
- 1622000 to 2009
- 1371990 to 1999
- 1291980 to 1989
- 241970 to 1979
- 73Before 1970

First ancestries reported:
- German: 728 (14.5%)
- American: 224 (4.5%)
- Scandinavian: 171 (3.4%)
- Ethiopian: 163 (3.2%)
- Polish: 150 (3.0%)
- Norwegian: 146 (2.9%)
- English: 133 (2.6%)
- Irish: 113 (2.3%)
- Swedish: 111 (2.2%)
- European: 93 (1.9%)
- Italian: 85 (1.7%)
- French Canadian: 77 (1.5%)
- Hungarian: 55 (1.1%)
- Nigerian: 48 (1.0%)
- Czech: 46 (0.9%)
- Eastern European: 38 (0.8%)
- French: 37 (0.7%)
- African: 35 (0.7%)
- Northern European: 30 (0.6%)
- Greek: 24 (0.5%)
- Scottish: 18 (0.4%)
- Finnish: 11 (0.2%)
- Scotch-Irish: 11 (0.2%)
- Swiss: 11 (0.2%)
- Dutch: 8 (0.2%)
- Czechoslovakian: 5 (0.10%)
Most common places of birth for foreign-born residents (%):
| North St. Paul: | 23.6% (324) |
| Minnesota: | 5.1% (24,591) |
| North St. Paul: | 23.6% (323) |
| Minnesota: | 1.8% (8,637) |
| North St. Paul: | 9.8% (135) |
| Minnesota: | 4.0% (19,333) |
| North St. Paul: | 8.4% (115) |
| Minnesota: | 5.1% (24,630) |
| North St. Paul: | 8.1% (111) |
| Minnesota: | 0.6% (3,038) |
| North St. Paul: | 7.6% (104) |
| Minnesota: | 12.1% (58,312) |
| North St. Paul: | 6.7% (92) |
| Minnesota: | 0.2% (918) |
| North St. Paul: | 4.6% (63) |
| Minnesota: | 1.7% (8,263) |
| North St. Paul: | 2.1% (29) |
| Minnesota: | 3.6% (17,119) |
| North St. Paul: | 1.7% (23) |
| Minnesota: | 3.3% (15,701) |
Place of birth for U.S.-born residents:
- This state: 8,649
- Other state: 2,002
- Northeast: 209
- Midwest: 1,009
- South: 277
- West: 510
87.5% of North St. Paul residents lived in the same house 1 years ago.
Out of people who lived in different houses, 30.1% lived in this county.
Out of people who lived in different counties, 83.8% lived in Minnesota.
| North St. Paul: | 87.5% |
| State average: | 87.4% |
Education attainment for males 25 years and older:
- No schooling: 167
- Nursery to 4th grade: 0
- 5th and 6th grade: 6
- 7th and 8th grade: 14
- 9th grade: 5
- 10th grade: 16
- 11th grade: 60
- 12th grade, no diploma: 56
- High school graduate (or equivalency): 1,328
- Less than 1 year of college: 293
- Some college more than 1 year, no degree: 408
- Associate degree: 447
- Bachelor's degree: 866
- Master's degree: 111
- Professional school degree: 27
- Doctorate degree: 30

Education attainment for females 25 years and older:
- No schooling: 228
- Nursery to 4th grade: 2
- 5th and 6th grade: 21
- 7th and 8th grade: 47
- 9th grade: 6
- 10th grade: 0
- 11th grade: 41
- 12th grade, no diploma: 52
- High school graduate (or equivalency): 911
- Less than 1 year of college: 498
- Some college more than 1 year, no degree: 465
- Associate degree: 368
- Bachelor's degree: 926
- Master's degree: 160
- Professional school degree: 188
- Doctorate degree: 40


Housing units in structures:
- One, detached: 3,131
- One, attached: 317
- Two: 73
- 3 or 4: 153
- 5 to 9: 95
- 10 to 19: 529
- 20 to 49: 381
- 50 or more: 156
- Mobile homes: 25
House/condo owner moved in on average 11 years ago
Renter moved in on average 5 years ago

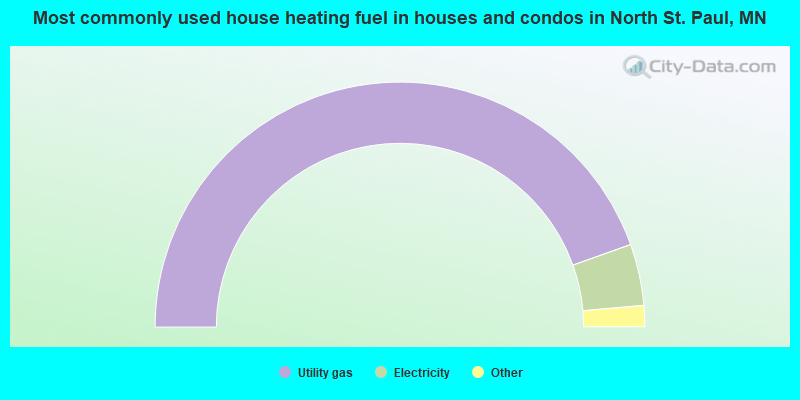
- 89.0%Utility gas
- 8.1%Electricity
- 2.4%Bottled, tank, or LP gas
- 0.5%Wood
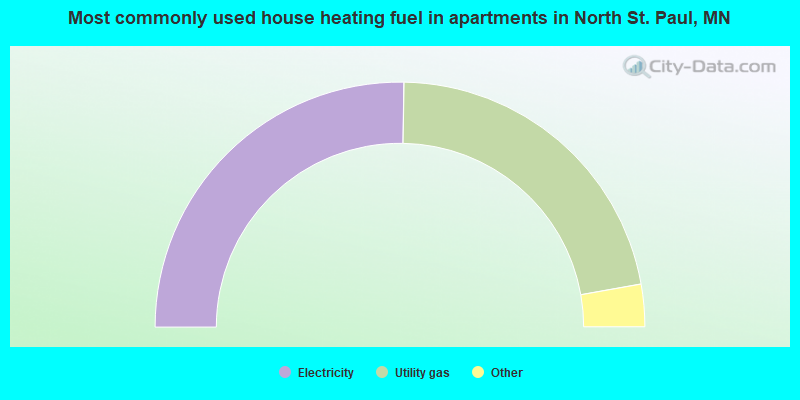
- 50.6%Electricity
- 43.9%Utility gas
- 2.2%No fuel used
- 1.6%Fuel oil, kerosene, etc.
- 1.1%Other fuel
- 0.6%Bottled, tank, or LP gas
Private vs. public school enrollment:
| Here: | 11.7% |
| Minnesota: | 12.9% |
| Here: | 1.7% |
| Minnesota: | 8.6% |
| Here: | 35.2% |
| Minnesota: | 26.2% |


