North Fort Myers, FL (Florida) Houses and Residents
| North Fort Myers: | $151,691 |
| Florida: | $354,100 |
Mean price in 2022:
Detached houses: $349,026
Here: $349,026 State: $500,941 Townhouses or other attached units: $295,089
Here: $295,089 State: $370,869 In 2-unit structures: $203,923
Here: $203,923 State: $423,188 In 3-to-4-unit structures: $177,709
Here: $177,709 State: $309,944 In 5-or-more-unit structures: $217,820
Here: $217,820 State: $447,145 Mobile homes: $92,830
Here: $92,830 State: $113,202 Occupied boats, RVs, vans, etc.: $109,543
Here: $109,543 State: $73,933
Total population: 39,407 (Urban population: 33,072, Rural population: 7,248 (124 farm, 7,124 nonfarm))
Houses: 29,661 (22,482 occupied: 19,877 owner occupied, 3,392 renter occupied)
| % of renters here: | 15% |
| State: | 33% |
Housing density: 564 houses/condos per square mile
Median price asked for vacant for-sale houses and condos in 2022: $164,414.
Median contract rent in 2022: $1,022 (lower quartile is $643, upper quartile is $1,346)
Median rent asked for vacant for-rent units in 2022: $1,449
Median gross rent in North Fort Myers, FL in 2022: $1,215
Housing units in North Fort Myers with a mortgage: 5,602 (330 second mortgage, 93 home equity loan, 257 both second mortgage and home equity loan)
Houses without a mortgage: 72
Median household income for houses/condos with a mortgage: $78,471
Median household income for apartments without a mortgage: $49,422
Median monthly housing costs: $815
Compare current foreclosures in North Fort Myers, FL:
| Photo | Address | Area | Beds / Baths | Price | Details |
|---|---|---|---|---|---|

|
#1
Morgan Jones Dr
North Fort Myers, FL 33917
|
1,344 sq. feet
|
2 baths 3 beds |
show details | |

|
#2
Betmar Blvd
North Fort Myers, FL 33903
|
990 sq. feet
|
2 baths 2 beds |
show details | |

|
#3
Golf Club Ct Apt 5
North Fort Myers, FL 33903
|
1,375 sq. feet
|
2 baths 2 beds |
show details | |

|
#4
June Pkwy
North Fort Myers, FL 33903
|
1,104 sq. feet
|
2 baths 2 beds |
show details | |

|
#5
Glenbrook Dr
North Fort Myers, FL 33917
|
1,056 sq. feet
|
2 baths 2 beds |
show details | |

|
#6
Nantucket Cir Apt 7
North Fort Myers, FL 33917
|
1,149 sq. feet
|
2 baths 2 beds |
show details | |

|
#7
Howard Rd
North Fort Myers, FL 33917
|
1,536 sq. feet
|
2 baths 3 beds |
show details | |

|
#8
Crescent Lake Dr
North Fort Myers, FL 33917
|
1,112 sq. feet
|
2 baths 2 beds |
show details | |

|
#9
Saint Clair Ave W
North Fort Myers, FL 33903
|
1,665 sq. feet
|
2 baths 3 beds |
show details | |

|
#10
Enclaves Cove Dr
North Fort Myers, FL 33917
|
1,850 sq. feet
|
2 baths 4 beds |
show details |
| Photo | Address | Area | Beds / Baths | Price | Details |
|---|---|---|---|---|---|

|
#11
Antherium Ln
North Fort Myers, FL 33917
|
1,693 sq. feet
|
2 baths 2 beds |
show details | |

|
#12
Wayzata Ct
North Fort Myers, FL 33917
|
1,969 sq. feet
|
2 baths 3 beds |
show details | |

|
#13
Channel Way
North Fort Myers, FL 33917
|
2,013 sq. feet
|
2 baths 2 beds |
show details | |

|
#14
Capitol St
North Fort Myers, FL 33903
|
950 sq. feet
|
2 baths 2 beds |
show details | |

|
#15
Brant Bay Blvd Apt 106
North Fort Myers, FL 33917
|
969 sq. feet
|
2 baths 3 beds |
show details | |

|
#16
Rose St
North Fort Myers, FL 33903
|
1,224 sq. feet
|
1 baths 2 beds |
show details | |

|
#17
Lavonia Ln
North Fort Myers, FL 33917
|
1,144 sq. feet
|
1 baths 3 beds |
show details | |

|
#18
Peyraud Dr
North Fort Myers, FL 33917
|
1,366 sq. feet
|
2 baths 2 beds |
show details | |

|
#19
Foxlake Dr
North Fort Myers, FL 33917
|
983 sq. feet
|
1 baths 2 beds |
show details | |

|
#20
Tolles Dr
North Fort Myers, FL 33917
|
1,836 sq. feet
|
2 baths 3 beds |
show details |
| Photo | Address | Area | Beds / Baths | Price | Details |
|---|---|---|---|---|---|

|
#21
Nalle Grade Rd
North Fort Myers, FL 33917
|
1,920 sq. feet
|
2 baths 3 beds |
show details | |

|
#22
Moody Rd Apt 115
North Fort Myers, FL 33903
|
1,224 sq. feet
|
2 baths 2 beds |
show details | |

|
#23
Orange Blossom Ln
North Fort Myers, FL 33903
|
920 sq. feet
|
1 baths 3 beds |
show details | |

|
#24
Cleaves Rd
North Fort Myers, FL 33903
|
920 sq. feet
|
1 baths 2 beds |
show details | |

|
#25
Mcdaniel Dr
North Fort Myers, FL 33917
|
958 sq. feet
|
1 baths 2 beds |
show details | |

|
#26
Poor Ln
North Fort Myers, FL 33917
|
1,332 sq. feet
|
2 baths 3 beds |
show details | |

|
#27
Boros Dr
North Fort Myers, FL 33903
|
1,196 sq. feet
|
2 baths 2 beds |
show details | |

|
#28
Iris Dr
North Fort Myers, FL 33903
|
2,192 sq. feet
|
3 baths 4 beds |
show details | |

|
#29
Lakeview Dr
North Fort Myers, FL 33917
|
1,358 sq. feet
|
2 baths 3 beds |
show details | |

|
#30
Villareal Way
North Fort Myers, FL 33917
|
1,183 sq. feet
|
1 baths 2 beds |
show details |
| Photo | Address | Area | Beds / Baths | Price | Details |
|---|---|---|---|---|---|

|
#31
Coachlight Ln
North Fort Myers, FL 33917
|
749 sq. feet
|
1 baths 2 beds |
show details | |

|
#32
Verona Dr
North Fort Myers, FL 33903
|
1,850 sq. feet
|
1 baths 2 beds |
show details | |

|
#33
Old Bridge Rd
North Fort Myers, FL 33917
|
1,188 sq. feet
|
2 baths 3 beds |
show details | |

|
#34
N Key Dr Apt 46
North Fort Myers, FL 33903
|
1,168 sq. feet
|
2 baths 2 beds |
show details | |

|
#35
Winston Rd
North Fort Myers, FL 33917
|
1,385 sq. feet
|
2 baths 2 beds |
show details | |

|
#36
N Key Dr Apt 46
North Fort Myers, FL 33903
|
1,168 sq. feet
|
2 baths 2 beds |
show details | |

|
#37
Penny Dr
North Fort Myers, FL 33917
|
1,444 sq. feet
|
2 baths 4 beds |
show details | |

|
#38
Slater Rd
North Fort Myers, FL 33917
|
2,008 sq. feet
|
1 baths 1 beds |
show details | |

|
#39
Nalle Grade Rd
North Fort Myers, FL 33917
|
1,920 sq. feet
|
2 baths 3 beds |
show details | |

|
#40
Hyacinth St
North Fort Myers, FL 33903
|
1,480 sq. feet
|
1 baths 3 beds |
show details |
| Photo | Address | Area | Beds / Baths | Price | Details |
|---|---|---|---|---|---|

|
#41
North Rd
North Fort Myers, FL 33917
|
1,904 sq. feet
|
2 baths 4 beds |
show details | |

|
#42
Brownell Ct
North Fort Myers, FL 33917
|
1,430 sq. feet
|
2 baths 3 beds |
show details | |

|
#43
Breeze Dr
North Fort Myers, FL 33917
|
1,358 sq. feet
|
1 baths 2 beds |
show details | |

|
#44
Frenchmans Ct
North Fort Myers, FL 33903
|
1,416 sq. feet
|
2 baths 2 beds |
show details | |

|
#45
Poetry Ln
North Fort Myers, FL 33903
|
1,714 sq. feet
|
2 baths 2 beds |
show details | |

|
#46
State St
North Fort Myers, FL 33903
|
1,808 sq. feet
|
1 baths 3 beds |
show details | |

|
#47
North Rd
North Fort Myers, FL 33917
|
1,924 sq. feet
|
2 baths 2 beds |
show details | |

|
#48
Breeze Dr
North Fort Myers, FL 33917
|
960 sq. feet
|
1 baths 2 beds |
show details | |

|
#49
E Mariana Ave
North Fort Myers, FL 33917
|
2,066 sq. feet
|
2 baths 3 beds |
show details | |

|
Check over 1 million property listings on Foreclosure.com!
|
browse all offers | |||


 | Condos/Townhouses in The Landings Fort Meyers (7 replies) |
| Cape Coral House Purchase Questions - (20 replies) |
| Buying a small house to rent out in FM -- wacky or wise? (18 replies) |
| Rivers II, Oasis, Schooner Bay condos (3 replies) |
| North Fort Myers - Buying a house? (15 replies) |
| Cape Coral versus North Fort Myers (26 replies) |

Median year apartment built: 1983
Household type by relationship:
Households: 45,216- Male householders: 11,431 (3,448 living alone), Female householders: 11,292 (5,725 living alone)
10,099 spouses (9,899 opposite-sex spouses), 1,083 unmarried partners, (1,025 opposite-sex unmarried partners), 6,526 children (6,244 natural, 89 adopted, 192 stepchildren), 406 grandchildren, 654 brothers or sisters, 1,066 parents, 38 foster children, 855 other relatives, 1,458 non-relatives
- In group quarters: 303
Size of family households: 9,645 2-persons, 1,622 3-persons, 909 4-persons, 333 5-persons, 60 6-persons, 91 7-or-more-persons.
Size of nonfamily households: 8,917 1-person, 1,450 2-persons, 170 3-persons.
2,130 married couples with children.
1,297 single-parent households (360 men, 937 women).
87.9% of residents of North Fort Myers speak English at home.
8.6% of residents speak Spanish at home (62% speak English very well, 17% speak English well, 7% speak English not well, 14% don't speak English at all).
2.4% of residents speak other Indo-European language at home (66% speak English very well, 20% speak English well, 14% speak English not well).
0.5% of residents speak Asian or Pacific Island language at home (34% speak English very well, 62% speak English well, 4% speak English not well).
0.2% of residents speak other language at home (29% speak English very well, 34% speak English well, 38% don't speak English at all).
Foreign born population: 4,244 (9.4%)
(34.9% of them are naturalized citizens)
| Here: | 4.9 |
| State: | 5.9 |
| Here: | 4.1 |
| State: | 4.2 |

- Bedrooms in owner-occupied houses and condos in North Fort Myers, Florida
- 35no bedroom
- 8821 bedroom
- 12,0312 bedrooms
- 5,6303 bedrooms
- 1,1024 bedrooms
- 1985+ bedrooms

- Bedrooms in renter-occupied apartments in North Fort Myers, Florida
- 130no bedroom
- 6751 bedroom
- 1,7222 bedrooms
- 7563 bedrooms
- 1054 bedrooms
- 55+ bedrooms

- Cars and other vehicles available in North Fort Myers in owner-occupied houses/condos
- 1,101no vehicle
- 10,7221 vehicle
- 6,3812 vehicles
- 1,0143 vehicles
- 4534 vehicles
- 2065+ vehicles

- Cars and other vehicles available in North Fort Myers in renter-occupied apartments
- 376no vehicle
- 1,8781 vehicle
- 9552 vehicles
- 1553 vehicles
- 224 vehicles
- 85+ vehicles

- Rooms in owner-occupied houses in North Fort Myers, Florida
- 311 room
- 1472 rooms
- 1,2973 rooms
- 4,7354 rooms
- 5,7855 rooms
- 3,8436 rooms
- 1,9637 rooms
- 1,3498 rooms
- 7299+ rooms

- Rooms in renter-occupied apartments in North Fort Myers, Florida
- 1191 room
- 1432 rooms
- 8533 rooms
- 8834 rooms
- 7275 rooms
- 3006 rooms
- 2477 rooms
- 298 rooms
- 929+ rooms


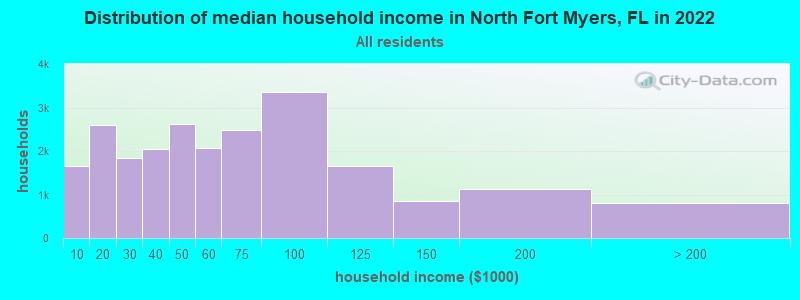
North Fort Myers, FL household income distribution

- 1,661Less than $10,000
- 2,590$10,000 to $19,999
- 1,833$20,000 to $29,999
- 2,042$30,000 to $39,999
- 2,610$40,000 to $49,999
- 2,063$50,000 to $59,999
- 2,489$60,000 to $74,999
- 3,350$75,000 to $99,999
- 1,666$100,000 to $124,999
- 862$125,000 to $149,999
- 1,136$150,000 to $199,999
- 814$200,000 or more
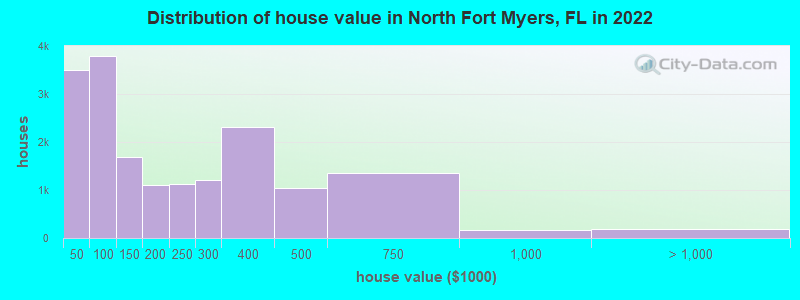
Home value of owner - occupied houses in 2022 in North Fort Myers, FL
-
- 948Less than $10,000
- 539$10,000 to $14,999
- 237$15,000 to $19,999
- 301$20,000 to $24,999
- 333$25,000 to $29,999
- 468$30,000 to $34,999
- 214$35,000 to $39,999
- 457$40,000 to $49,999
- 628$50,000 to $59,999
- 1,137$60,000 to $69,999
- 529$70,000 to $79,999
- 611$80,000 to $89,999
- 422$90,000 to $99,999
- 1,250$100,000 to $124,999
- 432$125,000 to $149,999
- 775$150,000 to $174,999
- 327$175,000 to $199,999
- 1,128$200,000 to $249,999
- 1,201$250,000 to $299,999
- 2,306$300,000 to $399,999
- 1,048$400,000 to $499,999
- 1,361$500,000 to $749,999
- 164$750,000 to $999,999
- 108$1,000,000 to $1,499,999
- 16$1,500,000 to $1,999,999
- 60$2,000,000 or more
Rent paid by renters in 2022 in North Fort Myers, FL
-
- 41Less than $100
- 66$100 to $149
- 60$150 to $199
- 264$200 to $249
- 133$250 to $299
- 29$300 to $349
- 42$350 to $399
- 69$400 to $449
- 82$500 to $549
- 56$550 to $599
- 82$600 to $649
- 44$650 to $699
- 88$700 to $749
- 87$750 to $799
- 227$800 to $899
- 155$900 to $999
- 431$1,000 to $1,249
- 329$1,250 to $1,499
- 305$1,500 to $1,999
- 134$2,000 to $2,499
- 48$2,500 to $2,999
- 10$3,000 to $3,499
- 11$3,500 or more
- 185No cash rent


Percentage of workers working in this county: 93.9%
Number of people working at home: 1,835 (11.8% of all workers)
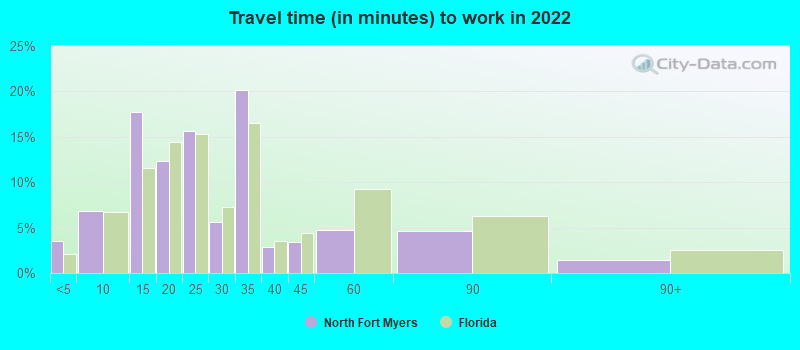
Travel time to work (commute)
- Less than 5 minutes: 466
- 5 to 9 minutes: 683
- 10 to 14 minutes: 1,372
- 15 to 19 minutes: 2,110
- 20 to 24 minutes: 2,480
- 25 to 29 minutes: 824
- 30 to 34 minutes: 2,178
- 35 to 39 minutes: 578
- 40 to 44 minutes: 618
- 45 to 59 minutes: 1,183
- 60 to 89 minutes: 634
- 90 or more minutes: 315
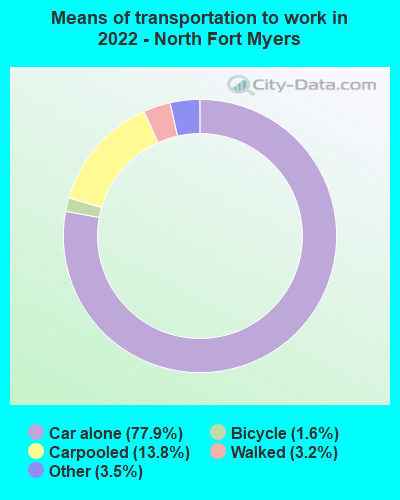
Means of transportation to work:
- Drove a car alone: 7,226 (64.2%)
- Carpooled: 1,568 (13.9%)
- Taxi: 228 (2.0%)
- Bicycle: 90 (0.8%)
- Walked: 317 (2.8%)
- Worked at home: 1,835 (16.3%)

- Unemployment by race in 2022
- Unemployment rate for White non-Hispanic residents
- 3.4%Males
- 3.2%Females
- Unemployment rate for Black residents
- 9.2%Males
- 34.0%Females
- Unemployment rate for Asian residents
- 15.5%Males
- Unemployment rate for other race residents
- 22.3%Males
- 25.2%Females
- Unemployment rate for two or more race residents
- 0.4%Males
- Unemployment rate for Hispanic or Latino residents
- 5.5%Males
- 2.1%Females

- Year of entry for the foreign-born population in North Fort Myers, Florida
- 1,6972010 or later
- 6062000 to 2009
- 6811990 to 1999
- 2171980 to 1989
- 1011970 to 1979
- 902Before 1970
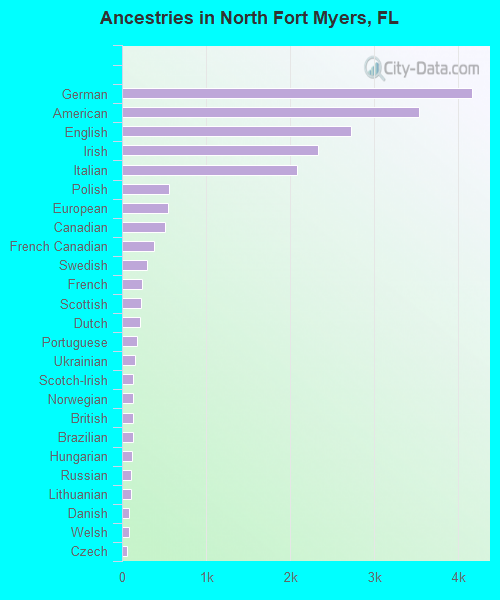
First ancestries reported:
- German: 4,156 (17.2%)
- American: 3,530 (14.6%)
- English: 2,728 (11.3%)
- Irish: 2,326 (9.6%)
- Italian: 2,081 (8.6%)
- Polish: 559 (2.3%)
- European: 552 (2.3%)
- Canadian: 509 (2.1%)
- French Canadian: 383 (1.6%)
- Swedish: 295 (1.2%)
- French: 243 (1.0%)
- Scottish: 230 (1.0%)
- Dutch: 214 (0.9%)
- Portuguese: 179 (0.7%)
- Ukrainian: 160 (0.7%)
- Scotch-Irish: 134 (0.6%)
- Norwegian: 133 (0.5%)
- British: 131 (0.5%)
- Brazilian: 127 (0.5%)
- Hungarian: 120 (0.5%)
- Russian: 109 (0.5%)
- Lithuanian: 106 (0.4%)
- Danish: 84 (0.3%)
- Welsh: 78 (0.3%)
- Czech: 59 (0.2%)
- Armenian: 56 (0.2%)
- Scandinavian: 55 (0.2%)
- Austrian: 43 (0.2%)
- Slavic: 42 (0.2%)
- Palestinian: 39 (0.2%)
- Croatian: 39 (0.2%)
- Eastern European: 38 (0.2%)
- Cajun: 37 (0.2%)
- Barbadian: 36 (0.1%)
- Greek: 35 (0.1%)
- Pennsylvania German: 28 (0.1%)
- Celtic: 27 (0.1%)
- Haitian: 27 (0.1%)
- Slovak: 20 (0.08%)
- Finnish: 19 (0.08%)
- Northern European: 16 (0.07%)
- Romanian: 16 (0.07%)
- Israeli: 16 (0.07%)
- Czechoslovakian: 15 (0.06%)
- Lebanese: 13 (0.05%)
- Swiss: 11 (0.05%)
- Belgian: 10 (0.04%)
- Slovene: 9 (0.04%)
- Maltese: 8 (0.03%)
- Jordanian: 7 (0.03%)
- Bermudan: 6 (0.02%)
- Jamaican: 2 (0.01%)
Most common places of birth for foreign-born residents (%):
| North Fort Myers: | 21.3% (824) |
| Florida: | 22.0% (1,006,576) |
| North Fort Myers: | 20.6% (798) |
| Florida: | 2.4% (109,132) |
| North Fort Myers: | 9.6% (372) |
| Florida: | 5.6% (257,152) |
| North Fort Myers: | 4.0% (154) |
| Florida: | 2.7% (122,906) |
| North Fort Myers: | 3.1% (119) |
| Florida: | 2.3% (107,160) |
| North Fort Myers: | 3.0% (116) |
| Florida: | 1.2% (54,272) |
| North Fort Myers: | 2.3% (90) |
| Florida: | 0.4% (16,570) |
| North Fort Myers: | 2.2% (86) |
| Florida: | 0.2% (9,421) |
| North Fort Myers: | 1.9% (72) |
| Florida: | 0.7% (30,755) |
| North Fort Myers: | 1.8% (70) |
| Florida: | 5.7% (262,042) |
| North Fort Myers: | 1.8% (70) |
| Florida: | 1.0% (43,642) |
| North Fort Myers: | 1.7% (65) |
| Florida: | 0.3% (13,053) |
| North Fort Myers: | 1.7% (64) |
| Florida: | 0.7% (31,076) |
Place of birth for U.S.-born residents:
- This state: 9,296
- Other state: 30,339
- Northeast: 10,847
- Midwest: 13,030
- South: 5,218
- West: 1,238
85.9% of North Fort Myers residents lived in the same house 1 years ago.
Out of people who lived in different houses, 31.5% lived in this county.
Out of people who lived in different counties, 20.8% lived in Florida.
| North Fort Myers: | 85.9% |
| State average: | 86.3% |
Education attainment for males 25 years and older:
- No schooling: 199
- Nursery to 4th grade: 250
- 5th and 6th grade: 61
- 7th and 8th grade: 154
- 9th grade: 134
- 10th grade: 245
- 11th grade: 379
- 12th grade, no diploma: 587
- High school graduate (or equivalency): 6,176
- Less than 1 year of college: 1,643
- Some college more than 1 year, no degree: 2,332
- Associate degree: 1,580
- Bachelor's degree: 2,967
- Master's degree: 807
- Professional school degree: 451
- Doctorate degree: 175

Education attainment for females 25 years and older:
- No schooling: 90
- Nursery to 4th grade: 111
- 5th and 6th grade: 164
- 7th and 8th grade: 95
- 9th grade: 612
- 10th grade: 240
- 11th grade: 217
- 12th grade, no diploma: 411
- High school graduate (or equivalency): 6,812
- Less than 1 year of college: 1,865
- Some college more than 1 year, no degree: 3,153
- Associate degree: 2,372
- Bachelor's degree: 2,325
- Master's degree: 1,330
- Professional school degree: 205
- Doctorate degree: 62


Housing units in structures:
- One, detached: 11,201
- One, attached: 775
- Two: 603
- 3 or 4: 358
- 5 to 9: 887
- 10 to 19: 501
- 20 to 49: 549
- 50 or more: 547
- Mobile homes: 14,109
- Boats, RVs, vans, etc.: 127
Median worth of mobile homes: $79,061
Housing units lacking complete kitchen facilities in 2022: 0.9%
House/condo owner moved in on average 9 years ago
Renter moved in on average 4 years ago

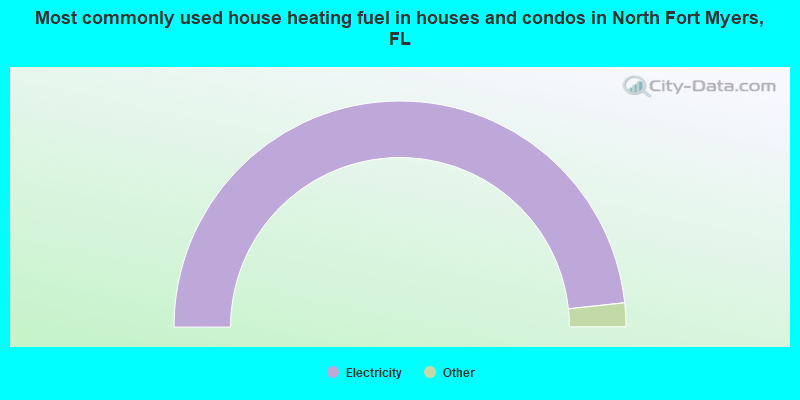
- 96.6%Electricity
- 1.5%Utility gas
- 1.2%No fuel used
- 0.4%Bottled, tank, or LP gas
- 0.1%Solar energy
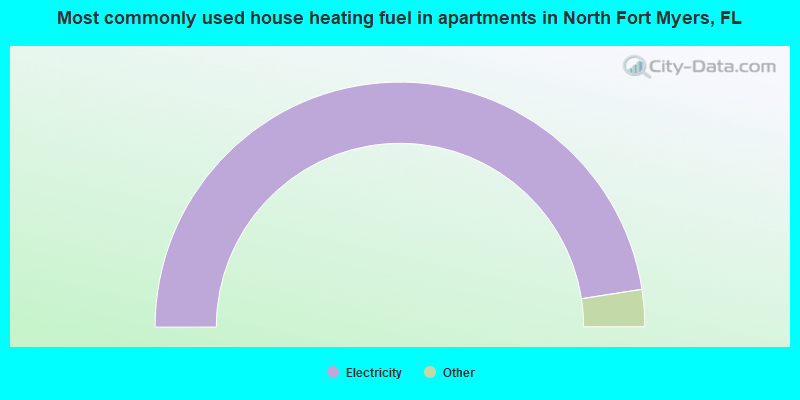
- 95.1%Electricity
- 3.9%No fuel used
- 0.6%Utility gas
- 0.4%Bottled, tank, or LP gas
Private vs. public school enrollment:
| Here: | 14.9% |
| Florida: | 15.8% |
| Here: | 12.3% |
| Florida: | 12.9% |
| Here: | 9.7% |
| Florida: | 23.6% |


