Housing density: 373 houses/condos per square mile
Median price asked for vacant for-sale houses and condos in 2022 in this county: $495,592.
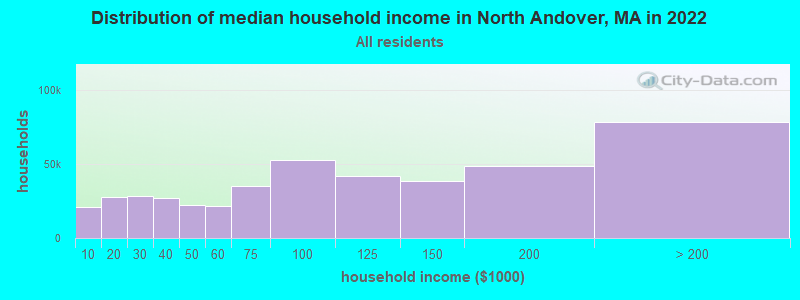
Median contract rent in 2022: over $2,000 (lower quartile is $1,327, upper quartile is over $2,000)
Median rent asked for vacant for-rent units in 2022: $1,630
Median gross rent in North Andover, MA in 2022: over $2,000
Housing units in North Andover with a mortgage: 4,398 (398 second mortgage, 580 home equity loan, 27 both second mortgage and home equity loan) Houses without a mortgage: 1,266
Compare current foreclosures near North Andover, MA:
In family households: 606,990 (122,043 male householders, 65,962 female householders)
136,841 spouses, 221,565 children (210,337 natural, 5,012 adopted, 6,216 stepchildren), 11,988 grandchildren, 7,913 brothers or sisters, 8,558 parents, foster children, 9,566 other relatives, 17,265 non-relatives
In nonfamily households: 119,697 (41,801 male householders (32,274 living alone)), 56,150 female householders (48,012 living alone)), 21,746 nonrelatives
In group quarters: 16,472 (6,766 institutionalized population)
125,244 married couples with children.
42,832 single-parent households (7,363 men, 35,469 women).
87.6% of residents of North Andover speak English at home.
1.9% of residents speak Spanish at home (70% speak English very well, 20% speak English well, 10% speak English not well).
7.9% of residents speak other Indo-European language at home (73% speak English very well, 19% speak English well, 8% speak English not well).
2.3% of residents speak Asian or Pacific Island language at home (60% speak English very well, 21% speak English well, 18% speak English not well, 1% don't speak English at all).
0.3% of residents speak other language at home (55% speak English very well, 45% speak English well).
Foreign born population: 4,230 (13.9%)
(69.2% of them are naturalized citizens)
Year of entry for the foreign-born population in North Andover, Massachusetts
5161995 to March 2000
4551990 to 1994
2931985 to 1989
2451980 to 1984
1691975 to 1979
881970 to 1974
1351965 to 1969
290Before 1965
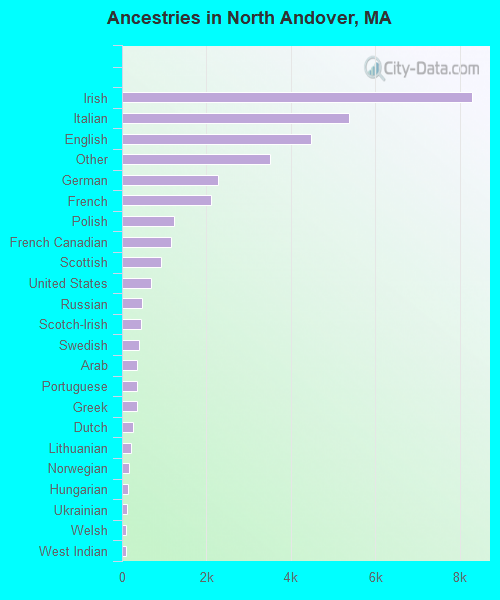
First ancestries reported:
Irish: 8,276 (24.6%)
Italian: 5,386 (16.0%)
English: 4,464 (13.2%)
Other: 3,514 (10.4%)
German: 2,266 (6.7%)
French: 2,109 (6.3%)
Polish: 1,222 (3.6%)
French Canadian: 1,149 (3.4%)
Scottish: 914 (2.7%)
United States: 697 (2.1%)
Russian: 481 (1.4%)
Scotch-Irish: 459 (1.4%)
Swedish: 400 (1.2%)
Arab: 366 (1.1%)
Portuguese: 357 (1.1%)
Greek: 344 (1.0%)
Dutch: 262 (0.8%)
Lithuanian: 222 (0.7%)
Norwegian: 173 (0.5%)
Hungarian: 141 (0.4%)
Ukrainian: 124 (0.4%)
Welsh: 89 (0.3%)
West Indian: 85 (0.3%)
Danish: 66 (0.2%)
Czech: 61 (0.2%)
Slovak: 50 (0.1%)
Swiss: 21 (0.06%)
Subsaharan African: 6 (0.02%)
Most common places of birth for foreign-born residents (%):
India
North Andover:
10.9% (238)
Massachusetts:
3.6% (28,086)
Russia
North Andover:
10.5% (230)
Massachusetts:
2.3% (17,449)
Canada
North Andover:
7.6% (167)
Massachusetts:
5.2% (40,247)
United Kingdom
North Andover:
5.6% (122)
Massachusetts:
3.3% (25,403)
Italy
North Andover:
5.6% (122)
Massachusetts:
3.7% (28,319)
Korea
North Andover:
5.2% (113)
Massachusetts:
1.7% (13,456)
Vietnam
North Andover:
4.7% (104)
Massachusetts:
3.9% (30,457)
Germany
North Andover:
4.0% (87)
Massachusetts:
1.9% (14,883)
China, excluding Hong Kong and Taiwan
North Andover:
3.6% (79)
Massachusetts:
5.1% (39,255)
Hong Kong
North Andover:
3.3% (73)
Massachusetts:
1.0% (7,937)
Japan
North Andover:
3.1% (68)
Massachusetts:
1.1% (8,682)
Brazil
North Andover:
3.0% (66)
Massachusetts:
4.7% (36,669)
Taiwan
North Andover:
3.0% (66)
Massachusetts:
0.9% (7,258)
Poland
North Andover:
2.7% (59)
Massachusetts:
1.8% (13,543)
Portugal
North Andover:
2.0% (43)
Massachusetts:
8.6% (66,627)
Czechoslovakia (includes Czech Republic and Slovakia)
North Andover:
2.0% (43)
Massachusetts:
0.3% (1,943)
Philippines
North Andover:
1.9% (41)
Massachusetts:
1.0% (7,414)
Colombia
North Andover:
1.8% (40)
Massachusetts:
2.0% (15,286)
Iran
North Andover:
1.8% (40)
Massachusetts:
0.6% (4,416)
Other Northern Africa
North Andover:
1.7% (37)
Massachusetts:
0.5% (3,810)
Lebanon
North Andover:
1.6% (36)
Massachusetts:
0.9% (6,691)
Dominican Republic
North Andover:
1.5% (33)
Massachusetts:
6.0% (46,744)
Place of birth for U.S.-born residents:
This state: 18,710
Other state: 6,059
Northeast: 3,903
Midwest: 846
South: 847
West: 463
55% of North Andover residents lived in the same house 5 years ago. Out of people who lived in different houses, 51% lived in this county. Out of people who lived in different counties, 54% lived in Massachusetts.
Education attainment for males 25 years and older:
No schooling: 35
Nursery to 4th grade: 0
5th and 6th grade: 35
7th and 8th grade: 77
9th grade: 48
10th grade: 75
11th grade: 57
12th grade, no diploma: 161
High school graduate (or equivalency): 1,339
Less than 1 year of college: 387
Some college more than 1 year, no degree: 911
Associate degree: 345
Bachelor's degree: 2,599
Master's degree: 1,487
Professional school degree: 301
Doctorate degree: 248
Education attainment for females 25 years and older:
No schooling: 34
Nursery to 4th grade: 15
5th and 6th grade: 74
7th and 8th grade: 130
9th grade: 77
10th grade: 95
11th grade: 100
12th grade, no diploma: 214
High school graduate (or equivalency): 2,162
Less than 1 year of college: 502
Some college more than 1 year, no degree: 1,103
Associate degree: 804
Bachelor's degree: 2,608
Master's degree: 1,338
Professional school degree: 222
Doctorate degree: 89
Housing units in structures:
One, detached: 5,609
One, attached: 651
Two: 891
3 or 4: 557
5 to 9: 652
10 to 19: 998
20 to 49: 130
50 or more: 442
Mobile homes: 5
Boats, RVs, vans, etc.: 8
Median worth of mobile homes: $677,016
Housing units lacking complete plumbing facilities: 0.1%
Housing units lacking complete kitchen facilities: 0.5%