North Adams, MA (Massachusetts) Houses and Residents
| North Adams: | $192,722 |
| Massachusetts: | $534,700 |
Mean price in 2022:
Detached houses: $230,385
Here: $230,385 State: $651,570 Townhouses or other attached units: $552,801
Here: $552,801 State: $617,749 In 2-unit structures: $159,162
Here: $159,162 State: $594,808 In 3-to-4-unit structures: $588,555
Here: $588,555 State: $601,912 In 5-or-more-unit structures: $247,415
Here: $247,415 State: $555,768 Mobile homes: $58,116
Here: $58,116 State: $170,209
Total population: 13,354 (All urban)
Houses: 6,793 (5,848 occupied: 3,382 owner occupied, 2,670 renter occupied)
| % of renters here: | 44% |
| State: | 38% |
Housing density: 332 houses/condos per square mile
Median price asked for vacant for-sale houses and condos in 2022: $364,509.
Median contract rent in 2022: $699 (lower quartile is $375, upper quartile is $949)
Median rent asked for vacant for-rent units in 2022: $836
Median gross rent in North Adams, MA in 2022: $813
Housing units in North Adams with a mortgage: 1,950 (195 second mortgage, 0 home equity loan, 185 both second mortgage and home equity loan)
Houses without a mortgage: 110
Median household income for houses/condos with a mortgage: $84,435
Median household income for apartments without a mortgage: $63,271
Median monthly housing costs: $930
Compare current foreclosures near North Adams, MA:
| Photo | Address | Area | Beds / Baths | Price | Details |
|---|---|---|---|---|---|

|
#1
Elmwood Ave
North Adams, MA 01247
|
2,777 sq. feet
|
3 baths 5 beds |
$215,000
|
show details |

|
#2
North St
North Adams, MA 01247
|
1,164 sq. feet
|
1 baths 3 beds |
show details | |

|
#3
Franklin St
North Adams, MA 01247
|
1,386 sq. feet
|
1 baths 3 beds |
show details | |

|
#4
W Shaft Rd
North Adams, MA 01247
|
1,144 sq. feet
|
1 baths 3 beds |
show details | |

|
#5
Houghton St
North Adams, MA 01247
|
3,380 sq. feet
|
3 baths 5 beds |
show details | |

|
#6
Phelps Rd
North Adams, MA 01247
|
1,286 sq. feet
|
1 baths 4 beds |
show details | |

|
#7
Franklin St
North Adams, MA 01247
|
1,386 sq. feet
|
1 baths 3 beds |
show details | |

|
#8
North St
North Adams, MA 01247
|
1,164 sq. feet
|
1 baths 3 beds |
show details | |

|
#9
Mohawk Trl
North Adams, MA 01247
|
1,210 sq. feet
|
1 baths 3 beds |
show details | |

|
#10
Eagle St Apt 402
North Adams, MA 01247
|
- sq. feet
|
- baths - beds |
show details |
| Photo | Address | Area | Beds / Baths | Price | Details |
|---|---|---|---|---|---|

|
#11
Ashland St Apt 201
North Adams, MA 01247
|
- sq. feet
|
- baths - beds |
show details | |

|
#12
W Main St
North Adams, MA 01247
|
- sq. feet
|
- baths - beds |
show details | |

|
#13
Central Shaft Rd
North Adams, MA 01247
|
- sq. feet
|
- baths - beds |
show details | |

|
#14
Prospect St
North Adams, MA 01247
|
- sq. feet
|
- baths - beds |
show details | |

|
#15
Union St # B
North Adams, MA 01247
|
- sq. feet
|
- baths - beds |
show details | |

|
#16
Fairgrounds Ave
North Adams, MA 01247
|
- sq. feet
|
- baths - beds |
show details | |

|
#17
Chapel Rd
Bennington, VT 05201
|
1,000 sq. feet
|
1 baths 2 beds |
$260,000
|
show details |

|
#18
Plank Rd
Berlin, NY 12022
|
986 sq. feet
|
1 baths 2 beds |
show details | |

|
#19
Toad Point Rd
Petersburg, NY 12138
|
1,800 sq. feet
|
1 baths 2 beds |
show details | |

|
#20
Richmond St
Adams, MA 01220
|
1,828 sq. feet
|
1 baths 4 beds |
show details |
| Photo | Address | Area | Beds / Baths | Price | Details |
|---|---|---|---|---|---|

|
#21
Grove St
Adams, MA 01220
|
2,644 sq. feet
|
2 baths 7 beds |
show details | |

|
#22
Scriven Rd
Petersburg, NY 12138
|
2,200 sq. feet
|
2 baths 2 beds |
show details | |

|
#23
Arnold Ct
Cheshire, MA 01225
|
1,600 sq. feet
|
2 baths 2 beds |
show details | |

|
#24
Bangor St
Lanesboro, MA 01237
|
1,051 sq. feet
|
1 baths 3 beds |
show details | |

|
#25
Wilshire Dr
Cheshire, MA 01225
|
4,302 sq. feet
|
2 baths 3 beds |
show details | |

|
#26
North St
Pittsfield, MA 01201
|
1,661 sq. feet
|
2 baths 4 beds |
show details | |

|
#27
Route 9
Windsor, MA 01270
|
1,223 sq. feet
|
1 baths 2 beds |
show details | |

|
#28
Rte 9
Windsor, MA 01270
|
1,223 sq. feet
|
1 baths 2 beds |
show details | |

|
#29
North St
Dalton, MA 01226
|
1,852 sq. feet
|
2 baths 4 beds |
show details | |

|
#30
Farnsworth Ter
Pittsfield, MA 01201
|
1,692 sq. feet
|
1 baths 4 beds |
show details |
| Photo | Address | Area | Beds / Baths | Price | Details |
|---|---|---|---|---|---|

|
#31
Varville Rd
Petersburg, NY 12138
|
1,232 sq. feet
|
1 baths 3 beds |
show details | |

|
#32
Baker St
Lanesboro, MA 01237
|
1,231 sq. feet
|
1 baths 3 beds |
show details | |

|
#33
Ashuelot St
Dalton, MA 01226
|
1,792 sq. feet
|
2 baths 3 beds |
show details | |

|
#34
E Shore Dr
Petersburg, NY 12138
|
1,000 sq. feet
|
1 baths 6 beds |
show details | |

|
#35
Hawley Rd
Ashfield, MA 01330
|
1,008 sq. feet
|
1 baths 3 beds |
show details | |

|
#36
Burke Ave
Pittsfield, MA 01201
|
1,008 sq. feet
|
1 baths 2 beds |
show details | |

|
#37
Davis St
Pittsfield, MA 01201
|
1,456 sq. feet
|
2 baths 3 beds |
show details | |

|
#38
Cranberry Pond Rd
Cropseyville, NY 12052
|
1,152 sq. feet
|
1 baths 2 beds |
show details | |

|
#39
Grange Hall Rd
Stephentown, NY 12168
|
1,670 sq. feet
|
1 baths 2 beds |
show details | |

|
#40
Tea St
Charlemont, MA 01339
|
2,829 sq. feet
|
2 baths 6 beds |
show details |
| Photo | Address | Area | Beds / Baths | Price | Details |
|---|---|---|---|---|---|

|
#41
Legate Hill Rd
Charlemont, MA 01339
|
2,016 sq. feet
|
2 baths 3 beds |
show details | |

|
#42
Fox Way
Petersburg, NY 12138
|
1,734 sq. feet
|
1 baths 1 beds |
show details | |

|
#43
Linden St
Williamstown, MA 01267
|
2,298 sq. feet
|
3 baths 4 beds |
show details | |

|
#44
Woodlawn Dr
Williamstown, MA 01267
|
1,806 sq. feet
|
2 baths 4 beds |
show details | |

|
#45
Anthony St # B
Adams, MA 01220
|
1,622 sq. feet
|
2 baths 3 beds |
show details | |

|
#46
Valley St
Adams, MA 01220
|
1,680 sq. feet
|
2 baths 4 beds |
show details | |

|
#47
E Hoosac St
Adams, MA 01220
|
594 sq. feet
|
1 baths 2 beds |
show details | |

|
#48
Weber St # 12
Adams, MA 01220
|
1,728 sq. feet
|
2 baths 4 beds |
show details | |

|
#49
Richmond St
Adams, MA 01220
|
1,920 sq. feet
|
2 baths 4 beds |
show details | |

|
Check over 1 million property listings on Foreclosure.com!
|
browse all offers | |||


 | How Much Massachusetts Households Make Per Year: Census Data (37 replies) |
| 2022 Real Estate Observations (1122 replies) |
| 2021 Real Estate Observations (1729 replies) |
| Rents rapidly climbing (62 replies) |
| Oklahoma to (likely Western) Massachusetts - Beginning Research (274 replies) |
| Buying in North Adams? (7 replies) |

Median year apartment built: 1945
Household type by relationship:
Households: 12,846- Male householders: 2,840 (1,183 living alone), Female householders: 2,934 (1,170 living alone)
1,904 spouses (1,865 opposite-sex spouses), 680 unmarried partners, (630 opposite-sex unmarried partners), 2,907 children (2,575 natural, 207 adopted, 124 stepchildren), 132 grandchildren, 57 brothers or sisters, 100 parents, 148 foster children, 65 other relatives, 250 non-relatives
- In group quarters: 824
Size of family households: 1,708 2-persons, 699 3-persons, 423 4-persons, 134 5-persons, 48 6-persons, 55 7-or-more-persons.
Size of nonfamily households: 2,307 1-person, 615 2-persons, 81 3-persons, 1 5-persons.
1,045 married couples with children.
745 single-parent households (279 men, 466 women).
91.5% of residents of North Adams speak English at home.
3.6% of residents speak Spanish at home (70% speak English very well, 26% speak English well, 3% don't speak English at all).
3.5% of residents speak other Indo-European language at home (71% speak English very well, 26% speak English well, 3% speak English not well).
0.4% of residents speak Asian or Pacific Island language at home (69% speak English very well, 31% speak English well).
0.4% of residents speak other language at home (100% speak English very well).
Foreign born population: 830 (6.5%)
(41.8% of them are naturalized citizens)
| Here: | 6.5 |
| State: | 6.5 |
| Here: | 4.4 |
| State: | 4.0 |

- Bedrooms in owner-occupied houses and condos in North Adams, Massachusetts
- 22no bedroom
- 1311 bedroom
- 8462 bedrooms
- 1,6293 bedrooms
- 5564 bedrooms
- 1995+ bedrooms

- Bedrooms in renter-occupied apartments in North Adams, Massachusetts
- 71no bedroom
- 6941 bedroom
- 1,0462 bedrooms
- 7193 bedrooms
- 884 bedrooms
- 525+ bedrooms

- Cars and other vehicles available in North Adams in owner-occupied houses/condos
- 138no vehicle
- 1,2461 vehicle
- 1,4372 vehicles
- 4493 vehicles
- 1034 vehicles
- 95+ vehicles

- Cars and other vehicles available in North Adams in renter-occupied apartments
- 767no vehicle
- 1,3181 vehicle
- 4832 vehicles
- 693 vehicles
- 04 vehicles
- 345+ vehicles

- Rooms in owner-occupied houses in North Adams, Massachusetts
- 221 room
- 492 rooms
- 543 rooms
- 1844 rooms
- 8925 rooms
- 5866 rooms
- 5477 rooms
- 5578 rooms
- 4919+ rooms

- Rooms in renter-occupied apartments in North Adams, Massachusetts
- 541 room
- 952 rooms
- 4213 rooms
- 8514 rooms
- 5925 rooms
- 3516 rooms
- 1377 rooms
- 1268 rooms
- 449+ rooms


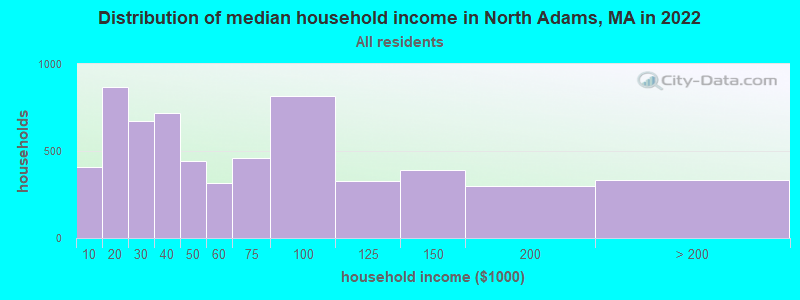
North Adams, MA household income distribution

- 406Less than $10,000
- 868$10,000 to $19,999
- 674$20,000 to $29,999
- 716$30,000 to $39,999
- 444$40,000 to $49,999
- 314$50,000 to $59,999
- 462$60,000 to $74,999
- 814$75,000 to $99,999
- 329$100,000 to $124,999
- 388$125,000 to $149,999
- 300$150,000 to $199,999
- 334$200,000 or more
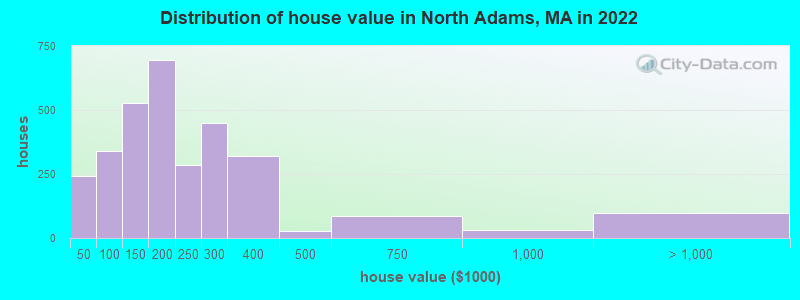
Home value of owner - occupied houses in 2022 in North Adams, MA
-
- 124Less than $10,000
- 14$10,000 to $14,999
- 33$15,000 to $19,999
- 31$20,000 to $24,999
- 6$25,000 to $29,999
- 6$30,000 to $34,999
- 14$35,000 to $39,999
- 10$40,000 to $49,999
- 43$50,000 to $59,999
- 22$60,000 to $69,999
- 81$70,000 to $79,999
- 99$80,000 to $89,999
- 81$90,000 to $99,999
- 322$100,000 to $124,999
- 206$125,000 to $149,999
- 538$150,000 to $174,999
- 155$175,000 to $199,999
- 284$200,000 to $249,999
- 448$250,000 to $299,999
- 318$300,000 to $399,999
- 26$400,000 to $499,999
- 84$500,000 to $749,999
- 30$750,000 to $999,999
- 44$1,000,000 to $1,499,999
- 51$2,000,000 or more
Rent paid by renters in 2022 in North Adams, MA
-
- 31Less than $100
- 96$100 to $149
- 174$200 to $249
- 129$250 to $299
- 81$300 to $349
- 30$350 to $399
- 305$400 to $449
- 59$450 to $499
- 114$500 to $549
- 86$550 to $599
- 96$600 to $649
- 101$650 to $699
- 137$700 to $749
- 149$750 to $799
- 303$800 to $899
- 101$900 to $999
- 320$1,000 to $1,249
- 57$1,250 to $1,499
- 139$1,500 to $1,999
- 19$2,000 to $2,499
- 112No cash rent


Percentage of workers working in this county: 95.0%
Number of people working at home: 529 (8.9% of all workers)
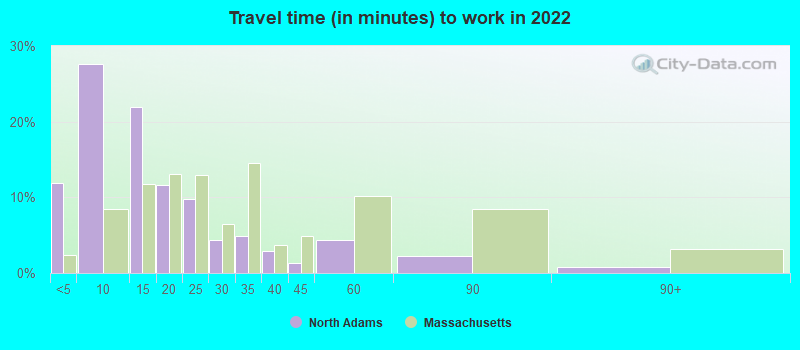
Travel time to work (commute)
- Less than 5 minutes: 721
- 5 to 9 minutes: 1,676
- 10 to 14 minutes: 1,148
- 15 to 19 minutes: 331
- 20 to 24 minutes: 344
- 25 to 29 minutes: 16
- 30 to 34 minutes: 265
- 35 to 39 minutes: 144
- 40 to 44 minutes: 149
- 45 to 59 minutes: 560
- 60 to 89 minutes: 147
- 90 or more minutes: 77
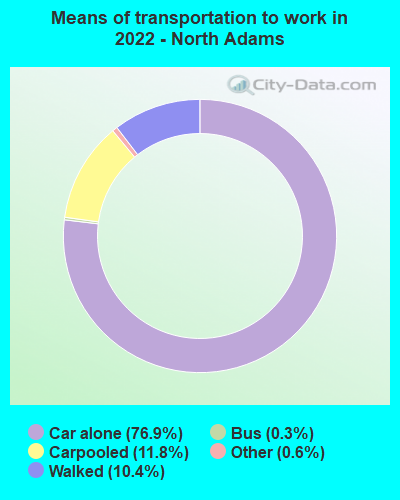
Means of transportation to work:
- Drove a car alone: 4,025 (68.6%)
- Carpooled: 650 (11.1%)
- Bus: 12 (0.2%)
- Taxi: 41 (0.7%)
- Bicycle: 4 (0.1%)
- Walked: 527 (9.0%)
- Worked at home: 529 (9.0%)

- Unemployment by race in 2022
- Unemployment rate for White non-Hispanic residents
- 4.8%Males
- 4.3%Females
- Unemployment rate for Asian residents
- 100.0%Males
- 11.8%Females

- Year of entry for the foreign-born population in North Adams, Massachusetts
- 4332010 or later
- 2562000 to 2009
- 291990 to 1999
- 661980 to 1989
- 121970 to 1979
- 137Before 1970

First ancestries reported:
- Italian: 748 (13.4%)
- English: 608 (10.9%)
- French: 577 (10.3%)
- American: 308 (5.5%)
- Irish: 303 (5.4%)
- French Canadian: 249 (4.5%)
- German: 241 (4.3%)
- Polish: 161 (2.9%)
- European: 132 (2.4%)
- Canadian: 65 (1.2%)
- Norwegian: 54 (1.0%)
- Lebanese: 35 (0.6%)
- Dutch: 29 (0.5%)
- Scandinavian: 29 (0.5%)
- Eastern European: 28 (0.5%)
- Swiss: 25 (0.4%)
- Northern European: 24 (0.4%)
- British: 22 (0.4%)
- Romanian: 22 (0.4%)
- Danish: 17 (0.3%)
- Turkish: 14 (0.3%)
- Russian: 13 (0.2%)
- Scotch-Irish: 12 (0.2%)
- Haitian: 11 (0.2%)
- Greek: 9 (0.2%)
- Lithuanian: 8 (0.1%)
- Austrian: 7 (0.1%)
- Guyanese: 6 (0.1%)
- Portuguese: 5 (0.09%)
- Scottish: 4 (0.07%)
- Finnish: 3 (0.05%)
Most common places of birth for foreign-born residents (%):
| North Adams: | 43.9% (340) |
| Massachusetts: | 0.6% (6,789) |
| North Adams: | 19.7% (153) |
| Massachusetts: | 1.1% (13,563) |
| North Adams: | 7.6% (59) |
| Massachusetts: | 8.4% (103,233) |
| North Adams: | 6.1% (47) |
| Massachusetts: | 6.8% (82,934) |
| North Adams: | 3.1% (24) |
| Massachusetts: | 0.1% (779) |
| North Adams: | 1.9% (15) |
| Massachusetts: | 0.1% (900) |
| North Adams: | 1.8% (14) |
| Massachusetts: | 0.4% (5,208) |
| North Adams: | 1.5% (12) |
| Massachusetts: | 4.9% (60,432) |
Place of birth for U.S.-born residents:
- This state: 8,346
- Other state: 3,299
- Northeast: 1,792
- Midwest: 523
- South: 617
- West: 375
88.4% of North Adams residents lived in the same house 1 years ago.
Out of people who lived in different houses, 31.6% lived in this county.
Out of people who lived in different counties, 39.3% lived in Massachusetts.
| North Adams: | 88.4% |
| State average: | 87.7% |
Education attainment for males 25 years and older:
- No schooling: 133
- Nursery to 4th grade: 0
- 5th and 6th grade: 69
- 7th and 8th grade: 204
- 9th grade: 31
- 10th grade: 70
- 11th grade: 31
- 12th grade, no diploma: 99
- High school graduate (or equivalency): 1,633
- Less than 1 year of college: 361
- Some college more than 1 year, no degree: 777
- Associate degree: 211
- Bachelor's degree: 678
- Master's degree: 266
- Professional school degree: 18
- Doctorate degree: 113

Education attainment for females 25 years and older:
- No schooling: 31
- Nursery to 4th grade: 0
- 5th and 6th grade: 0
- 7th and 8th grade: 46
- 9th grade: 21
- 10th grade: 118
- 11th grade: 73
- 12th grade, no diploma: 133
- High school graduate (or equivalency): 1,335
- Less than 1 year of college: 287
- Some college more than 1 year, no degree: 494
- Associate degree: 440
- Bachelor's degree: 651
- Master's degree: 658
- Professional school degree: 35
- Doctorate degree: 57


Housing units in structures:
- One, detached: 3,037
- One, attached: 100
- Two: 938
- 3 or 4: 1,259
- 5 to 9: 652
- 10 to 19: 75
- 20 to 49: 318
- 50 or more: 253
- Mobile homes: 156
Median worth of mobile homes: $26,731
Housing units lacking complete kitchen facilities in 2022: 2.8%
House/condo owner moved in on average 15 years ago
Renter moved in on average 6 years ago

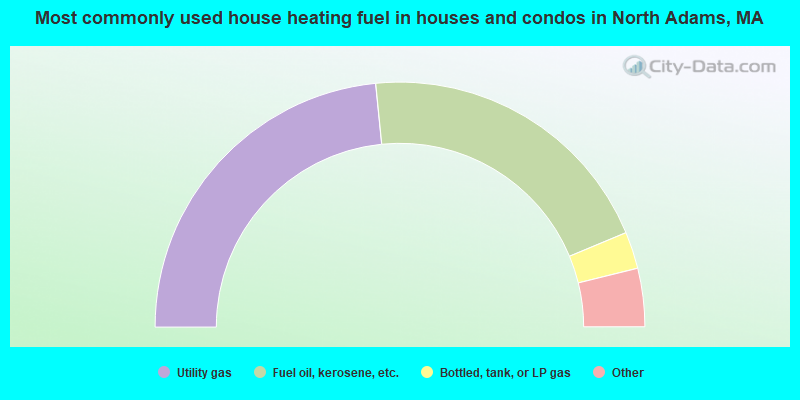
- 46.9%Utility gas
- 40.6%Fuel oil, kerosene, etc.
- 4.9%Bottled, tank, or LP gas
- 3.4%Electricity
- 2.8%Wood
- 0.7%Coal or coke
- 0.7%Other fuel
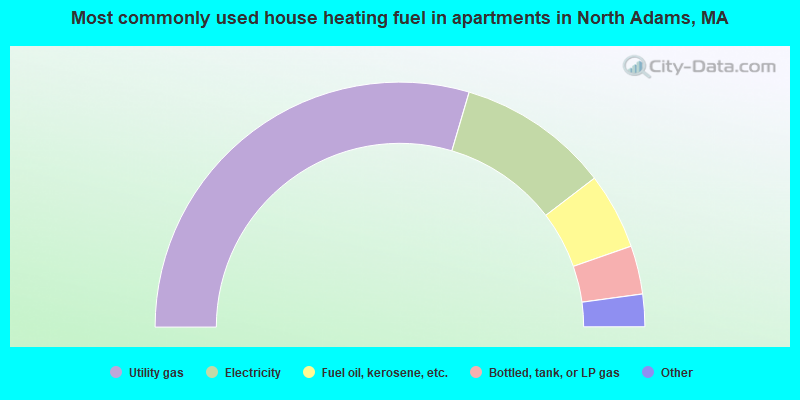
- 59.2%Utility gas
- 20.1%Electricity
- 10.1%Fuel oil, kerosene, etc.
- 6.4%Bottled, tank, or LP gas
- 3.3%No fuel used
- 0.9%Other fuel
Private vs. public school enrollment:
| Here: | 31.2% |
| Massachusetts: | 10.3% |
| Here: | 6.3% |
| Massachusetts: | 12.3% |
| Here: | 24.4% |
| Massachusetts: | 51.2% |


