Housing density: 193 houses/condos per square mile
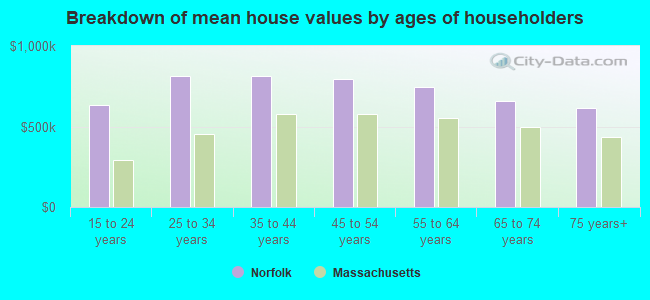
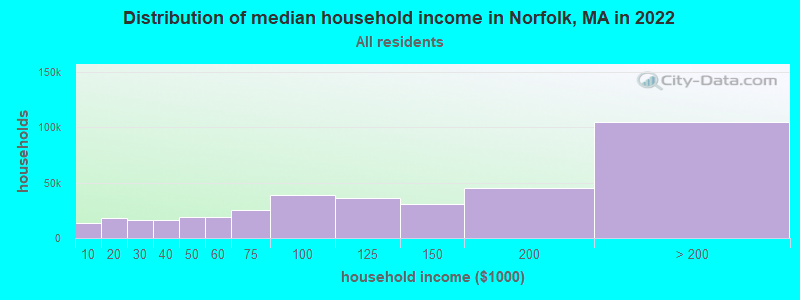
Median price asked for vacant for-sale houses and condos in 2022 in this county: $751,928.
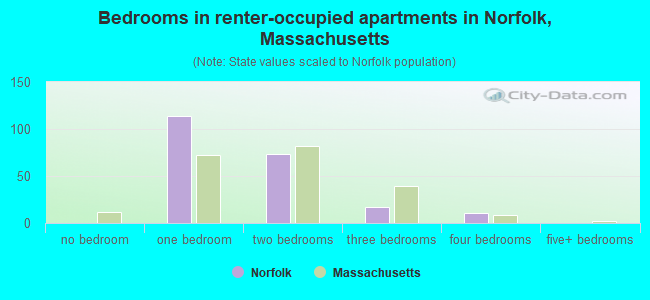
Median contract rent in 2022: $1,425 (lower quartile is $665, upper quartile is $1,806)
Median rent asked for vacant for-rent units in 2022: $876
Median gross rent in Norfolk, MA in 2022: $1,725
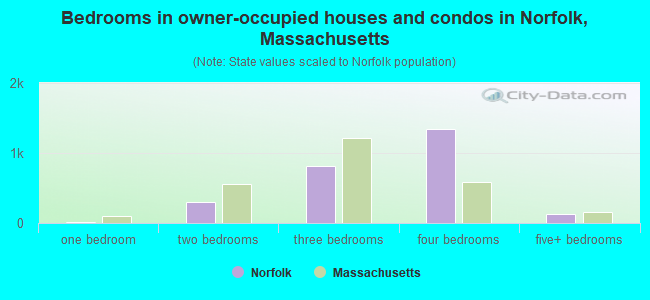
Housing units in Norfolk with a mortgage: 2,038 (195 second mortgage, 367 home equity loan, 16 both second mortgage and home equity loan) Houses without a mortgage: 409
In family households: 540,608 (116,996 male householders, 51,907 female householders)
134,066 spouses, 197,825 children (189,784 natural, 4,588 adopted, 3,453 stepchildren), 7,406 grandchildren, 6,062 brothers or sisters, 7,064 parents, foster children, 5,893 other relatives, 9,006 non-relatives
In nonfamily households: 112,631 (36,559 male householders (27,334 living alone)), 52,452 female householders (43,798 living alone)), 23,620 nonrelatives
In group quarters: 17,611 (8,991 institutionalized population)
123,500 married couples with children.
20,654 single-parent households (3,498 men, 17,156 women).
88.5% of residents of Norfolk speak English at home.
6.0% of residents speak Spanish at home (43% speak English very well, 26% speak English well, 31% speak English not well).
4.4% of residents speak other Indo-European language at home (80% speak English very well, 11% speak English well, 7% speak English not well, 2% don't speak English at all).
1.0% of residents speak Asian or Pacific Island language at home (41% speak English very well, 17% speak English well, 28% speak English not well, 15% don't speak English at all).
0.1% of residents speak other language at home (100% speak English very well).
Foreign born population: 1,594 (13.7%)
(39.0% of them are naturalized citizens)
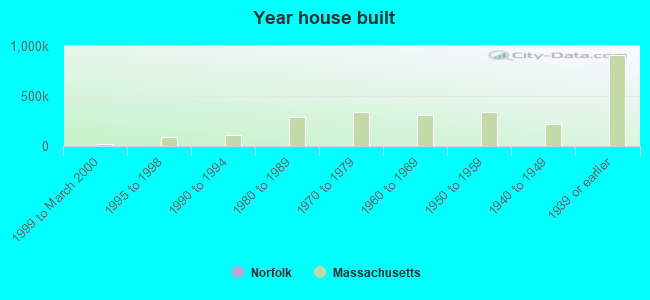
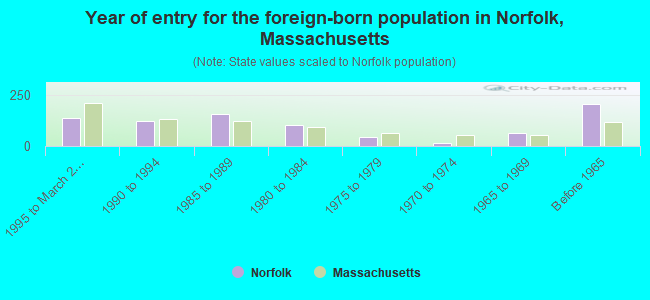
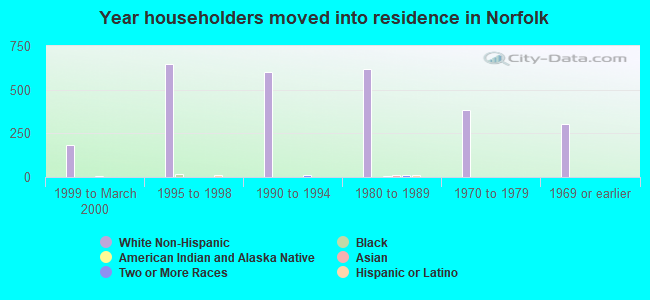
Year of entry for the foreign-born population in Norfolk, Massachusetts
1381995 to March 2000
1251990 to 1994
1581985 to 1989
1051980 to 1984
421975 to 1979
131970 to 1974
631965 to 1969
208Before 1965
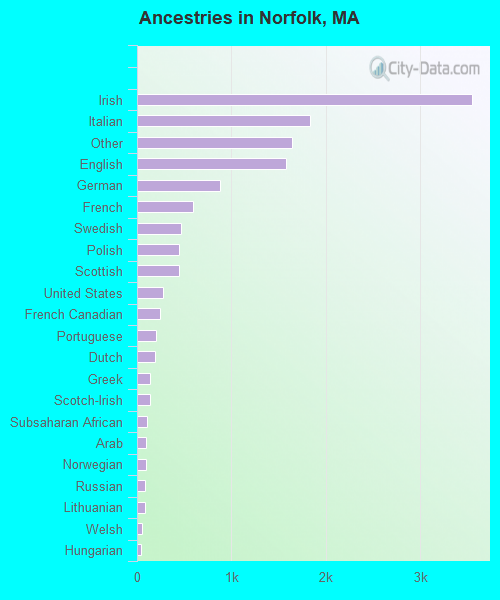
First ancestries reported:
Irish: 3,552 (26.8%)
Italian: 1,834 (13.8%)
Other: 1,641 (12.4%)
English: 1,583 (11.9%)
German: 878 (6.6%)
French: 598 (4.5%)
Swedish: 461 (3.5%)
Polish: 449 (3.4%)
Scottish: 444 (3.3%)
United States: 276 (2.1%)
French Canadian: 239 (1.8%)
Portuguese: 201 (1.5%)
Dutch: 190 (1.4%)
Greek: 143 (1.1%)
Scotch-Irish: 142 (1.1%)
Subsaharan African: 104 (0.8%)
Arab: 96 (0.7%)
Norwegian: 94 (0.7%)
Russian: 84 (0.6%)
Lithuanian: 80 (0.6%)
Welsh: 50 (0.4%)
Hungarian: 43 (0.3%)
West Indian: 22 (0.2%)
Swiss: 18 (0.1%)
Danish: 17 (0.1%)
Ukrainian: 16 (0.1%)
Most common places of birth for foreign-born residents (%):
Dominican Republic
Norfolk:
18.5% (158)
Massachusetts:
6.0% (46,744)
United Kingdom
Norfolk:
10.4% (89)
Massachusetts:
3.3% (25,403)
Canada
Norfolk:
7.0% (60)
Massachusetts:
5.2% (40,247)
Mexico
Norfolk:
6.1% (52)
Massachusetts:
1.0% (7,867)
Italy
Norfolk:
3.8% (32)
Massachusetts:
3.7% (28,319)
Portugal
Norfolk:
3.8% (32)
Massachusetts:
8.6% (66,627)
Colombia
Norfolk:
3.5% (30)
Massachusetts:
2.0% (15,286)
Germany
Norfolk:
3.3% (28)
Massachusetts:
1.9% (14,883)
China, excluding Hong Kong and Taiwan
Norfolk:
3.3% (28)
Massachusetts:
5.1% (39,255)
Vietnam
Norfolk:
2.7% (23)
Massachusetts:
3.9% (30,457)
India
Norfolk:
2.7% (23)
Massachusetts:
3.6% (28,086)
El Salvador
Norfolk:
2.7% (23)
Massachusetts:
2.4% (18,606)
Laos
Norfolk:
2.6% (22)
Massachusetts:
0.4% (3,048)
Korea
Norfolk:
2.2% (19)
Massachusetts:
1.7% (13,456)
Other Western Africa
Norfolk:
2.2% (19)
Massachusetts:
2.6% (20,299)
Ireland
Norfolk:
2.1% (18)
Massachusetts:
2.3% (17,987)
Egypt
Norfolk:
1.9% (16)
Massachusetts:
0.4% (2,726)
Taiwan
Norfolk:
1.9% (16)
Massachusetts:
0.9% (7,258)
Russia
Norfolk:
1.9% (16)
Massachusetts:
2.3% (17,449)
Netherlands
Norfolk:
1.6% (14)
Massachusetts:
0.3% (2,470)
Jamaica
Norfolk:
1.6% (14)
Massachusetts:
1.7% (12,808)
Spain
Norfolk:
1.5% (13)
Massachusetts:
0.3% (1,984)
Place of birth for U.S.-born residents:
This state: 7,251
Other state: 2,144
Northeast: 1,334
Midwest: 287
South: 385
West: 138
72% of Norfolk residents lived in the same house 5 years ago. Out of people who lived in different houses, 53% lived in this county. Out of people who lived in different counties, 70% lived in Massachusetts.
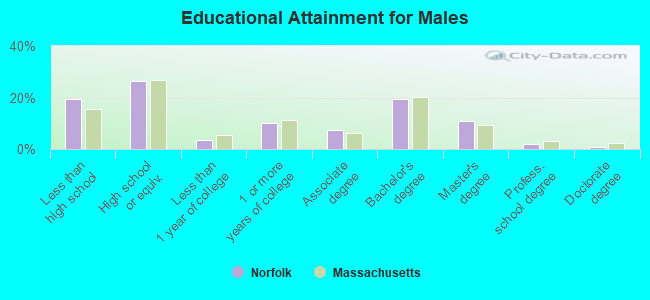
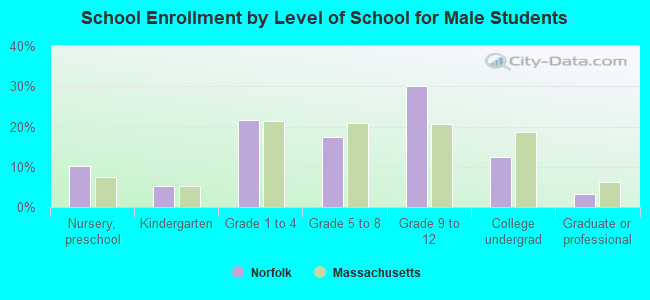
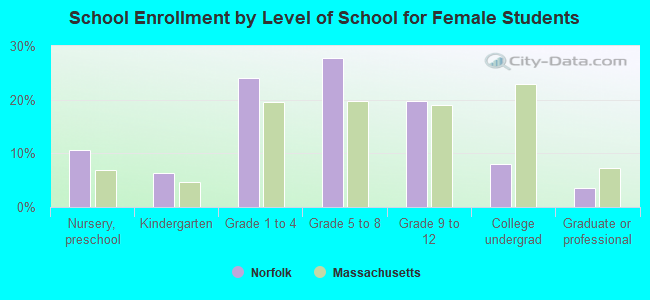
Education attainment for males 25 years and older:
No schooling: 14
Nursery to 4th grade: 29
5th and 6th grade: 50
7th and 8th grade: 209
9th grade: 117
10th grade: 139
11th grade: 116
12th grade, no diploma: 159
High school graduate (or equivalency): 1,134
Less than 1 year of college: 158
Some college more than 1 year, no degree: 434
Associate degree: 311
Bachelor's degree: 845
Master's degree: 476
Professional school degree: 77
Doctorate degree: 41
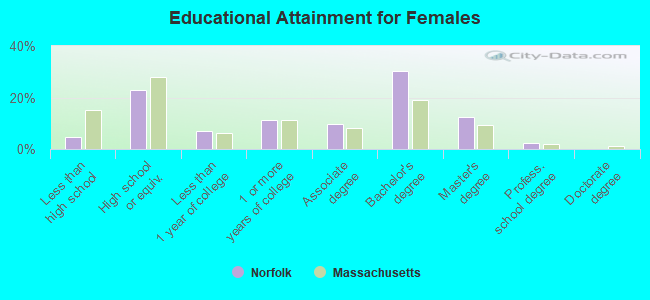
Education attainment for females 25 years and older:
No schooling: 7
Nursery to 4th grade: 8
5th and 6th grade: 0
7th and 8th grade: 33
9th grade: 0
10th grade: 5
11th grade: 34
12th grade, no diploma: 45
High school graduate (or equivalency): 636
Less than 1 year of college: 197
Some college more than 1 year, no degree: 311
Associate degree: 267
Bachelor's degree: 846
Master's degree: 346
Professional school degree: 62
Doctorate degree: 0
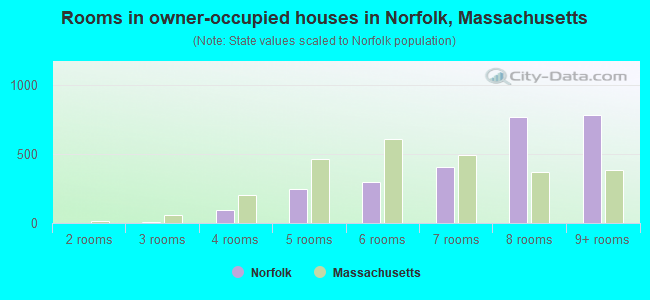
Housing units in structures:
One, detached: 2,668
One, attached: 26
Two: 58
3 or 4: 63
5 to 9: 46
Housing units lacking complete plumbing facilities: 0.3%