Newton, NC (North Carolina) Houses and Residents
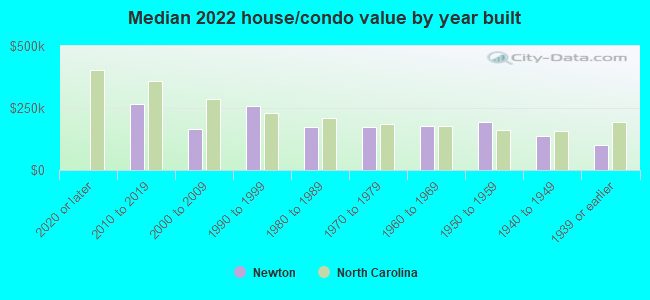
| Newton: | $177,779 |
| North Carolina: | $280,600 |
Total population: 13,005 (Urban population: 12,394, Rural population: 327 (16 farm, 311 nonfarm))
Houses: 5,693 (5,363 occupied: 3,527 owner occupied, 1,932 renter occupied)
| % of renters here: | 35% |
| State: | 33% |
Housing density: 439 houses/condos per square mile
Median price asked for vacant for-sale houses and condos in 2022: $45,933.
Median contract rent in 2022: $680 (lower quartile is $565, upper quartile is $868)
Median rent asked for vacant for-rent units in 2022: $738
Median gross rent in Newton, NC in 2022: $926
Housing units in Newton with a mortgage: 1,823 (111 second mortgage, 0 home equity loan, 98 both second mortgage and home equity loan)
Houses without a mortgage: 106
Median household income for houses/condos with a mortgage: $71,127
Median household income for apartments without a mortgage: $58,842
Median monthly housing costs: $774
Compare current foreclosures in Newton, NC:
| Photo | Address | Area | Beds / Baths | Price | Details |
|---|---|---|---|---|---|

|
#1
Burnt Leaf Ln
Newton, NC 28658
|
1,188 sq. feet
|
2 baths 3 beds |
show details | |

|
#2
N Brushwood Cir
Newton, NC 28658
|
1,440 sq. feet
|
2 baths 3 beds |
show details | |

|
#3
Claremont Rd
Newton, NC 28658
|
1,604 sq. feet
|
2 baths 3 beds |
show details | |

|
#4
Conley St
Newton, NC 28658
|
1,662 sq. feet
|
2 baths 3 beds |
show details | |

|
#5
Carl Dean Dr
Newton, NC 28658
|
1,512 sq. feet
|
2 baths 3 beds |
show details | |

|
#6
Pocono Pl
Newton, NC 28658
|
1,882 sq. feet
|
3 baths 4 beds |
show details | |

|
#7
Claremont Rd
Newton, NC 28658
|
1,102 sq. feet
|
1 baths 3 beds |
show details | |

|
#8
Ann Ave
Newton, NC 28658
|
1,378 sq. feet
|
1 baths 2 beds |
show details | |

|
#9
Cannan Mountain Dr
Newton, NC 28658
|
1,614 sq. feet
|
3 baths 3 beds |
show details | |

|
#10
Old Home Place Dr
Newton, NC 28658
|
3,224 sq. feet
|
2 baths 5 beds |
show details |
| Photo | Address | Area | Beds / Baths | Price | Details |
|---|---|---|---|---|---|

|
#11
Forrest St
Newton, NC 28658
|
1,723 sq. feet
|
2 baths 3 beds |
show details | |

|
#12
Carpenter St
Newton, NC 28658
|
1,250 sq. feet
|
2 baths 3 beds |
show details | |

|
#13
Field Brook Ct
Newton, NC 28658
|
1,639 sq. feet
|
2 baths 3 beds |
show details | |

|
#14
S Forney Ave
Newton, NC 28658
|
1,008 sq. feet
|
1 baths 3 beds |
show details | |

|
#15
Mount Olive Church Rd
Newton, NC 28658
|
2,332 sq. feet
|
2 baths 4 beds |
show details | |

|
#16
Maple Dr
Newton, NC 28658
|
1,995 sq. feet
|
2 baths 2 beds |
show details | |

|
#17
Chatham St
Newton, NC 28658
|
1,032 sq. feet
|
1 baths 3 beds |
show details | |

|
#18
Mount Olive Church Rd
Newton, NC 28658
|
1,360 sq. feet
|
2 baths 3 beds |
show details | |

|
#19
Crestview Dr
Newton, NC 28658
|
1,380 sq. feet
|
1 baths 3 beds |
show details | |

|
#20
S Ervin Ave
Newton, NC 28658
|
1,296 sq. feet
|
2 baths 3 beds |
show details |
| Photo | Address | Area | Beds / Baths | Price | Details |
|---|---|---|---|---|---|

|
#21
Whistler Ct
Newton, NC 28658
|
2,212 sq. feet
|
3 baths 4 beds |
show details | |

|
#22
Summerlin Pl
Newton, NC 28658
|
3,358 sq. feet
|
3 baths 3 beds |
show details | |

|
#23
Wash Gap Dr
Newton, NC 28658
|
2,052 sq. feet
|
2 baths 4 beds |
show details | |

|
#24
Clear Water Ln
Newton, NC 28658
|
1,248 sq. feet
|
2 baths 3 beds |
show details | |

|
#25
W F St
Newton, NC 28658
|
1,112 sq. feet
|
1 baths 3 beds |
show details | |

|
#26
Woodstone Dr
Newton, NC 28658
|
- sq. feet
|
- baths - beds |
show details | |

|
#27
Spring Valley Dr
Newton, NC 28658
|
- sq. feet
|
- baths - beds |
show details | |

|
#28
Evergreen Dr
Newton, NC 28658
|
- sq. feet
|
- baths - beds |
show details | |

|
#29
Mount Olive Church Rd
Newton, NC 28658
|
- sq. feet
|
- baths - beds |
show details | |

|
#30
Cypress Loop
Newton, NC 28658
|
- sq. feet
|
- baths - beds |
show details |
| Photo | Address | Area | Beds / Baths | Price | Details |
|---|---|---|---|---|---|

|
#31
Knolls Dr
Newton, NC 28658
|
- sq. feet
|
- baths - beds |
show details | |

|
#32
E D St
Newton, NC 28658
|
- sq. feet
|
- baths - beds |
show details | |

|
#33
Cannan Mountain Dr
Newton, NC 28658
|
- sq. feet
|
- baths - beds |
show details | |

|
Check over 1 million property listings on Foreclosure.com!
|
browse all offers | |||

Latest news about housing in Newton, NC collected exclusively by city-data.com from local newspapers, TV, and radio stations


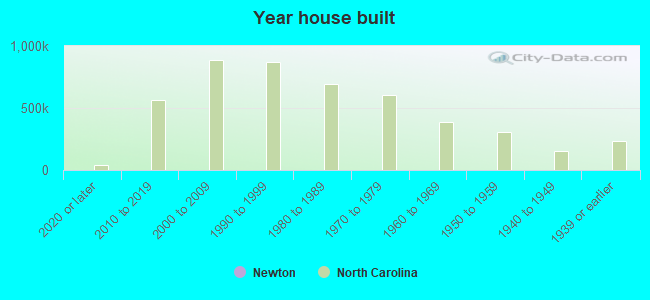
Median year apartment built: 1982
Household type by relationship:
Households: 13,373- Male householders: 2,329 (376 living alone), Female householders: 2,982 (1,130 living alone)
2,309 spouses (2,287 opposite-sex spouses), 646 unmarried partners, (631 opposite-sex unmarried partners), 3,708 children (2,938 natural, 583 adopted, 186 stepchildren), 252 grandchildren, 175 brothers or sisters, 78 parents, 0 foster children, 95 other relatives, 276 non-relatives
- In group quarters: 517
Size of family households: 2,022 2-persons, 829 3-persons, 463 4-persons, 375 5-persons, 1 6-persons, 65 7-or-more-persons.
Size of nonfamily households: 1,511 1-person, 289 2-persons, 4 3-persons.
1,202 married couples with children.
1,443 single-parent households (235 men, 1,208 women).
82.0% of residents of Newton speak English at home.
11.0% of residents speak Spanish at home (60% speak English very well, 14% speak English well, 23% speak English not well, 4% don't speak English at all).
1.3% of residents speak other Indo-European language at home (80% speak English very well, 7% speak English well, 13% don't speak English at all).
5.9% of residents speak Asian or Pacific Island language at home (81% speak English very well, 10% speak English well, 8% speak English not well).
Foreign born population: 1,236 (9.2%)
(43.6% of them are naturalized citizens)
| Here: | 5.7 |
| State: | 6.4 |
| Here: | 3.9 |
| State: | 4.4 |
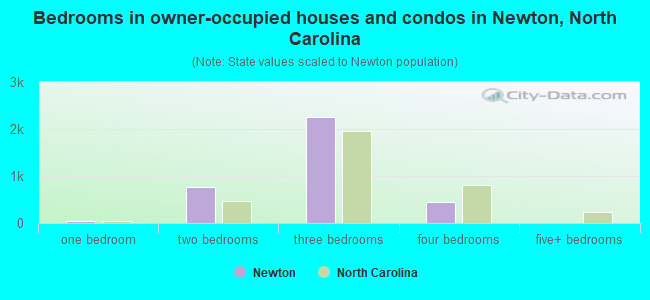
- Bedrooms in owner-occupied houses and condos in Newton, North Carolina
- 0no bedroom
- 441 bedroom
- 7712 bedrooms
- 2,2563 bedrooms
- 4564 bedrooms
- 15+ bedrooms
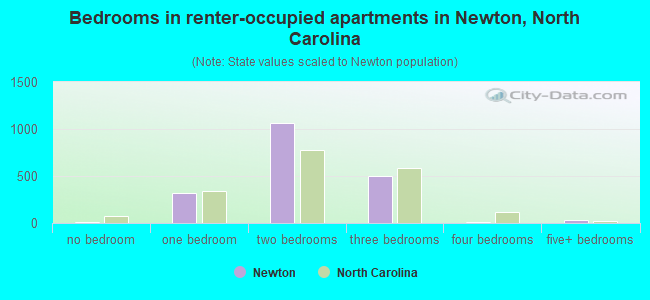
- Bedrooms in renter-occupied apartments in Newton, North Carolina
- 9no bedroom
- 3151 bedroom
- 1,0672 bedrooms
- 5013 bedrooms
- 134 bedrooms
- 275+ bedrooms
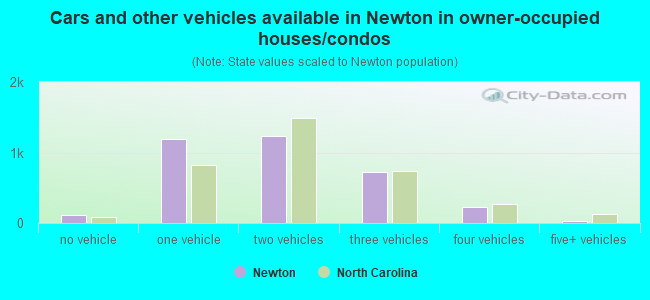
- Cars and other vehicles available in Newton in owner-occupied houses/condos
- 120no vehicle
- 1,1941 vehicle
- 1,2372 vehicles
- 7173 vehicles
- 2344 vehicles
- 265+ vehicles
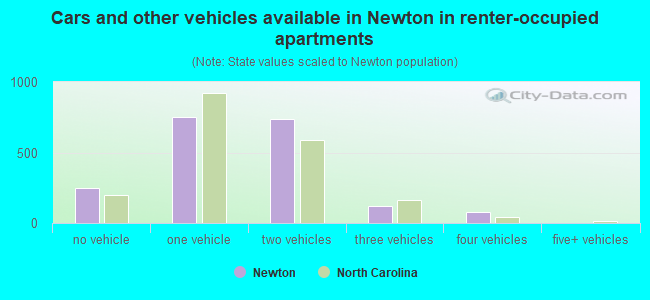
- Cars and other vehicles available in Newton in renter-occupied apartments
- 245no vehicle
- 7511 vehicle
- 7352 vehicles
- 1233 vehicles
- 784 vehicles
- 05+ vehicles
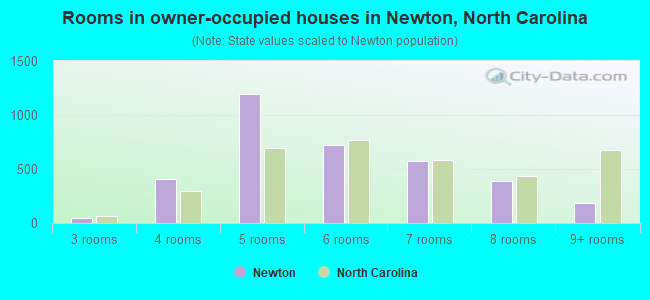
- Rooms in owner-occupied houses in Newton, North Carolina
- 01 room
- 02 rooms
- 493 rooms
- 4114 rooms
- 1,1905 rooms
- 7246 rooms
- 5747 rooms
- 3938 rooms
- 1869+ rooms
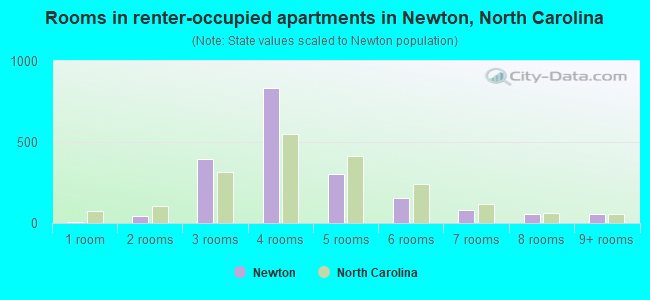
- Rooms in renter-occupied apartments in Newton, North Carolina
- 91 room
- 422 rooms
- 3933 rooms
- 8314 rooms
- 3055 rooms
- 1556 rooms
- 817 rooms
- 578 rooms
- 589+ rooms
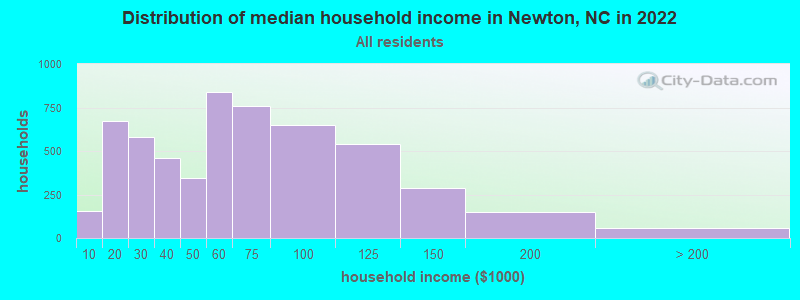
Newton, NC household income distribution

- 156Less than $10,000
- 674$10,000 to $19,999
- 578$20,000 to $29,999
- 461$30,000 to $39,999
- 344$40,000 to $49,999
- 841$50,000 to $59,999
- 759$60,000 to $74,999
- 652$75,000 to $99,999
- 539$100,000 to $124,999
- 285$125,000 to $149,999
- 149$150,000 to $199,999
- 59$200,000 or more
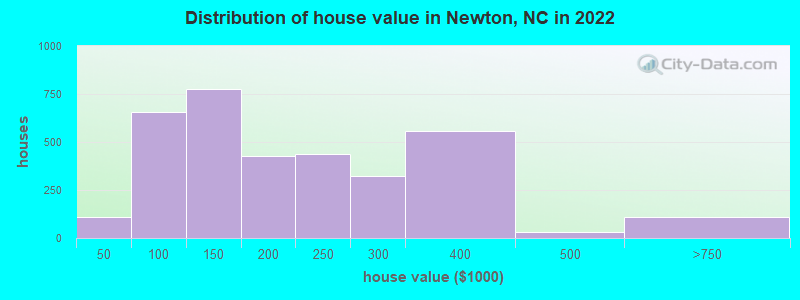
Home value of owner - occupied houses in 2022 in Newton, NC
-
- 64Less than $10,000
- 5$10,000 to $14,999
- 5$20,000 to $24,999
- 35$25,000 to $29,999
- 75$50,000 to $59,999
- 64$60,000 to $69,999
- 132$70,000 to $79,999
- 172$80,000 to $89,999
- 211$90,000 to $99,999
- 269$100,000 to $124,999
- 508$125,000 to $149,999
- 286$150,000 to $174,999
- 138$175,000 to $199,999
- 439$200,000 to $249,999
- 323$250,000 to $299,999
- 559$300,000 to $399,999
- 32$400,000 to $499,999
- 107$500,000 to $749,999
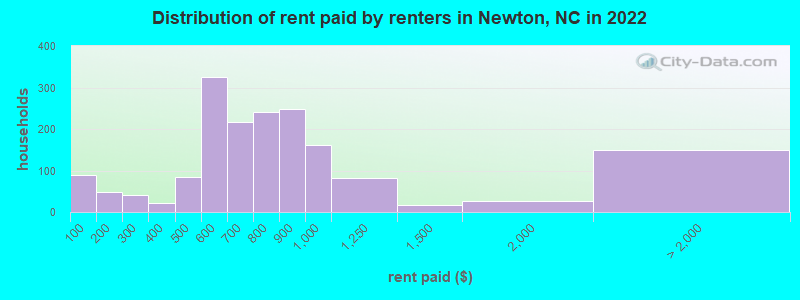
Rent paid by renters in 2022 in Newton, NC
-
- 88Less than $100
- 21$100 to $149
- 26$150 to $199
- 15$200 to $249
- 24$250 to $299
- 21$300 to $349
- 16$400 to $449
- 67$450 to $499
- 98$500 to $549
- 225$550 to $599
- 171$600 to $649
- 46$650 to $699
- 203$700 to $749
- 38$750 to $799
- 248$800 to $899
- 161$900 to $999
- 81$1,000 to $1,249
- 16$1,250 to $1,499
- 26$1,500 to $1,999
- 50$2,000 to $2,499
- 99No cash rent
Percentage of workers working in this county: 73.9%
Number of people working at home: 485 (8.4% of all workers)
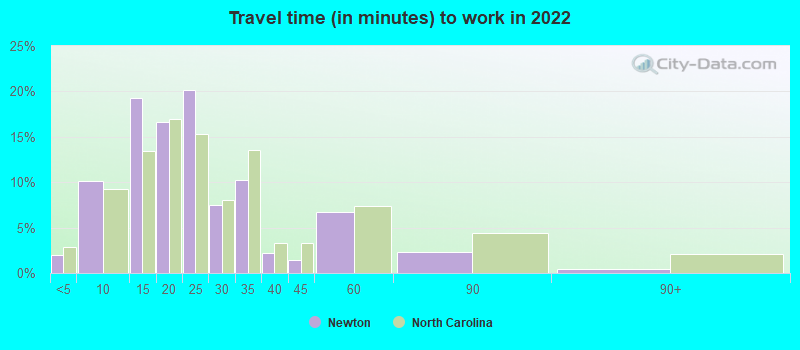
Travel time to work (commute)
- Less than 5 minutes: 104
- 5 to 9 minutes: 423
- 10 to 14 minutes: 1,416
- 15 to 19 minutes: 1,321
- 20 to 24 minutes: 1,018
- 25 to 29 minutes: 57
- 30 to 34 minutes: 487
- 35 to 39 minutes: 12
- 40 to 44 minutes: 66
- 45 to 59 minutes: 85
- 60 to 89 minutes: 252
- 90 or more minutes: 51
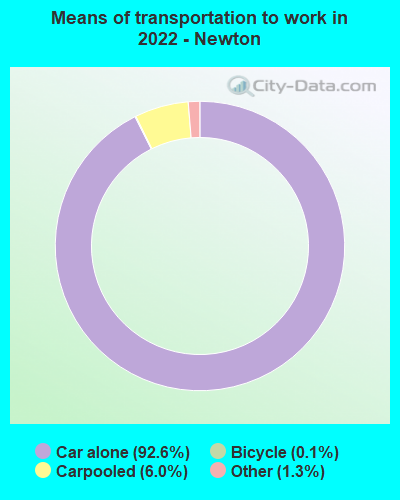
Means of transportation to work:
- Drove a car alone: 6,737 (83.7%)
- Carpooled: 456 (5.7%)
- Taxi: 95 (1.2%)
- Bicycle: 10 (0.1%)
- Worked at home: 485 (6.0%)
- Unemployment by race in 2022
- Unemployment rate for White non-Hispanic residents
- 6.6%Males
- 1.9%Females
- Unemployment rate for Black residents
- 1.9%Males
- 7.5%Females
- Unemployment rate for Asian residents
- 5.9%Males
- Unemployment rate for other race residents
- 34.0%Females
- Unemployment rate for two or more race residents
- 18.0%Males
- Unemployment rate for Hispanic or Latino residents
- 23.1%Males
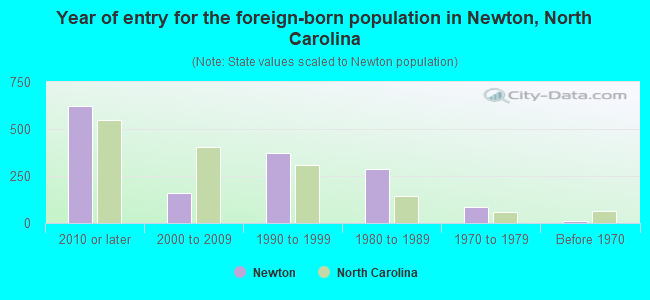
- Year of entry for the foreign-born population in Newton, North Carolina
- 6212010 or later
- 1572000 to 2009
- 3741990 to 1999
- 2861980 to 1989
- 851970 to 1979
- 10Before 1970
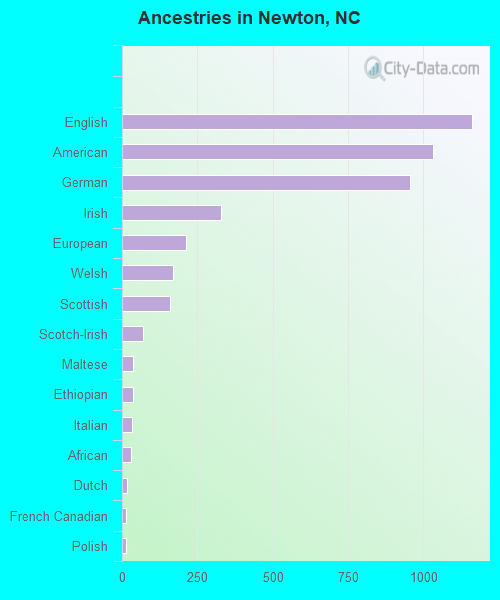
First ancestries reported:
- English: 1,161 (14.1%)
- American: 1,032 (12.5%)
- German: 955 (11.6%)
- Irish: 328 (4.0%)
- European: 212 (2.6%)
- Welsh: 170 (2.1%)
- Scottish: 159 (1.9%)
- Scotch-Irish: 69 (0.8%)
- Maltese: 38 (0.5%)
- Ethiopian: 35 (0.4%)
- Italian: 34 (0.4%)
- African: 31 (0.4%)
- Dutch: 18 (0.2%)
- French Canadian: 12 (0.1%)
- Polish: 12 (0.1%)
- Northern European: 6 (0.07%)
- Ukrainian: 6 (0.07%)
Most common places of birth for foreign-born residents (%):
| Newton: | 34.6% (431) |
| North Carolina: | 2.6% (22,964) |
| Newton: | 14.3% (178) |
| North Carolina: | 2.4% (20,695) |
| Newton: | 14.1% (176) |
| North Carolina: | 24.7% (214,776) |
| Newton: | 12.9% (161) |
| North Carolina: | 1.2% (9,986) |
| Newton: | 7.0% (87) |
| North Carolina: | 0.6% (4,983) |
| Newton: | 6.5% (81) |
| North Carolina: | 2.9% (24,965) |
| Newton: | 4.5% (56) |
| North Carolina: | 0.7% (6,091) |
| Newton: | 3.4% (42) |
| North Carolina: | 0.4% (3,108) |
| Newton: | 2.1% (26) |
| North Carolina: | 1.8% (15,534) |
| Newton: | 2.0% (25) |
| North Carolina: | 0.3% (2,274) |
Place of birth for U.S.-born residents:
- This state: 8,443
- Other state: 3,715
- Northeast: 780
- Midwest: 835
- South: 1,793
- West: 294
89.4% of Newton residents lived in the same house 1 years ago.
Out of people who lived in different houses, 29.2% lived in this county.
Out of people who lived in different counties, 57.0% lived in North Carolina.
| Newton: | 89.4% |
| State average: | 87.3% |
Education attainment for males 25 years and older:
- No schooling: 47
- Nursery to 4th grade: 8
- 5th and 6th grade: 27
- 7th and 8th grade: 70
- 9th grade: 176
- 10th grade: 75
- 11th grade: 0
- 12th grade, no diploma: 13
- High school graduate (or equivalency): 1,667
- Less than 1 year of college: 248
- Some college more than 1 year, no degree: 764
- Associate degree: 515
- Bachelor's degree: 651
- Master's degree: 124
- Professional school degree: 9
- Doctorate degree: 23

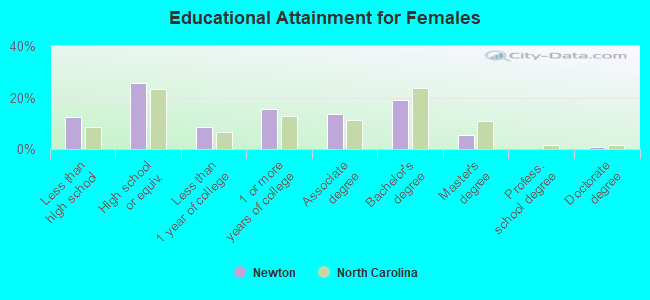
Education attainment for females 25 years and older:
- No schooling: 76
- Nursery to 4th grade: 1
- 5th and 6th grade: 34
- 7th and 8th grade: 59
- 9th grade: 194
- 10th grade: 90
- 11th grade: 54
- 12th grade, no diploma: 131
- High school graduate (or equivalency): 1,326
- Less than 1 year of college: 440
- Some college more than 1 year, no degree: 802
- Associate degree: 698
- Bachelor's degree: 995
- Master's degree: 275
- Professional school degree: 0
- Doctorate degree: 32


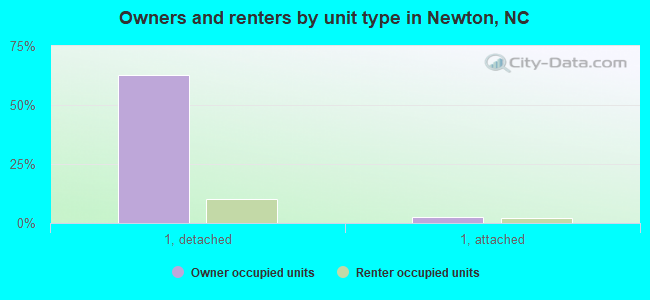
Housing units in structures:
- One, detached: 4,079
- One, attached: 351
- Two: 156
- 3 or 4: 225
- 5 to 9: 223
- 10 to 19: 251
- 20 to 49: 116
- 50 or more: 137
- Mobile homes: 151
Housing units lacking complete kitchen facilities in 2022: 4.3%
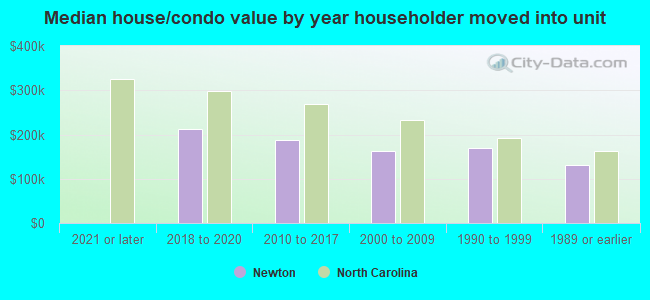
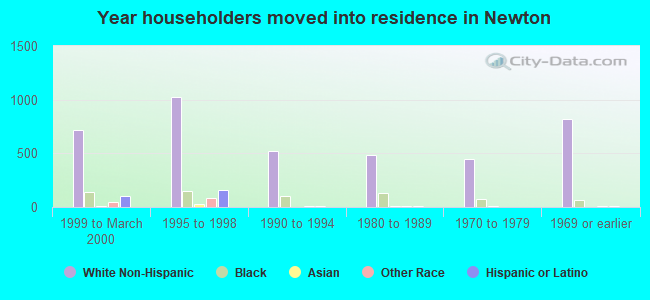
House/condo owner moved in on average 15 years ago
Renter moved in on average 6 years ago
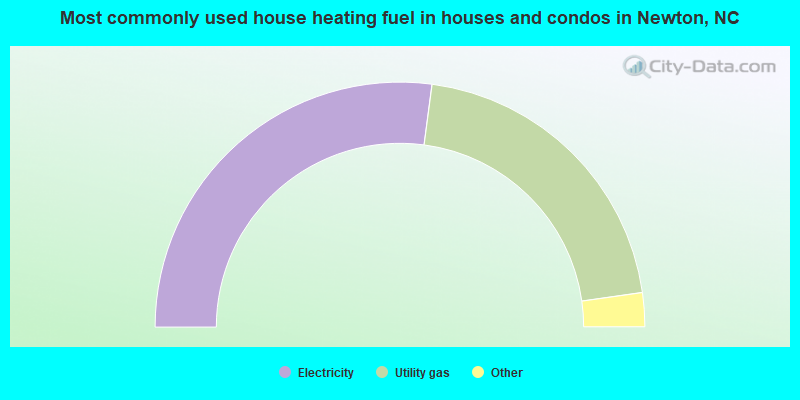
- 54.2%Electricity
- 41.3%Utility gas
- 2.1%Bottled, tank, or LP gas
- 1.4%Fuel oil, kerosene, etc.
- 0.6%No fuel used
- 0.3%Wood

- 73.7%Electricity
- 18.7%Utility gas
- 4.6%Bottled, tank, or LP gas
- 3.1%Fuel oil, kerosene, etc.
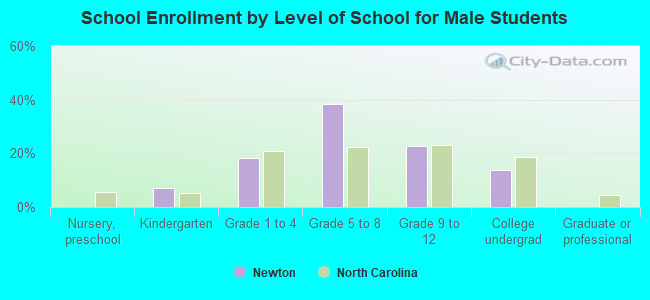
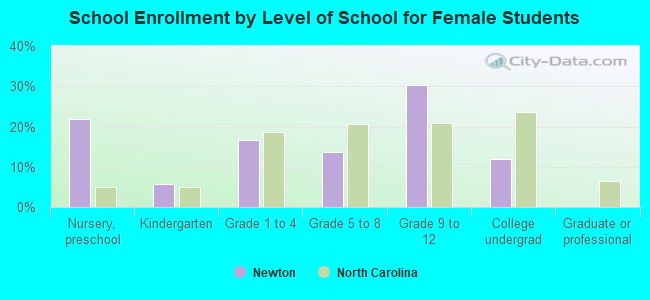
Private vs. public school enrollment:
| Here: | 1.0% |
| North Carolina: | 13.8% |
| Here: | 4.5% |
| North Carolina: | 11.9% |
| Here: | 40.8% |
| North Carolina: | 19.3% |