New Castle, NY (New York) Houses and Residents
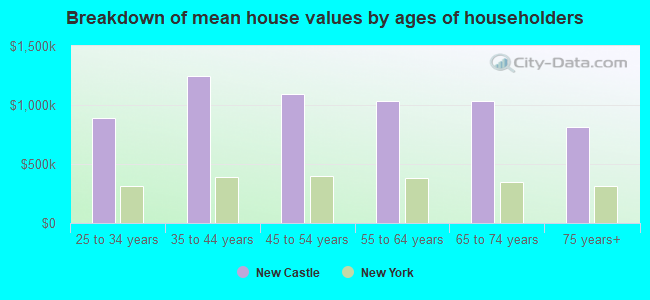
| New Castle: | $1,170,315 |
| New York: | $400,400 |
Total population: 17,569 (Urban population: 16,103, Rural population: 1,388 (all nonfarm))
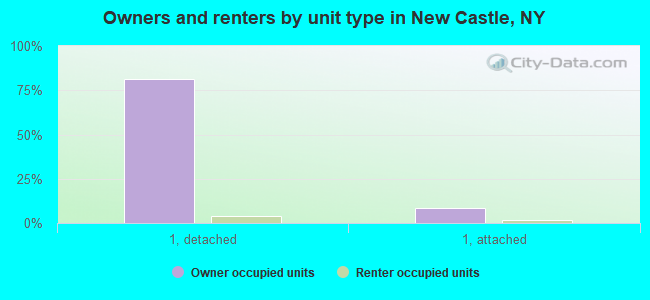
Houses: 5,843 (5,732 occupied: 5,258 owner occupied, 474 renter occupied)
| % of renters here: | 8% |
| State: | 46% |
Housing density: 252 houses/condos per square mile
Median price asked for vacant for-sale houses and condos in 2022 in this county: $406,754.
Median contract rent in 2022: over $2,000 (lower quartile is $1,657, upper quartile is over $2,000)
Median gross rent in New Castle, NY in 2022: over $2,000
Housing units in New Castle with a mortgage: 3,649 (337 second mortgage, 509 home equity loan, 8 both second mortgage and home equity loan)
Houses without a mortgage: 1,235
Compare current foreclosures near New Castle, NY:
| Photo | Address | Area | Beds / Baths | Price | Details |
|---|---|---|---|---|---|

|
#1
Lenni Lenape Ct
Stony Point, NY 10980
|
3,252 sq. feet
|
3 baths 4 beds |
$699,900
|
show details |

|
#2
Olcott Way # 122
Ridgefield, CT 06877
|
920 sq. feet
|
1 baths 1 beds |
$349,900
|
show details |

|
#3
Chalmers Blvd
Amawalk, NY 10501
|
1,072 sq. feet
|
1 baths 1 beds |
$475,000
|
show details |

|
#4
Central Park Ave Apt 9m
Yonkers, NY 10710
|
1,300 sq. feet
|
2 baths 3 beds |
$319,900
|
show details |

|
#5
Fox Island Rd
Port Chester, NY 10573
|
- sq. feet
|
6 baths 6 beds |
$910,000
|
show details |

|
#6
N Riverside Ave
Croton On Hudson, NY 10520
|
1,642 sq. feet
|
2 baths 3 beds |
$585,000
|
show details |

|
#7
Crane Ave
White Plains, NY 10603
|
2,400 sq. feet
|
2 baths 4 beds |
$654,500
|
show details |

|
#8
N Main St Apt C-15
Spring Valley, NY 10977
|
800 sq. feet
|
1 baths 1 beds |
$85,000
|
show details |

|
#9
Croton Park Rd
Cortlandt Manor, NY 10567
|
658 sq. feet
|
1 baths 1 beds |
$176,900
|
show details |

|
#10
Limerick St
Stamford, CT 06902
|
1,382 sq. feet
|
4 baths 5 beds |
$919,900
|
show details |
| Photo | Address | Area | Beds / Baths | Price | Details |
|---|---|---|---|---|---|

|
#11
Riverdale Ave
Port Chester, NY 10573
|
1,616 sq. feet
|
1 baths 3 beds |
$639,900
|
show details |

|
#12
Sylvan Knoll Rd
Stamford, CT 06902
|
1,100 sq. feet
|
1 baths 2 beds |
$339,900
|
show details |

|
#13
N Broadway
Irvington, NY 10533
|
850 sq. feet
|
1 baths 2 beds |
$315,000
|
show details |

|
#14
Raven Ct
Armonk, NY 10504
|
- sq. feet
|
2 baths 3 beds |
$1,560,000
|
show details |

|
#15
Tuttle St
Stamford, CT 06902
|
- sq. feet
|
1 baths 3 beds |
$262,500
|
show details |

|
#16
County Center Rd
White Plains, NY 10603
|
- sq. feet
|
2 baths 3 beds |
$540,800
|
show details |

|
#17
Talmadge Hill Rd
Darien, CT 06820
|
- sq. feet
|
4 baths 5 beds |
$2,275,250
|
show details |

|
#18
Tempo Rd
New City, NY 10956
|
- sq. feet
|
1 baths 3 beds |
$799,900
|
show details |

|
#19
Walnut Dr
Mahopac, NY 10541
|
1,921 sq. feet
|
2 baths 4 beds |
show details | |

|
#20
Albro Ln
White Plains, NY 10603
|
1,315 sq. feet
|
1 baths 3 beds |
show details |
| Photo | Address | Area | Beds / Baths | Price | Details |
|---|---|---|---|---|---|

|
#21
Bridge Ln
Haverstraw, NY 10927
|
2,364 sq. feet
|
3 baths 2 beds |
show details | |

|
#22
Farley Dr
West Haverstraw, NY 10993
|
1,260 sq. feet
|
2 baths 3 beds |
show details | |

|
#23
Hunters Run
Dobbs Ferry, NY 10522
|
1,046 sq. feet
|
1 baths 1 beds |
show details | |

|
#24
Hoyt St
New Canaan, CT 06840
|
3,020 sq. feet
|
4 baths 4 beds |
show details | |

|
#25
Lea Ct
Pomona, NY 10970
|
3,188 sq. feet
|
3 baths 5 beds |
show details | |

|
#26
Brodwood Dr
Stamford, CT 06902
|
5,103 sq. feet
|
5 baths 5 beds |
show details | |

|
#27
Kipling Dr
Yorktown Heights, NY 10598
|
2,102 sq. feet
|
2 baths 3 beds |
show details | |

|
#28
Parmly Ct
Mohegan Lake, NY 10547
|
480 sq. feet
|
1 baths 2 beds |
show details | |

|
#29
Old State Rd
Highland Falls, NY 10928
|
2,228 sq. feet
|
3 baths 4 beds |
show details | |

|
#30
Palisade Ave
White Plains, NY 10607
|
1,272 sq. feet
|
2 baths 4 beds |
show details |
| Photo | Address | Area | Beds / Baths | Price | Details |
|---|---|---|---|---|---|

|
#31
Juana St
Tuckahoe, NY 10707
|
1,076 sq. feet
|
1 baths 3 beds |
show details | |

|
#32
Komonchak Cir
West Haverstraw, NY 10993
|
1,350 sq. feet
|
3 baths 3 beds |
show details | |

|
#33
S End Ct
Old Greenwich, CT 06870
|
3,560 sq. feet
|
5 baths 6 beds |
show details | |

|
#34
Spring Rd
Mahopac, NY 10541
|
625 sq. feet
|
1 baths 2 beds |
show details | |

|
#35
Greenwich Ave Apt 1-1a
Stamford, CT 06902
|
1,354 sq. feet
|
2 baths 3 beds |
show details | |

|
#36
New Holland Vlg
Nanuet, NY 10954
|
819 sq. feet
|
1 baths 1 beds |
show details | |

|
#37
Hollywood Pl
Granite Springs, NY 10527
|
3,352 sq. feet
|
2 baths 3 beds |
show details | |

|
#38
Komonchak Cir
West Haverstraw, NY 10993
|
1,350 sq. feet
|
3 baths 2 beds |
show details | |

|
#39
Spruce St
Stamford, CT 06902
|
1,800 sq. feet
|
3 baths 3 beds |
show details | |

|
#40
Strawberry Hill Ave Unit 305
Stamford, CT 06902
|
403 sq. feet
|
1 baths 1 beds |
show details |
| Photo | Address | Area | Beds / Baths | Price | Details |
|---|---|---|---|---|---|

|
#41
Midget Ln
Mohegan Lake, NY 10547
|
812 sq. feet
|
1 baths 4 beds |
show details | |

|
#42
Bullet Hole Rd
Mahopac, NY 10541
|
1,456 sq. feet
|
2 baths 3 beds |
show details | |

|
#43
Sears Ave
Elmsford, NY 10523
|
1,070 sq. feet
|
1 baths 3 beds |
show details | |

|
#44
Stonecrest Dr
Thiells, NY 10984
|
2,212 sq. feet
|
3 baths 5 beds |
show details | |

|
#45
Sand St
Garnerville, NY 10923
|
2,344 sq. feet
|
2 baths 4 beds |
show details | |

|
#46
Randolph Rd
White Plains, NY 10607
|
2,009 sq. feet
|
1 baths 4 beds |
show details | |

|
#47
Danby Pl
Yonkers, NY 10710
|
1,389 sq. feet
|
2 baths 3 beds |
show details | |

|
#48
N Ridge St
Port Chester, NY 10573
|
1,581 sq. feet
|
3 baths 3 beds |
show details | |

|
#49
Rockledge Rd
Mahopac, NY 10541
|
1,296 sq. feet
|
2 baths 4 beds |
show details | |

|
Check over 1 million property listings on Foreclosure.com!
|
browse all offers | |||

Household type by relationship:
Households: 920,409- In family households: 787,571 (154,325 male householders, 82,094 female householders)
177,077 spouses, 289,201 children (277,229 natural, 5,836 adopted, 6,136 stepchildren), 13,465 grandchildren, 12,621 brothers or sisters, 11,677 parents, foster children, 16,923 other relatives, 23,097 non-relatives
- In nonfamily households: 132,838 (45,065 male householders (36,259 living alone)), 65,748 female householders (58,355 living alone)), 22,025 nonrelatives
- In group quarters: 28,704 (13,258 institutionalized population)
167,242 married couples with children.
43,170 single-parent households (7,022 men, 36,148 women).
84.7% of residents of New Castle speak English at home.
3.6% of residents speak Spanish at home (75% speak English very well, 14% speak English well, 7% speak English not well, 4% don't speak English at all).
7.7% of residents speak other Indo-European language at home (86% speak English very well, 9% speak English well, 5% speak English not well).
3.0% of residents speak Asian or Pacific Island language at home (75% speak English very well, 15% speak English well, 9% speak English not well, 1% don't speak English at all).
1.1% of residents speak other language at home (86% speak English very well, 14% speak English well).
Foreign born population: 2,445 (13.0%)
(90.9% of them are naturalized citizens)
| Here: | 8.7 |
| State: | 6.3 |
| Here: | 4.9 |
| State: | 3.8 |
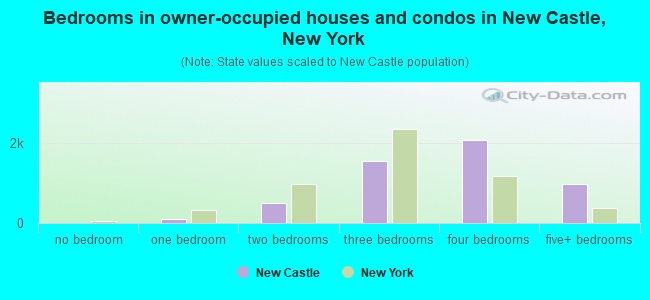
- Bedrooms in owner-occupied houses and condos in New Castle, New York
- 0no bedroom
- 1081 bedroom
- 5132 bedrooms
- 1,5643 bedrooms
- 2,0954 bedrooms
- 9785+ bedrooms
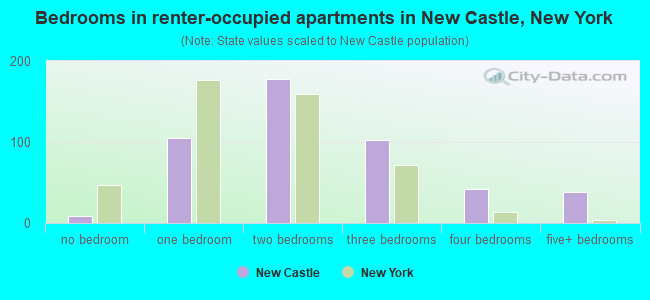
- Bedrooms in renter-occupied apartments in New Castle, New York
- 9no bedroom
- 1051 bedroom
- 1782 bedrooms
- 1023 bedrooms
- 424 bedrooms
- 385+ bedrooms
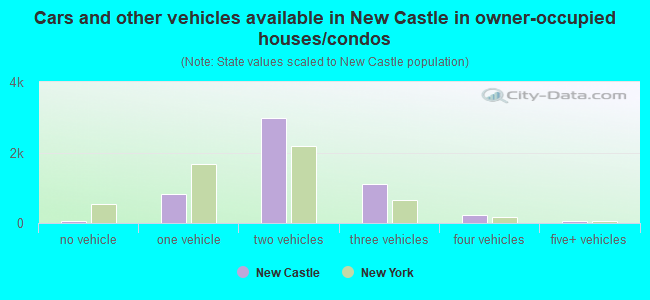
- Cars and other vehicles available in New Castle in owner-occupied houses/condos
- 57no vehicle
- 8171 vehicle
- 2,9852 vehicles
- 1,1033 vehicles
- 2384 vehicles
- 585+ vehicles
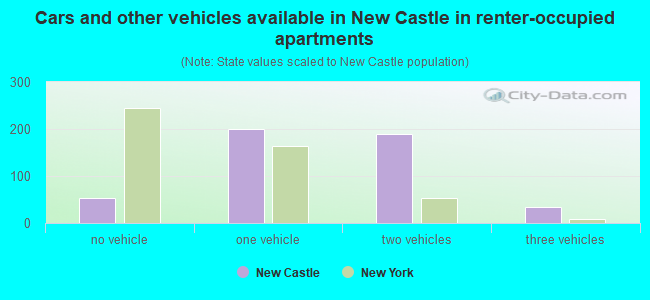
- Cars and other vehicles available in New Castle in renter-occupied apartments
- 53no vehicle
- 1991 vehicle
- 1892 vehicles
- 333 vehicles
- 04 vehicles
- 05+ vehicles
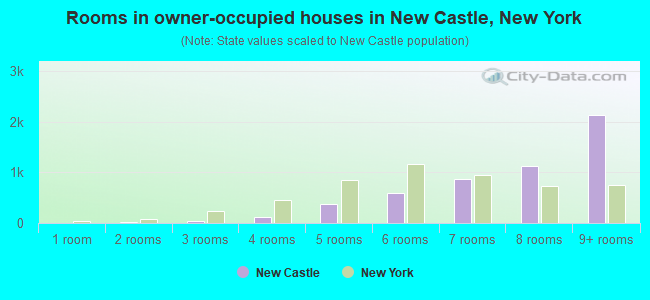
- Rooms in owner-occupied houses in New Castle, New York
- 01 room
- 162 rooms
- 333 rooms
- 1144 rooms
- 3805 rooms
- 5856 rooms
- 8707 rooms
- 1,1238 rooms
- 2,1379+ rooms
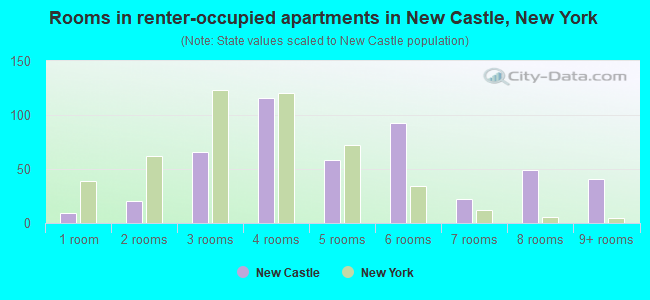
- Rooms in renter-occupied apartments in New Castle, New York
- 91 room
- 202 rooms
- 663 rooms
- 1164 rooms
- 585 rooms
- 936 rooms
- 227 rooms
- 498 rooms
- 419+ rooms
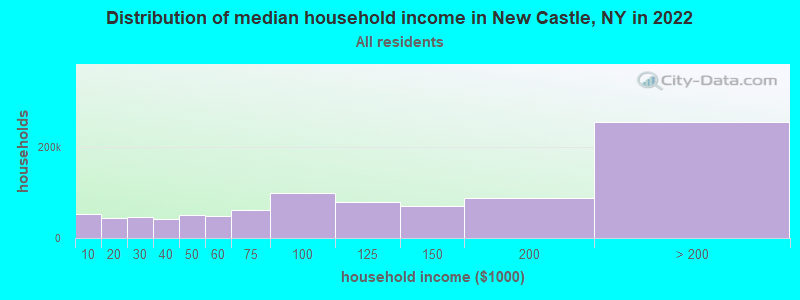
New Castle, NY household income distribution

- 52,570Less than $10,000
- 43,935$10,000 to $19,999
- 46,150$20,000 to $29,999
- 41,773$30,000 to $39,999
- 50,218$40,000 to $49,999
- 48,752$50,000 to $59,999
- 62,571$60,000 to $74,999
- 98,273$75,000 to $99,999
- 78,688$100,000 to $124,999
- 71,163$125,000 to $149,999
- 88,508$150,000 to $199,999
- 255,485$200,000 or more
Percentage of workers working in this county: 58.5%
Number of people working at home: 1,717 (18.0% of all workers)
Travel time to work (commute)
- Less than 5 minutes: 181
- 5 to 9 minutes: 489
- 10 to 14 minutes: 681
- 15 to 19 minutes: 667
- 20 to 24 minutes: 803
- 25 to 29 minutes: 356
- 30 to 34 minutes: 745
- 35 to 39 minutes: 285
- 40 to 44 minutes: 223
- 45 to 59 minutes: 613
- 60 to 89 minutes: 1,774
- 90 or more minutes: 890
Means of transportation to work:
- Drove a car alone: 5,086 (61.2%)
- Carpooled: 435 (5.2%)
- Bus or trolley bus: 9 (0.1%)
- Subway or elevated: 59 (0.7%)
- Railroad: 2,025 (24.4%)
- Ferryboat: 8 (0.1%)
- Bicycle: 5 (0.1%)
- Walked: 41 (0.5%)
- Other means: 39 (0.5%)
- Worked at home: 602 (7.2%)
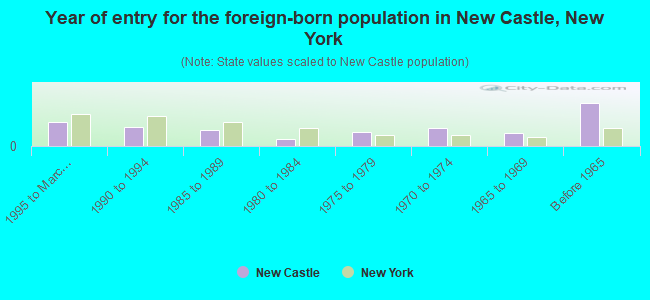
- Year of entry for the foreign-born population in New Castle, New York
- 3021995 to March 2000
- 2451990 to 1994
- 2061985 to 1989
- 951980 to 1984
- 1801975 to 1979
- 2321970 to 1974
- 1641965 to 1969
- 546Before 1965
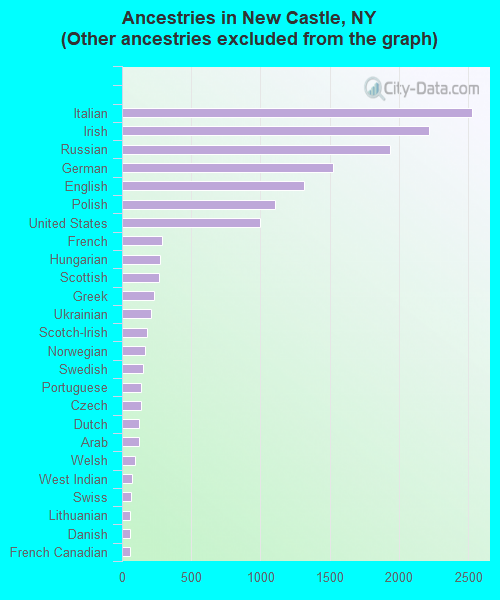
First ancestries reported:
- Other: 5,171 (26.5%)
- Italian: 2,525 (12.9%)
- Irish: 2,217 (11.3%)
- Russian: 1,939 (9.9%)
- German: 1,524 (7.8%)
- English: 1,317 (6.7%)
- Polish: 1,105 (5.7%)
- United States: 1,000 (5.1%)
- French: 291 (1.5%)
- Hungarian: 274 (1.4%)
- Scottish: 267 (1.4%)
- Greek: 228 (1.2%)
- Ukrainian: 209 (1.1%)
- Scotch-Irish: 183 (0.9%)
- Norwegian: 169 (0.9%)
- Swedish: 153 (0.8%)
- Portuguese: 140 (0.7%)
- Czech: 136 (0.7%)
- Dutch: 123 (0.6%)
- Arab: 120 (0.6%)
- Welsh: 96 (0.5%)
- West Indian: 71 (0.4%)
- Swiss: 67 (0.3%)
- Lithuanian: 59 (0.3%)
- Danish: 58 (0.3%)
- French Canadian: 58 (0.3%)
- Slovak: 22 (0.1%)
- Subsaharan African: 12 (0.06%)
Most common places of birth for foreign-born residents (%):
| New Castle: | 10.6% (209) |
| New York: | 3.0% (117,238) |
| New Castle: | 7.2% (142) |
| New York: | 1.6% (62,237) |
| New Castle: | 6.9% (135) |
| New York: | 6.0% (233,766) |
| New Castle: | 4.9% (97) |
| New York: | 3.8% (147,729) |
| New Castle: | 3.6% (71) |
| New York: | 0.8% (32,034) |
| New Castle: | 3.6% (70) |
| New York: | 2.9% (111,727) |
| New Castle: | 3.4% (67) |
| New York: | 1.8% (69,327) |
| New Castle: | 3.2% (63) |
| New York: | 0.8% (30,473) |
| New Castle: | 3.1% (62) |
| New York: | 0.3% (12,209) |
| New Castle: | 2.9% (58) |
| New York: | 0.8% (29,390) |
| New Castle: | 2.9% (57) |
| New York: | 1.3% (51,055) |
| New Castle: | 2.8% (55) |
| New York: | 1.1% (41,934) |
| New Castle: | 2.5% (50) |
| New York: | 2.4% (94,595) |
| New Castle: | 2.5% (49) |
| New York: | 2.5% (97,933) |
| New Castle: | 2.4% (48) |
| New York: | 2.4% (93,187) |
| New Castle: | 2.4% (48) |
| New York: | 1.0% (37,496) |
| New Castle: | 2.3% (45) |
| New York: | 0.9% (33,208) |
| New Castle: | 2.3% (45) |
| New York: | 0.4% (17,401) |
| New Castle: | 1.7% (33) |
| New York: | 1.4% (54,876) |
| New Castle: | 1.7% (33) |
| New York: | 0.5% (19,907) |
| New Castle: | 1.5% (30) |
| New York: | 1.9% (72,408) |
Place of birth for U.S.-born residents:
- This state: 12,073
- Other state: 3,226
- Northeast: 1,530
- Midwest: 690
- South: 654
- West: 352
71% of New Castle residents lived in the same house 5 years ago.
Out of people who lived in different houses, 50% lived in this county.
Out of people who lived in different counties, 66% lived in New York.
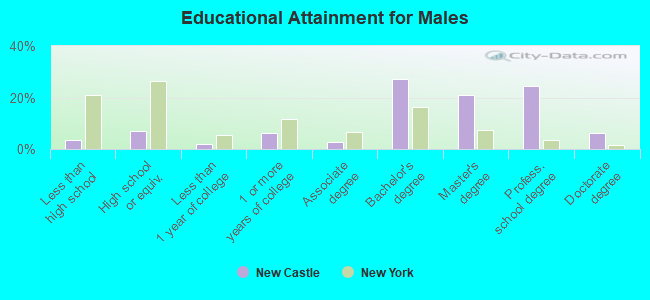
Education attainment for males 25 years and older:
- No schooling: 33
- Nursery to 4th grade: 0
- 5th and 6th grade: 33
- 7th and 8th grade: 37
- 9th grade: 6
- 10th grade: 32
- 11th grade: 10
- 12th grade, no diploma: 37
- High school graduate (or equivalency): 373
- Less than 1 year of college: 106
- Some college more than 1 year, no degree: 338
- Associate degree: 143
- Bachelor's degree: 1,484
- Master's degree: 1,133
- Professional school degree: 1,335
- Doctorate degree: 340
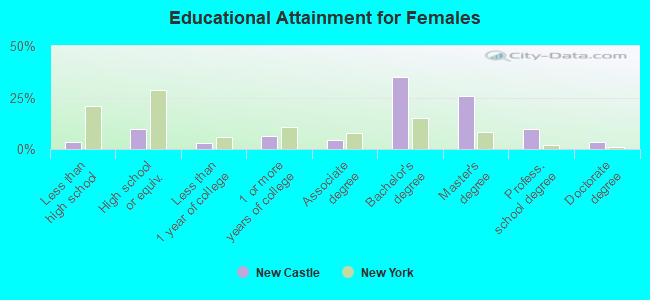
Education attainment for females 25 years and older:
- No schooling: 21
- Nursery to 4th grade: 6
- 5th and 6th grade: 8
- 7th and 8th grade: 43
- 9th grade: 14
- 10th grade: 37
- 11th grade: 13
- 12th grade, no diploma: 64
- High school graduate (or equivalency): 586
- Less than 1 year of college: 175
- Some college more than 1 year, no degree: 363
- Associate degree: 259
- Bachelor's degree: 2,083
- Master's degree: 1,523
- Professional school degree: 564
- Doctorate degree: 189


Housing units in structures:
- One, detached: 4,951
- One, attached: 582
- Two: 99
- 3 or 4: 104
- 5 to 9: 74
- 10 to 19: 21
- 20 to 49: 5
- Boats, RVs, vans, etc.: 7
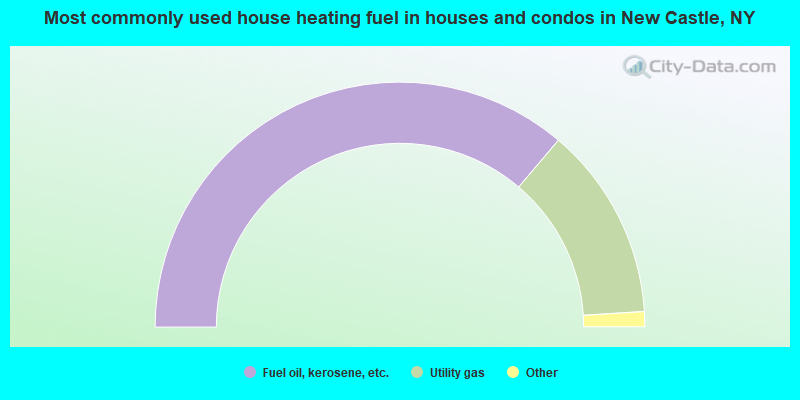
- 72.4%Fuel oil, kerosene, etc.
- 25.6%Utility gas
- 1.7%Electricity
- 0.2%Bottled, tank, or LP gas
- 0.1%Other fuel
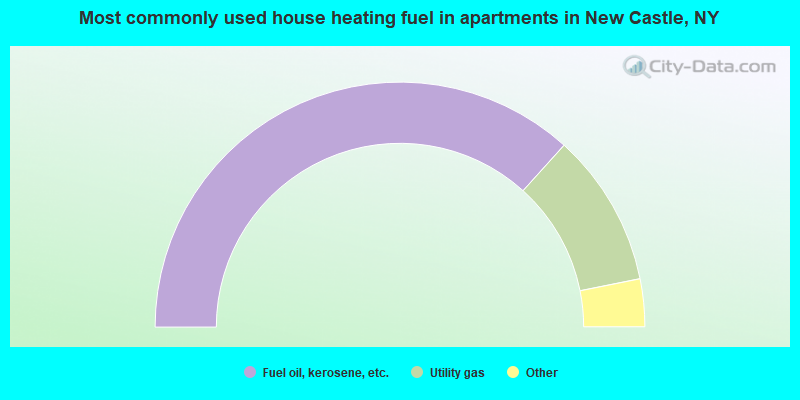
- 73.4%Fuel oil, kerosene, etc.
- 20.3%Utility gas
- 3.2%Electricity
- 1.9%Wood
- 1.3%Bottled, tank, or LP gas
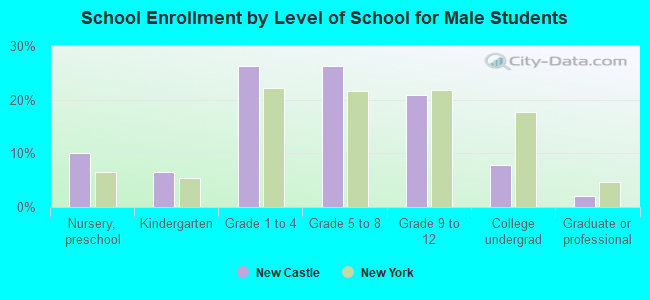
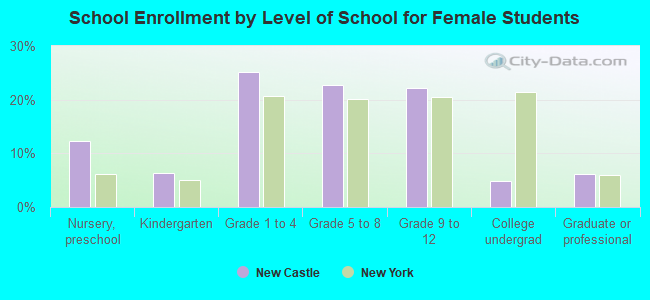
Private vs. public school enrollment:
| Here: | 6.4% |
| New York: | 14.0% |
| Here: | 12.9% |
| New York: | 13.2% |
| Here: | 66.2% |
| New York: | 38.2% |